http://www.sciencepublishinggroup.com/j/ijdst doi: 10.11648/j.ijdst.20200601.12
ISSN: 2472-2200 (Print); ISSN: 2472-2235 (Online)
Data Analysis: Types, Process, Methods, Techniques and
Tools
Mohaiminul Islam
School of Intelligent Technology and Engineering, Chongqing University of Science and Technology, Chongqing, China
Email address:
To cite this article:
Mohaiminul Islam. Data Analysis: Types, Process, Methods, Techniques and Tools. International Journal on Data Science and Technology. Vol. 6, No. 1, 2020, pp. 10-15. doi: 10.11648/j.ijdst.20200601.12
Received: December 11, 2019; Accepted: December 25; Published: January 6, 2020
Abstract:
The process of evaluating data using analytical and logical reasoning to examine each component of the data provided. This form of analysis is just one of the many steps that must be completed when conducting a research experiment. Data from various sources is gathered, reviewed, and then analyzed to form some sort of finding or conclusion. There are a variety of specific data analysis method, some of which include data mining, text analytics, business intelligence, and data visualizations. Data analysis is defined as a process of cleaning, transforming, and modeling data to discover useful information for business decision-making. The purpose of Data Analysis is to extract useful information from data and taking the decision based upon the data analysis. whenever we take any decision in our day-to-day life is by thinking about what happened last time or what will happen by choosing that particular decision. This is nothing but analyzing our past or future and making decisions based on it. For that, we gather memories of our past or dreams of our future. So that is nothing but data analysis. Now same thing analyst does for business purposes, is called Data Analysis. This research article based on data analysis, it’s types, process, methods, techniques & tools.Keywords:
Data, Visualization, Data Analysis, Business, Statistics1. Introduction
To grow your business even to grow in your life, sometimes all you need to do is Analysis! If your business is not growing, then you have to look back and acknowledge your mistakes and make a plan again without repeating those mistakes. And even if your business is growing, then you have to look forward to making the business to grow more. All you need to do is analyze your business data and business processes [1]. Data analysis is a practice in which raw data is ordered and organized so that useful information can be extracted from it [2]. The process of organizing and thinking about data is key to understanding what the data does and does not contain. There are a variety of ways in which people can approach data analysis, and it is notoriously easy to manipulate data during the analysis phase to push certain conclusions or agendas. For this reason, it is important to pay attention when data analysis is presented, and to think critically about the data and the conclusions which were drawn [3].
Raw data can take a variety of forms, including measurements, survey responses, and observations. In its raw
form, this information can be incredibly useful, but also overwhelming. Over the course of the data analysis process, the raw data is ordered in a way which will be useful. For example, survey results may be tallied, so that people can see at a glance how many people answered the survey, and how people responded to specific questions. In the course of organizing the data, trends often emerge, and these trends can be highlighted in the write up of the data to ensure that readers take note. In a casual survey of ice cream preferences, for example, more women than men might express a fondness for chocolate [4], and this could be a point of interest for the researcher. Modeling the data with the use of mathematics and other tools can sometimes exaggerate such points of interest in the data, making them easier for the researcher to see.
form of an appendix so that people can look up specifics for themselves. When people encounter summarized data and conclusions, they should view them critically [5]. Asking where the data is from is important, as is asking about the sampling method used to collect the data, and the size of the sample. If the source of the data appears to have a conflict of interest with the type of data being gathered, this can call the results into question. Likewise, data gathered from a small sample or a sample which is not truly random may be of questionable utility. Reputable researchers will always provide information about the data gathering techniques used, the source of funding, and the point of the data collection in the beginning of the analysis so that readers can think about this information while they review the analysis.
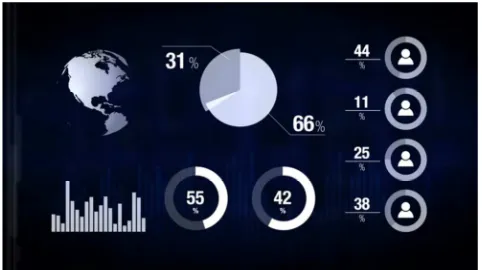
Figure 1. Data Analysis Report.
2. Types of Data Analysis
There are several types of data analysis techniques that exist based on business and technology. The major types of data analysis are:
1.Text Analysis 2.Statistical Analysis 3.Diagnostic Analysis 4.Predictive Analysis 5.Prescriptive Analysis
2.1. Text Analysis
Text Analysis is also referred to as Data Mining. It is a method to discover a pattern in large data sets using databases or data mining tools. It used to transform raw data into business information. Business Intelligence tools are present in the market which is used to take strategic business decisions. Overall it offers a way to extract and examine data and deriving patterns and finally interpretation of the data [6].
2.2. Statistical Analysis
Statistical Analysis shows "What happen?" by using past data in the form of dashboards. Statistical Analysis includes collection, Analysis, interpretation, presentation, and modeling of data. It analyses a set of data or a sample of data. There are two categories of this type of Analysis - Descriptive Analysis and Inferential Analysis.
2.3. Descriptive Analysis
Analyses complete data or a sample of summarized numerical data. It shows mean and deviation for continuous data whereas percentage and frequency for categorical data.
2.4. Inferential Analysis
Analyses sample from complete data. In this type of Analysis, you can find different conclusions from the same data by selecting different samples [7].
2.5. Diagnostic Analysis
Diagnostic Analysis shows "Why did it happen?" by finding the cause from the insight found in Statistical Analysis. This Analysis is useful to identify behavior patterns of data. If a new problem arrives in your business process, then you can look into this Analysis to find similar patterns of that problem. And it may have chances to use similar prescriptions for the new problems.
2.6. Predictive Analysis
Predictive Analysis shows "what is likely to happen" by using previous data. The simplest example is like if last year I bought two dresses based on my savings and if this year my salary is increasing double then I can buy four dresses. But of course it's not easy like this because you have to think about other circumstances like chances of prices of clothes is increased this year or maybe instead of dresses you want to buy a new bike, or you need to buy a house [8-10]!
So here, this Analysis makes predictions about future outcomes based on current or past data. Forecasting is just an estimate. Its accuracy is based on how much detailed information you have and how much you dig in it.
2.7. Prescriptive Analysis
Prescriptive Analysis combines the insight from all previous Analysis to determine which action to take in a current problem or decision. Most data-driven companies are utilizing Prescriptive Analysis because predictive and descriptive Analysis are not enough to improve data performance. Based on current situations and problems, they analyze the data and make decisions.
3. Process of Data Analysis
For most businesses and government agencies, lack of data isn’t a problem. In fact, it’s the opposite: there’s often too much information available to make a clear decision.
the hypothesis and evaluate the outcomes [11]. Data collection methods can be divided into two categories: secondary methods of data collection and primary methods of data collection. Secondary data is a type of data that has already been published in books, newspapers, magazines, journals, online portals, etc. There is an abundance of data available in these sources about your research area in business studies, almost regardless of the nature of the research area. Therefore, the application of the appropriate set of criteria to select secondary data to be used in the study plays an important role in terms of increasing the levels of research validity and reliability. Primary data collection methods can be divided into two groups: quantitative and qualitative. Quantitative data collection methods are based in mathematical calculations in various formats. Methods of quantitative data collection and analysis include questionnaires with closed-ended questions, methods of correlation and regression, mean, mode and median and others. Quantitative methods are cheaper to apply and they can be applied within a shorter duration of time compared to qualitative methods. Moreover, due to a high level of standardization of quantitative methods, it is easy to make comparisons of findings. Qualitative research methods, on the contrary, do not involve numbers or mathematical calculations. Qualitative research is closely associated with words, sounds, feelings, emotions, colors and other elements that are non-quantifiable [12].
Figure 2. Steps of data analysis.
Data cleaning is a crucial part of data analysis, particularly when you collect your own quantitative data. After you collect the data, you must enter it into a computer program such as SAS, SPSS, or Excel. During this process, whether it is done by hand or a computer scanner does it, there will be errors. No matter how carefully the data has been entered, errors are inevitable. This could mean incorrect coding, incorrect reading of written codes, incorrect sensing of blackened marks, missing data, and so on. Data cleaning is the process of detecting and correcting these coding errors. There are two types of data cleaning that needs to be performed to data sets. They are possible code cleaning and contingency cleaning. Both are crucial to the data analysis process because if ignored, you will almost always produce misleading research finding. After clean the data we can go for analyze the data [13].
Nowadays there are several tools for data analysis. The last part of the process of data analysis is to interpret results and apply them.
4. Methods of Data Analysis
Since our expertise at Import.io is in data from the web, we’ll discuss the methods of analysis for data from the web. The steps leading up to web data analysis are: identify, extract, prepare, integrate, and consume. In traditional manual data analysis each of these steps take a substantial amount of time to perform. Identifying the data you need can be challenging with the vast amount of data on the web. You may choose a data source that isn’t reliable or miss crucial data sources that should be part of your research. Reliable and complete data is necessary for accurate data analysis.
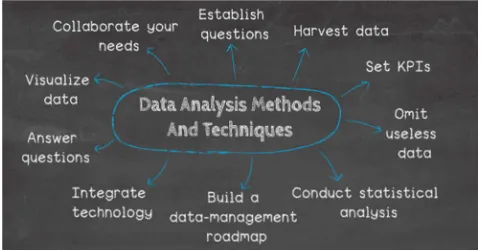
Figure 3. Data analysis methods & techniques.
Extracting data from the web has traditionally required a web scraper that is coded to scrape data from a certain website according to certain parameters. For example, traditional Twitter sentiment analysis might use a web scraper that is coded to scrape tweets that mention your brand name. Creating and running these web scrapers takes time. And even once it’s finished, it’s possible the data could be incomplete or inaccurate [14]. The parameters for which tweets will be scraped could be missing a rule, resulting in missing crucial data. Preparing data for analysis requires many steps that each take a long time to do manually. The data must be cleansed, standardized, transformed, etc. This is where a lot of the out dating happens. By the time the data is ready, it is not as recent and there is newer data out there.
Integrating the data with your data analysis software can be an issue depending on which software your organization uses. And it needs to be integrated so that it can be consumed.
5. Data Analysis Tools
the top data analysis tools based on popularity, teaching and results, both open source and paid.
5.1. R Programming
R is a programming language and free software environment for statistical computing and graphics supported by the R Foundation for Statistical Computing. The R language is widely used among statisticians and data miners for developing statistical software and data analysis. It is a free language and software for statistical computing and graphics programming. R is the industry’s leading analytical tool, commonly used in data modeling and statistics. You can manipulate and present your information readily in various ways. SAS has in numerous ways exceeded data capacity,
performance, and results. R compiles and operates on many platforms including -macOS, Windows, and Linux. t has the option to navigate packages by category 11,556 packages. R also offers instruments to install all the packages automatically, which can be well-assembled with large information according to the user’s needs [15].
5.2. Tableau Public
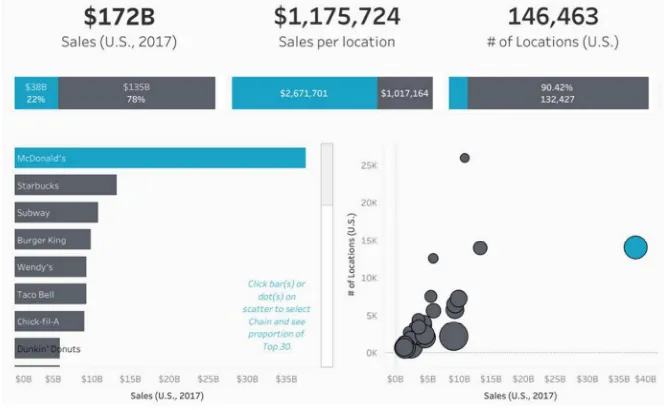
Tableau Public offers free software that links any information source, including corporate data warehouse, web-based information or Microsoft Excel, generates information displays, dashboards, maps, and so on and that present on the web in real-time.
Figure 4. Tableau visualization report.
It can be communicated with the customer or via social media. Access to the file can be downloaded in various formats We need very good data sources if you’d like to see the power of the tableau. The big data capacities of Tableau make information essential and better than any other data visualization software on the market can be analyzed and visualized.
Figure 5. Python visualization.
5.3. Python
Python is an object-oriented, user-friendly as well as open-source language that can be read, written, maintained
Ruby, and PHP are very comparable. Python also has very nice libraries for machine learning, e.g. Keras, TensorFlow, Theano, and Scikitlearn. As we all know that python is an important feature because of that python can assemble in any platform such as MongoDB, JSON, SQL Server and many more. We can also say that python can also handle the data text in a very great manner. Python is quite simple, so it is easy to know and for that, we need as a uniquely readable syntax. The developers can be much easier than other languages to read and translate Python code.
5.4. SAS
SAS stands for Statistical Analysis System. It was created by the SAS Institute in 1966 and further developed in the 1980s and 1990s, is a programming environment and language for data management and an analytical leader. SAS is readily available, easy to manage and information from all sources can be analyzed. In 2011, SAS launched a wide range of customer intelligence goods and many SAS modules, commonly applied to client profiling and future opportunities, for Web, social media and marketing analytics. It can also predict, manage and optimize their behavior. It uses memory and distributed processing to quickly analyze enormous databases. Also, this instrument helps to model predictive information.
5.5. Apache Spark
Apache was created in 2009 by the University of California, AMP Lab of Berkeley. Apache Spark is a quick-scale data processing engine and runs apps 100 times quicker in memory and 10 times quicker on disk in Hadoop clusters. Spark is based on data science and its idea facilitates data science. Spark is also famous for the growth of information pipelines and machine models. Spark has also a library – MLlib that supplies a number of machine tools for recurring methods in the fields of information science such as regression, grading, clustering, collaborative filtration, etc. Apache Software Foundation launched Spark to speed up the Hadoop software computing process.
5.6. Excel
Excel is a Microsoft software program that is part of the software productivity suite Microsoft Office has developed. Excel is a core and common analytical tool generally used in almost every industry. Excel is essential when analytics on the inner information of the customer is required. It analyzes the complicated job of summarizing the information using a preview of pivot tables to filter the information according to customer requirements. Excel has the advanced option of business analytics to assist with the modeling of pre-created options such as automatic relationship detection, DAX measures, and time grouping. Excel is used in general to calculate cells, to pivot tables and to graph multiple instruments [16]. For example, you can create a monthly budget for Excel, track business expenses or sort and organize large amounts of data with an Excel table.
5.7. Rapid Miner
RapidMiner is a strong embedded data science platform created by the same firm, which carries out projective and other sophisticated analytics without any programming, such as data mining, text analytics, machine training, and visual analysis. Including Access, Teradata, IBM SPSS, Oracle, MySQL, Sybase, Excel, IBM DB2, Ingres, Dbase, etc, RapidMiner can also be used to create any source information, including Access. The instrument is very strong that analytics based on actual information conversion environments can be generated, For Example: For predictive analysis, you can manage formats and information sets.
6. Importance of Data Analytics for
Businesses
The increasing importance of Data Analytics for business has changed the world in the real sense but an average person remains unaware of the impact of data analytics in the business [17]. Some of the ways this has impacted the business include the following:
6.1. Improving Efficiency
All the data collected by the business is not only related to the individuals external to the organization. Most of the data collected by the businesses are analyzed internally. With the advancements in technology, it is become very convenient to collect data. This data helps to know the performance of the employees and also the business.
6.2. Market Understanding
With the development of algorithms nowadays, huge datasets can be collated and analyzed. This process of analysis is called Mining. Regarding the other kinds of physical resources, data collection is done in raw form and thereafter refined. This enables collection of data from a wide variety of people, which further proves out to be fruitful for better marketing strategy.
6.3. Cost Reduction
Big data technologies like cloud-based analytics and Hadoop can bring huge cost advantages if it relates to storage of large data. They can also identify the efficient ways to do business. You not only save money in terms of infrastructure but too, save on the cost of developing a product which would have a perfect market-fit.
6.4. Faster and Better Decision-Making
The high-speed in-memory analytics and Hadoop in combination with the ability for analyzing the new data sources, businesses can analyze the information almost instantly. This comes out to be a big time-saver as you can now deliver more efficiently and manage your deadlines with an ease.
6.5. New Products/Services
satisfaction of the customers are met in a better way. This helps one to make sure that the product/service aligns with the values of the target audience.
6.6. Industry Knowledge
Industry knowledge can be comprehended and it can show how a business can run in the near future. Also, it can tell you what kind of economy is already available for business expansion purpose. This, not only opens new avenues for businesses to grow but too, help build a strong ecosystem around the brand.
6.7. Witnessing the Opportunities
Though the economy is changing and the businesses want to keep pace with the trends, one important thing that most of the organizations aim for is profit-making. Here, Data Analytics offers refined sets of data that can help in observing the opportunities to avail.
7. Conclusion
The process of evaluating data using analytical and logical reasoning to examine each component of the data provided. This form of analysis is just one of the many steps that must be completed when conducting a research experiment. Data from various sources is gathered, reviewed, and then analyzed to form some sort of finding or conclusion. There are a variety of specific data analysis method, some of which include data mining, text analytics, business intelligence, and data visualizations. Importance of Data Analytics is truly changing the world. Whether it is the sports, the business field, or just the day-to-day activities of the human life, data analytics have changed the way people used to act. It now, not plays a major role in business, but too, is used in developing artificial intelligence, track diseases, understand consumer behavior and mark the weaknesses of the opponent contenders in sports or politics. This is the new age of data and it has unlimited potential. Every organization makes attempts to gather data, for instance, by monitoring its competitors’ performance, sales figures, and buying trends etc. in an effort to be more competitive. However, nobody can understand customers’ behaviors and competitors’ performance without the skills to analyze all that data. Data analysis, therefore, is a necessity for making well-informed and efficient decisions. Data analysis is what helps organizations determine their positions in the market relative to competitors. It is what helps us identify the potential risks that need to be avoided and the opportunities that must be grabbed in order to grow. It is, in fact, data analysis that enables us to gauge the satisfaction level of the customers and their needs in order to come up with new products and services that provide greater satisfaction to them. Therefore, it is an understatement to say that data analysis is important for the success of businesses.
References
[1] Sardar Mohkim Khan (26 January 2011). "DataMarket Expands Horizons: Adds 100 Million Time Series, 600 Million Facts".
[2] Tamara Munzner. "Process and Pitfalls in Writing Information Visualization Research Papers". www.cs.ubc.ca. Retrieved 9 April 2018.
[3] Pavlopoulos, Georgios A.; Iacucci, Ernesto; Iliopoulos, Ioannis; Bagos, Pantelis (2013). Interpreting the Omics 'era' Data. Multimedia Services in Intelligent Environments. Smart Innovation, Systems and Technologies.
[4] Benjamin B. Bederson and Ben Shneiderman (2003). The Craft of Information Visualization: Readings and Reflections, Morgan Kaufmann ISBN 1-55860-915-6.
[5] Manuela Aparicio and Carlos J. Costa (November 2014). "Data visualization". Communication Design Quarterly Review.
[6] "Data Visualization for Human Perception". The Interaction Design Foundation. Retrieved 2015-11-23.
[7] Lucić V, Förster F, Baumeister W (2005). "Structural studies by electron tomography: from cells to molecules". Annual Review of Biochemistry. 74: 833–65.
[8] Chang, J. Dean, S. Ghemawat, W. C. Hsieh, D. A. Wallach, M. Burrows, T. Chandra, A. Fikes, and R. E. Gruber. Bigtable: A Distributed Storage System for Structured Data. In OSDI, pages205–218, 2006.
[9] Rajeev Gupta, Himanshu Gupta, and Mukesh Mohania, "Cloud Computing and Big Data Analytics: What Is New from Database s Perspective?" S. Srinivasa and V. Bhatnagar (Eds.): BDA 2012, LNCS 7678, pp. Springer-Verlag Berlin Heidelberg 42–61, 2012.
[10]Curino, C., Jones, E. P. C., Popa, R. A., Malviya, N., Wu, E., Madden, S., Balakrishnan, H., Zeldovich, N.: Realtional Cloud: A Database-as-a-Service for the Cloud. In: Proceedings of Conference on Innovative Data Systems Research, CIDR-2011.
[11]Alberto Ferandez, Sara del R, Victoria opez, Abdullah Bawakid, Maria J. del Jesus, Jose M. Benitez, and Francisco Herrera. "Big Data with Cloud Computing: an insight on the computingenvironment, MapReduce, and programming frameworks". doi: 10.1002/widm.1134. WIREs Data Mining Knowl Discov, 4: 380–409, 2014.
[12]Lu, Huang, Ting-tin Hu, and Hai-shan Chen. "Research on Hadoop Cloud Computing Model and its Applications.". Hangzhou, China: 2012, pp. 59–63, 21-24 Oct. 2012.
[13]Wie, Jiang, Ravi V. T, and Agrawal G. "A Map-Reduce System with an Alternate API for Multi-core Environments.". Melbourne, VIC: 2010, pp. 84-93, 17-20 May. 2010.
[14]K, Chitharanjan, and Kala Karun A. "A review on hadoop - HDFS infrastructure exten-sions.". JeJu Island: 2013, pp. 132-137, 11-12 Apr. 2013.
[15]F. C. P, Muhtaroglu, Demir S, Obali M, and Girgin C. "Business model canvas perspective on big data applications." Big Data, 2013 IEEE International Conference, Silicon Valley, CA, Oct 6-9, p. 32–37, 2013.