Available online on 15.04.2019 at http://jddtonline.info
Journal of Drug Delivery and Therapeutics
Open Access to Pharmaceutical and Medical Research© 2011-18, publisher and licensee JDDT, This is an Open Access article which permits unrestricted non-commercial use, provided the original work is properly cited
Open Access
Research Article
Determination of cetirizine in human plasma and validation method using
HPLC technique
Siti Hazar Binti Zuhri a, Abul Kalam Azadb, Abdur Rashid Miab, ABM Helal Uddin a*, Mohamed Sufian Bin Mohd. Nawi a
*a Department of Pharmaceutical Chemistry, Faculty of Pharmacy, International Islamic University Malaysia (IIUM), 25200 Kuantan, Pahang,
Malaysia.
b Advanced Drug Delivery Laboratory, Department of Pharmaceutical Technology, Faculty of Pharmacy, International Islamic University
Malaysia (IIUM), 25200 Kuantan, Pahang, Malaysia.
ABSTRACT
This reseach project is dedicated to analyze cetirizine in human plasma by using HPLC qualitatively and quantitatively, to make a reliable bioanalysis of this drug in human plasma with a goal to utilise it in pharmacokinetics studies. In this research project, cetirizine was extracted from plasma using liquid-liquid extraction by dichloromethane and ethyl acetate. The results in terms of accuracy and precision are compared. For both of the methods, amlodipine was used as the internal standard. Separation was carried out by Phenomenex C18 chromato graphy column. The mobile phase used here is 35:65, v/v of Acetonitrile to 0.3% triethylamine (TEA) buffer fixed at pH 3 by phosphoric acid, with flow
rate of 1mL/min. The column temperature was set at 30°C. Variable wavelength detector (VWD) was used, and detection was set at 237 nm. The
analysis was linear from 30 ng/mL to 500 ng/mL. Overall the recovery is more than 90% when using dichloromethane and more tha n 65% when using ethyl acetate.
Keywords: Bioanalysis, Method validation, Cetirizine, Human plasma, HPLC
Article Info: Received 20 Feb 2019; Review Completed 29 March 2019; Accepted 03 April 2019; Available online 15 April 2019
Cite this article as:
Binti Zuhri SH, Azad AK, Mia AR, Uddin ABMH, Mohd. Nawi MSB, Determination of cetirizine in human plasma and validation method using HPLC technique, Journal of Drug Delivery and Therapeutics. 2019; 9(2-s):243-247
http://d x.doi.o rg/10.22270/jddt.v9i2 -s.2650
*Address for Correspondence:
Dr. ABM Helal Uddin, Associate Professor, Department of Pharmaceutical Chemistry, Faculty of Pharmacy, International Islamic University Malaysia, 25200 Kuantan, Pahang, Malaysia.
1.
INTRODUCTION
Cetirizine is the most common used medicine among the people globally. However, to determine of Cetirizine in human plasma level is more complicated technique 1. Therefore, the current approach was employed to develop and validate the suitable technique to determine its plasma level concentration. The present protocol was found the novel technique using HPLC.
Bioequivalence study requires bioanalytical method that is validated and reproducible. There are different bioanalytical methods available and one of them is using HPLC. Bioanalysis is used to describe quantitatively the substances like drugs or metabolite in biological matrices like urine or plasma. It consists of two main parts: sample pretreatment and detection of the compound 2.
Cetirizine has hydrogen binding capacity and brain to blood transfer (efflux) are high causing lesser brain uptake. It has highly bounding capacity with plasma protein, mainly plasma albumin (mean=93%) and it has low apparent
tissues such as myocardium thus less tendency to cause cardiotoxicity. The average peak plasma concentration (Cmax) is of 319 ng/mL for a single 10 mg dose 3.
The volume of distribution of cetirizine is low, meaning that its tissue distribution is quite restricted. Sample from biological matrices will give interferences to the response from analyte. These substances will precipitate in the interpaticulate voids of stationary phase causing degradation and clogging. Sample pretreatment must be applied such as protein precipitation or extraction type 4.
2.
MATERIALS AND METHODS
2.1 InstrumentationAn Agilent 1100 HPLC system was used, with an autosampler. Detection was done using VWD (variable wavelength detector) at 237 nm. Separation was done by Phenomenex C18 column.
2.2 Chromatographic condition
This chromatography system uses reversed phase system with C18 as stationery phase and 35:65, v/v of Acetonitrile to 0.3% triethylamine (TEA) buffer at pH 3 as the mobile phase 5. The column temperature was set at 30 °C. It is an isocratic separation with an analysis time of 10 minutes. Internal standard used is amlodipine.
2.3 Stock solution
Cetirizine reference standard (Sigma) of 10 mg dissolved in methanol. Then mobile phase was added to top up till 10 mL in volumetric flask. The stock solution concentration was 1 mg/mL or 1000 µg/mL. The same preparation steps were done to amlodipine (internal standard, IS) 6. IS stock solution being also 1000 µg/mL. Stock solutions were kept in fridge at 4 °C. Mobile phase was used to dilute the stock solution to make working standards.
2.4 Mobile phase
Mobile phase used for this method was 35:65, v/v of Acetonitrile to 0.3% triethylamine (TEA) buffer at pH 3. To prepare buffer, 1.5 mL of HPLC grade TEA diluted using Ultra-Pure (UP) water to make 500 mL solution 1, 3. Then, pH is fixed using phosphoric acid to reach pH 3.00. Mobile phase was filtered and degassed before being used for analysis. Fresh mobile phase was prepared daily.
2.5 Working standards
Stock solution diluted to become 100 µg/mL. Working standards constructed using 100µg/mL diluted stock to make: 0.6, 1.0, 2.0, 3.0, 4.0, 6.0 and 10.0 µg/mL of cetirizine working standards 8. Quality control standards consisted of 0.25, 1.5 and 2.5 µg/mL were prepared too. For IS, working standard of 6 µg/mL and QC standard of 0.75 µg/mL were prepared 9.
2.6 Sample preparation
1mL plasma with 50 µL working standard and 25 µL IS working standard was vortexed for 1 min. Then 6mL of dichloromethane (DCM) was added. This mixture was vortexed again for 2 minutes. Then, centrifuged at 4000 rpm for 10 minutes. The below layer was transferred to 10 mL glass tube. The collected fluid then evaporated under Nitrogen gas at 40 °C until dry. The residue was then reconstituted with 200 µL mobile phase. It was then vortexed for 30 seconds. Then, transferred to glass insert. After that, it was centrifuged again at 10000 rpm for 10 minutes. The supernatant was injected for analysis 6-8. 2.7 Calibration standard
Calibration standard was made by spiking 1mL plasma with 50 µL working standard and 25 µL IS working standard.In each of 1 mL of the blank plasma, 50 µL of 0.6, 1, 2, 3, 4, 6 and 10 µg/mL working standards are spiked into it 10.
Table 1: the concentration of working standards to be spiked into blank human plasma
Working standard
concentration, µg/mL Internal standard concentration, µg/mL
0.6 6
1 6
2 6
3 6
4 6
6 6
10 6
2.8 Quality control sample
For quality control sample, 1, 6 and 10 µg/mL working standard was spiked into 1mL of plasma, which after final reconstitution the concentration would be 0.25, 1.5 and 2.5 µg/mL. Same concentrations of standard were made to match the concentration of the QC samples. IS QC standard was prepared too.
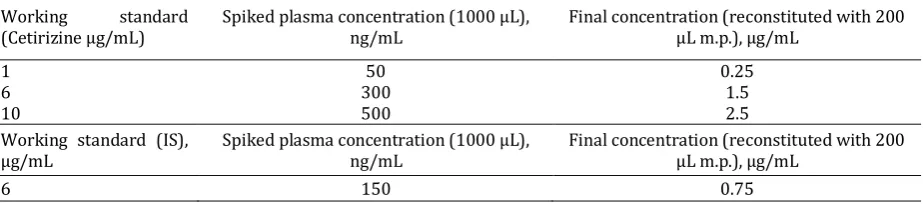
Table 2: the QC samples were showing the spiked plasma concentration and final concentration with low, medium and high.
Working standard
(Cetirizine µg/mL) Spiked plasma concentration (1000 µL), ng/mL Final concentration (reconstituted with 200 µL m.p.), µg/mL
1 50 0.25
6 300 1.5
10 500 2.5
Working standard (IS),
µg/mL Spiked plasma concentration (1000 µL), ng/mL Final concentration (reconstituted with 200 µL m.p.), µg/mL
3.
RESULTS AND DISCUSSION
3.1 Calibration curveA calibration curve of plasma was prepared using the method stated above. Seven different concentrations of working standards was spiked into plasma, extracted using dichloromethane, dried and reconstituted again.
Table 3: the working standards used to spike into blank plasma to make a calibration standard.
Working standard (Cetirizine), µg/mL
Plasma concentration, ng/mL
Cetirizine IS (Amlodipine)
0.6 30 150
1.0 50 150
2.0 100 150
3.0 150 150
4.0 200 150
6.0 300 150
10.0 500 150
IS peak came out earlier around 5.4 minutes while cetirizine peak appeared around retention time of 7.4 minutes. The calibration curve was constructed by peak area ratio against concentration.
Table 4: showing the nominal plasma concentration against peak area ratio.
Plasma concentration, ng/mL Peak area ratio (area of cetirizine/area of IS)
30 0.425
50 0.487
100 0.732
150 0.797
200 0.87
300 1.23
500 1.774
Figure 1: showing the calibration curve (peak area ratio vs. nominal concentration).
3.2 Linearity
The calibration curve was constructed with y axis represents the peak area ratio between cetirizine and IS, and x axis as the concentration. The curve equation is y = 0.0028x + 0.3666 with coefficient of determination, R2 = 0.9908.
3.3 Selectivity
The selectivity of this analysis is represented by analysing blank plasma and compare it with plasma spiked with drug.
The chromatogram of the blank plasma was free from any interference peaks at the cetirizine and IS retention times.
Figure 3: showing the chromatogram (a) blank plasma and (b) plasma spiked with Cetirizine and IS y = 0.0028x + 0.3666
R² = 0.9908
0 0.2 0.4 0.6 0.8 1 1.2 1.4 1.6 1.8 2
0 100 200 300 400 500 600
P
e
ak
a
re
a
ra
ti
o
Plasma concentration (ng/mL)
IS
Cetirizine
(a
)
3.3 Recovery
Recovery is calculated using this formula:
( ) ( )
( )
Mostly, the recovery of cetirizine in the plasma is more than 90% as stated below:
Table 5: showing the day recovery of analytes (cetirizine and amlodipine)
QCL QCM QCH QC(IS)
Concentration 250 ng/mL 1500 ng/mL 2500 ng/mL 750 ng/mL
Peak area Plasma Aqueous 4.08 3.74 27.33 33.8 39.95 37.6 25.27 27.84
Recovery (%) 109.1 124 94 91
3.4 Precision
Precision was calculated using the formula:
√∑ (
(∑ ) ) s = standard deviation
N = number of sample x = measured concentration
Precision in percentage is a coefficient variation (CV) obtained from standard deviation and mean, which is calculated using the formula:
For intra-day precision, 3 sets of QC samples (low, medium and high) were analysed results shown in table below. Table 6: showing the intra-day precision and accuracy of the analytes.
Samples number of Concentration, ng/mL Precision (%) CV (n=3)
Nominal Measured
2 50 32.46 19
3 300 332.17 11.3
3 500 396.45 12.4
For inter-day precision, 3 sets of QC samples (low, medium and high) were analysed results shown in table below. Table 7: showing the inter day precision of the analytes.
Samples number Concentration, ng/mL Precision (%)
Nominal Measured
5 50 69.07 18.3
4 300 382.73 10.5
4 500 423 11.6
According to Bioanalytical Method validation guideline by the Centre for Drug Evaluation and Research (CDER), the accuracy and CV for QC samples should be within 15%. In our study it was observed QC medium and high concentrations were within the limit, but the low concentration was above 15%. So according to the guideline, the low concentration doesn’t comply with the requirement.
4.
CONCLUSION
The reported method has excellent recovery, selectivity and linearity (30-500 ng/ml) of the analyte from human plasma using dichloromethane as a solvent. It is also showed
satisfactory precession for medium and high concentration. The low concentration was the higher than the permissible limit by CDER.
ACKNOWLEDGEMENT
This study was supported by the Research Management Centre, International Islamic University Malaysia [RIGS 150900090] and RIGS-162920456]; and Ministry of Education Malaysia [RACE1400140020].
CONFLICT OF INTEREST
REFERENCES
1. Ma, M., Feng, F., Sheng, Y., Cui, S., & Liu, H. Development and
evaluation of an efficient HPLC/MS/MS method for the simultaneous determination of pseudoephedrine and cetirizine in human plasma: Application to Phase-I pharmacokinetic study. . J Chromatogr B Analyt Technol Biomed Life Sci, 2007; 846(1–2):105–111.
http://doi.org/10.1016/j.jchromb.2006.08.026
2. De Jager, a. D., Hundt, H. K. L., Swart, K. J., Hundt, A. F., & Els, J. Extractionless and sensitive method for high-throughput quantitation of cetirizine in human plasma samples by liquid chromatography–tandem mass spectrometry. J Chromatogr B,
2002; 773(2):113–118.
http://doi.org/10.1016/S1570-0232(02)00134-4
3. Kim, C.-K., Yeon, K. J., Ban, E., Hyun, M.-J., Kim, J.-K., Kim, M.-K.,
Park, J.-S. Narrow-bore high performance liquid
chromatographic method for the determination of cetirizine in human plasma using column switching. J Pharm Biomed Ana,
2005; 37(3):603–9. http://doi.org/10.1016/j.jpba.2004.11.022
4. Dharuman, J., Vasudhevan, M., & Ajithlal, T. High performance
liquid chromatographic method for the determination of cetirizine and ambroxol in human plasma and urine-A boxcar approach. J Chromatogr B Analyt Technol Biomed Life Sci, 2011; 879(25):2624–2631.
http://doi.org/10.1016/j.jchromb.2011.07.024
5. Wichitnithad, W., Jithavech, P., Sanphanya, K.,
Vicheantawatchai, P., & Rojsitthisak, P. Determination of
Levocetirizine in Human Plasma by LC–MS-MS: Validation and Application in a Pharmacokinetic Study. J Chromatogr Sci, 2015; 53(10):1663-1672.
https://doi.org/10.1093/chromsci/bmv069
6. Eriksen, H., Houghton, R., Green, R., & Scarth, J. Determination
of cetirizine in human plasma by liquid chromatography-tandem mass spectrometry. Chromatographia, 2002; (8):145–
149. http://doi.org/10.1007/BF02493371.
7. Macek, J., Ptácek, P., & Klíma, J. Determination of cetirizine in
human plasma by high-performance liquid chromatography. J Chromatogr B Biomed Sci Appl, 1999; 736(1–2):231–5.
https://doi.org/10.1016/S0378-4347(99)00464-8
8. Zaater, M. F., Tahboub, Y. R., & Najib, N. M. RP-LC method for
the determination of cetirizine in plasma. J Pharm Biomed Anal,
2000; 22(5):739–744.
http://doi.org/10.1016/S0731-7085(99)00294-0.
9. Esteve-Romero, J., Albiol-Chiva, J., & Peris-Vicente, J. A review
on development of analytical methods to determine monitorable drugs in plasma and urine by micellar liquid chromatography using direct injection. Anal. Chim. Acta, 2016;
926:1–16. http://doi.org/10.1016/j.aca.2016.04.026.
10. Pandey, S., Pandey, P., Tiwari, G., & Tiwari, R. Bioanalysis in
drug discovery and development. Pharma Meth, 2010; 1(1):14–