IJSRSET1624146 | Received : 09August2016 | Accepted :13August 2016 | July-August 2016 [(2)4: 650-656]
© 2016 IJSRSET | Volume 2 | Issue 4 | Print ISSN: 2395-1990 | Online ISSN : 2394-4099 Themed Section: Engineering and Technology
650
Modeling and Simulation of Incremental Conductance Maximum
Power Point Tracking (MPPT) Algorithm for Solar PV Array
Using Boost Converter
G.Joga Rao
1,
Dr. D.K.Mangal
2,
Dr.S.K. Shrivastava
3, Md.Gouse Baig
41,2,3 EEE Department, S.R University, Alwar, Rajasthan, India
3
EEE Department, CECG, Andhra Pradesh, India
ABSTRACT
The increasing demand for electricity and depleting fossil fuels made the solar Photovoltaic (PV) systems to be a better alternative for the future power requirements. Nowadays solar energy has great importance. Because it is easily available resource for energy generation.The fact that the output of the PV system is dependent upon the solar irradiance and temperature. In order to get maximum power from the solar panels the Maximum Power Point Tracking (MPPT) controllers can play an important role in photovoltaic systems, they have to operate at their maximum power point (MPP) despite the changes in the environment conditions. Maximum Power Point Tracking (MPPT) which significantly increases the efficiency of the solar photovoltaic System.There are differentMPPT control methods used for solar PV systems, Incremental conductance(IC), Perturb and observe(P&O), Constant Current method, Constant Voltage method, Fuzzy Control, and Neural Network Control. This paper presents the modeling and simulation of incremental conductance MPPT algorithm for pv array using boost converter. The simulation has been accomplished using MATLAB/SIMULINK.
Keywords - Photovoltaic (PV) System, Maximum Power Point Tracking (MPPT), Maximum Power Point(MPP), Incremental Conductance method(IC), Boost Converter.
I.
INTRODUCTION
Solar Photovoltaic (SPV) system converts sunlight into electricity with no pollution, no maintenance and no depletion of natural resources; domination of world's energy production seems to be shifting towards the alternate energy sources like solar, wind etc. As sun is the prime source of energy, the ultimate solution of energy problem rests specially with the proper utilization of the solar energy.The fact that the output of the solar PV system is dependent upon the solar irradiance and temperature. In order to get maximum power from the solar panels the Maximum Power Point Tracking (MPPT) controllers can play an important role in photovoltaic systems; they have to operate at their maximum power point (MPP) despite the changes in the environment conditions. Maximum Power Point Tracking (MPPT), which significantly
reason, this paper presents the details of Incremental Conductance MPPT using boost converter. The simulation model of the PV based system with MPPT algorithm will be implemented in the Matlab/Simulink.
II.
METHODS AND MATERIAL
1. Modelling of PV Cell
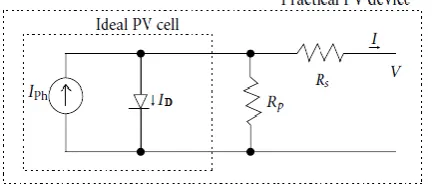
The model of the solar PV cell can be realized by an equivalent circuit that consists of a current source in parallel with a diode as shown in fig. 1 for ideal modelRs,Rpand C components can be neglected
Figure 1.Equivalent circuit diagram of a solar pv cell
The diode is the one which determines the current-voltage characteristic of the cell. The output of the current source is directly proportional to the light falling on the cell. The open circuit voltage increases logarithmically according to the Shockley equation which describes the interdependent of current and voltage in a solar cell. An equation that represents I -V characteristics of a solar array is given by the following mathematical equation as
(
) ----(1)
Equation (1) is used in computer simulations to obtain the output characteristics of a solar cell. To simulate the selected PV array, a PV mathematical model having cells in parallel and cells in series is used according to the following equation (neglecting shunt resistance):
(
)---(2)
Assuming the above equation can be rewritten as:
(
)---(3)
In particular, the cell reverse saturation current, Is, varies with temperature according to the following equation as:
( )
( --- (4)
---(5)
The photo current , depends on the solar radiation (S)
and the temperature (T) according to the following equation as:
---(6)
/ ---(7)
Where ---(8)
The series resistance of the cell is given as
( )--- (9)
Where = *
---(10)
The PV power, P, is then calculated as follows
(
) ---(11)
Where
V -output voltage of PV module, I - output current of PV module, Rs - series resistance of cell (Ω)
Rsh - shunt resistance of cell (Ω)
q - electronic charge (1.602 *10-19 C), Isc- light-generated current,
K - Boltzman constant (1.38 * 10-23 J/k),
Tk - temperature (K), ns number of PV cells connected
in series,
Np -number of PV cells connected in parallel,
Io- reverse saturation current which depends on the
ambient temperature
m- diode factor (usually between 1 and 2); ns: number of PV cell in series
np: number of PV cell in parallel
The specifications of the selected PV array shown in Table 1
Table 1: Specifications of the PV panel
At temperature=250C
Open circuit voltage V0 21.0 V
Short circuit current Isc 5.45 A
Voltage at max power Vm 17.2 V
Current at max power Im 4.55 A
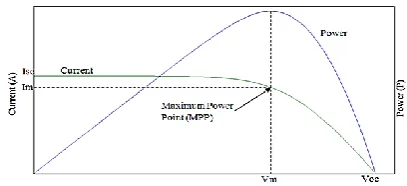
The PV module can be operated in any point on the I-V curve between the Isc and the Voc. However, the
power from the PV module is different in every operating point as shown in theP-V curve in fig. 1
Figure 2. PV array I –V and P–V characteristics
Therefore, a control algorithm is needed in order to ensure that the PV system always operates at the MPP. Fig. 1 is obtained when the temperature and solar irradiation are constant at the standard testing conditions (STC) which are defined as cell temperature = 250 C, incident solar irradiance = 1000W/M2, and air mass (AM) = 1.5.
2. PV System with MPPT Control
Maximum power point tracking, frequently referred to as MPPT, Tracking the maximum power point (MPP) of a photovoltaic array is an essential stage of a PV system The efficiency solar panel is improved by Maximum Power Point Tracking (MPPT) when they set to operate at point of maximum power. The operation of MPPT can only be achieved when a tune able matching network is used as interface for load and the PV array. The main constituent components of a PV system are power stage and controller as shown in fig.3. The power stage is optimized using switch mode DC-DC converters (boost, buck-boost), employing pulse width control. The control parameter which is used for synchronizing the network for maximum extraction of power is duty ratio δ. The block diagram of PV system with MPPT control using boost power converter is shown in fig. 3
Figure 3.Block Diagram of PV System with MPPT Control
There are different MPPT techniques such Incremental conductance(IC), Perturb and observe(P&O), Constant Current method, Constant Voltage method, Fuzzy Control, and Neural Network Control. The large number of methods proposed can make it difficult to determine the best technique to adopt when implementing a PV system. Among allthose methods the Incremental conductance(IC) is commonly used because of their simplicity. They differ in many aspects such as complexity, accuracy, sensors required, cost or efficiency, and speed. Based on the control variable it uses, each method can be categorized.
3. MPPT by Incremental Conductance Method
The incremental conductance (IC) algorithm, whichis shown in fig. 5, seeks to overcome the limitations of the perturbation and observation algorithm by using the incremental conductance of the photovoltaic. Incremental conductance method generally uses voltage and current sensors to detect the output voltage and current of the PV array hence the complexity of the algorithm increases. The slope of the PV curve is zero at Maximum Power Point. Incremental conductance method uses two sensors, that is voltage and current sensors to sense the output voltage and current of the PV array. Algorithm works by comparing the ratio of derivative of conductance with the instantaneous conductance.
power efficiency and reliability of tracking MPP. Since the P&O method will move away from the power operating point under rapidly changing light condition and not be able to go back the maximum operating point quickly, this will lead to the inefficient use of the PV array and hence this affects the whole system performance of tracking MPP.
Other advantage of using this method is it does not depends on the device physics. The output voltage and current from the source are monitored upon which the MPPT controller relies to calculate the conductance and incremental conductance, and to make its decision to increase or decrease duty ratio output. Mathematics of the Incremental Conductance method is discussed below. The output power from the source can be expressed as
--- (12) The fact that and the chain rule for the derivative of product yields
( ) (
) = +
---(13)
Let us define the source conductance as =
---(14)
And the source incremental conductance as
---(15)
It is observe that the operating voltage below at the maximum power point if the conductance is larger than the incremental conductance and vice versa. The voltage operating point at which the conductance is equal to the incremental conductance. These equations 16, 17, 18 and are graphically shown in fig. 4.
< 0, if < Δ ----(16)
= 0, if = Δ ----(17)
> 0, if > Δ ---(18)
Figure 4. The P-V curve
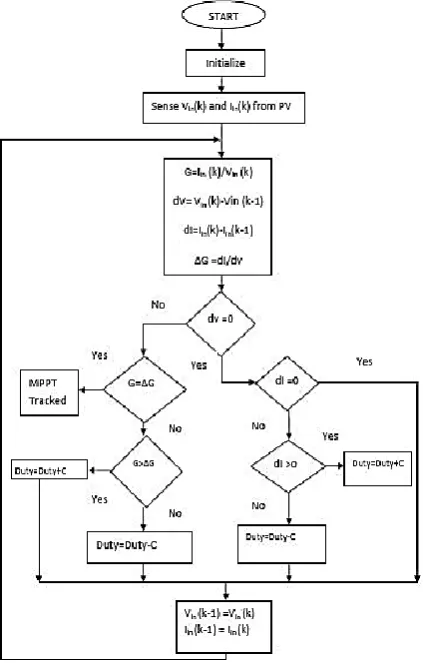
The program flow chart for this algorithm is shown in fig. 6 the operating output current (Iin (k)) and voltage
(Vin (k)) are measured from the solar panel. The
incremental changes dV and dI are approximated by comparing the most recent measure values for (Iin (k))
and (Vin (k)) with those measured in the previous cycle (Iin (k-1)) and (Vin (k-1)). Then and Δ are
computed as per the equations (14) and (15). From
equation (17), if = 0 (i.e. = Δ ) is true, then the
system operates at the MPP and no change in operating voltage is necessary, thus the adjustment step is bypassed i.e. no adjustment for the duty ratio and the current cycle ends. If equation (17) is false, equation (16) and (18) are used to determine whether the system is operating at a voltage greater or less than the MPP voltage and hence to increase or decrease the duty ratio by a step-size of some value accordingly. If the system is operating at the MPP during the previous cycle, the incremental change of the operating voltage is zero ( = 0). This would lead a division by zero i.e. Δ = ÷ = ÷ 0, which is impossible for calculation. To avoid this, the condition ( = 0) is checked first and if true leads to another branch in the algorithm with further tests on possible changes of the panel’s operating conditions. Since the voltage = 0, that means the voltage has not changed; now the only useful information about possible changes are found from the current measurement. If
is equal to zero, the operating conditions have not changed and therefore the adjustment of the system voltage is bypassed. If > 0, the duty ratio is increased by step size and is < 0, the duty ratio is decreased by step size. The program then returns and starts tracking again until the MPP is reached. The maximum duty cycle ratio is set at 90% and the minimum is at 10% and hence contributes to the efficient power transfer of the converter.
Figure5.Flowchart of the IC method.
4. Boost Converter
The boost converter is nothing but a DC/DC converter,which has boosting the voltage to maintain the maximum output power constant for all the conditions of temperature and solar irradiance variations. The MPPT uses the converter to regulating the input voltage at the PV MPP and providing load-matching for the maximum power transfer. The regulation is normally achieved by PWM at a fixed frequency and the switching device is generally BJT, MOSFET or IGBT. There are several different types of dc-dc converters, buck, boost, buck-boosttopologies, have been developed and reported in the literature to meet variety of application specific demands .The topology used for DC to DC converter is boost converter. The boost converter is shown in fig. 6when the switch S is on, the current builds up in the inductor L due to the positive inductor voltage is equal to the input voltage. When S is off, the voltage across L reverses and adds to the input voltage, thus makes the output voltage greater than the input voltage. For steady state operation, the average voltage across the inductor over a full period is zero. By designing this circuit we can also investigate performance of
converters which have input from solar energy. The boost converters will present low ripple on the PV module side, so here in this experimental work, boost converter is used to verify the output power results.
Figure6.circuit diagram of boost converter
III. RESULTS AND DISCUSSION
SIMULATION AND RESULTS
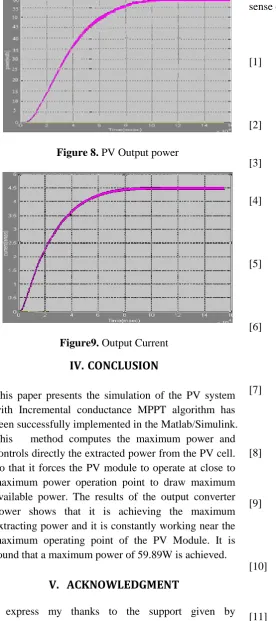
The flowchart of the incremental conductance MPPT algorithm has been implemented in Matlab/Simulink as shown in fig. 7, which includes the PV module, the boost converter, and the MPPT algorithm. The converter circuit topology is designed to be compatible with a given load to achieve maximum power transfer from the solar arrays. The power will be maximum for along the variations of temperature and solar irradiance in the PV array which is giving to input to DC-DC converter. We consider photovoltaic cell with Irradiance is 1000w/m2 and temperature is 250c.The simulation results of the output power of the PV module and output current waveforms are shown in fig. 8 and 9.
The maximum power point tracking of the module for the Incremental conductance method is carried out using Matlab/Simulink and the maximum power tracked for the considered 60W module is 59.89W.
Figure 8. PV Output power
Figure9. Output Current
IV. CONCLUSION
This paper presents the simulation of the PV system with Incremental conductance MPPT algorithm has been successfully implemented in the Matlab/Simulink. This method computes the maximum power and controls directly the extracted power from the PV cell. So that it forces the PV module to operate at close to maximum power operation point to draw maximum available power. The results of the output converter power shows that it is achieving the maximum extracting power and it is constantly working near the maximum operating point of the PV Module. It is found that a maximum power of 59.89W is achieved.
V.
ACKNOWLEDGMENT
I express my thanks to the support given by management in completing my project. I also express my sincere gratitude& deep sense of respect toDr.S.K
Shrivastava, professor of the Electrical Department. I am thankful to the Research Head, teaching and non-teaching staff of Electrical department for their direct as well as indirect help in my project. I am elated to avail my selves to this opportunity to express my deep sense of gratitude to my parents.
VI. REFERENCES
[1] K. H. Hussein, Muta, Hoshino and Osakada "Maximum Photovoltaic Power Tracking: An Algorithm For Rapidly Changing Atmospheric Conditions". IEEE Proc.-Gener. TransaDistrib., Vol. 142, No. I, January 1995
[2] P. A Lynn, electricity from sunlight: An Introduction to photovoltaics, John Wiley & sons, 2010,p.238.
[3] Z. Salameh and D. Taylor, "Step-up maximum power point tracker for photovoltaic arrays," Solar Energy, vol. 44, pp. 57–61, 1990.
[4] Esram, T. and Chapman, P.L. (2007) Comparison of Photovoltaic Array Maximum Power Point Tracking Techniques. IEEE Transactions on Energy Conversion, 22, 439-449
[5] P. Hohm, M. E. Ropp "Comparative Study Of Maximum Power Point Tracking Algorithms Using an Experimental, Programmable, Maximum Power Point Tracking Test Bed" 0-7803-5772-8/00/ 2000 IEEE.
[6] D., Kerekes, T., Teodorescu, R. and Blaabjerg, F. (2006) Improved MPPT Method for Rapidly Changing Environmental Conditions. 2006 IEEE International Symposium on Industrial Electronics, 2, 1420-1425.
[7] G. J. Yu, Y. S. Jung, J. Y. Choi, and G. S. Kim, "A novel two-mode MPPT control algorithm based on comparative study of existing algorithms," Solar Energy, vol. 76, pp. 455–463, 2004.
[8] Trends in photovoltaic applications.Survey report of selected IEA countries between 1992 and 2009, International Energy Agency, Report IEA-PVPS Task 1, 2010.
[9] Liang-Rui Chen, Chih-Hui Tsai, Yuan-Li Lin, And Yen-Shin Lai, "A Biological Swarm Chasing Algorithm For Tracking the Pv Maximum Power Point.", IEEE Transactions On Energy Conversion, Vol. 25, No. 2, June 2010. [10] L.Piegari ,R.Rizzo " Adaptive perturb and
observe algorithm for photovoltaic maximum power point tracking",Renewable power generation, IET, Vol.4, pp. 317-328, July 2010. [11] Elgendy, M.A., Zahawi, B. and Atkinson, D.J.
for PV Pumping Applications. IEEE Transactions on Sustainable Energy, 3, 21-33. [12] Femia, N., Petrone, G., Spagnuolo, G. and
Vitelli, M. (2005) Optimization of Perturb and Observe Maximum Power Point Tracking Method. IEEE Transactions on Power Electronics, 20, 963-973.
[13] Salas V, Olias E. "Overview of the photovoltaic technology status and perspective in Spain" Renewable and Sustainable Energy Reviews 2009;13: 1049–57.
[14] MaharajanSagarBhaskarRanjana,
NandyalaSreeramula Reddy and RepalleKuralaPavan Kumar (2014) "A novel sepicbased dual output DC - DC converter for solar application", Proc. of International Conference on Power and Energy Systems towards Sustainable Energy, pp.1-5.
[15] koutroulis and FredeBlaabjerg (2015) "Overview of Maximum Power Point Tracking Techniquesfor Photovoltaic energy production systems", Electric Power Components and Systems, 43(12), pp.1329-1351.
[16] BurriAnkaiah&JalakanuruNageswararao,‟ MPPT Algorithm for Solar Photovotaic Cell by Incremental Conductance Method‟ International Journal of Innovations in Engineering and Technology (IJIET)
[17] faranda, Sonia Leva," Energy comparison of MPPT techniques for PV Systems", Department of Energy Politecnico di Milano Piazza Leonardo da Vinci, 32 – 20133 Milano ITALY [18] Johan H. R. Enslin, Senior Member, IEEE,