Fish stocking programs:
assessing the benefits against
potential long-term genetic
and ecological impacts
D.J. Russell
1, D.R. Jerry
2, P.A. Thuesen
1, F.E. Thomson
1, T.N.
Power
2and C.S.K. Smith-Keune
2Agri-Science Queensland
Department of Agriculture, Fisheries and Forestry, Queensland
1
Northern Fisheries Centre, PO Box 5396, Cairns, Queensland 4870 2
School of Marine and Tropical Biology and Centre for Sustainable Tropical Fisheries and Aquaculture,James Cook University, Townsville, Queensland 4810
Assessing genetic and ecological effects of fish stocking
ii
ISBN 9 780734 504333
First published 2013
© The State of Queensland, Department of Agriculture, Fisheries and Forestry and the Fisheries Research and Development Corporation, 2013
This work is copyright. Except as permitted under the Copyright Act 1968 (Commonwealth), no part of this publication may be reproduced by any process, electronic or otherwise, without the specific written permission of the copyright owners. Neither may information be stored electronically in any form whatsoever without such permission.
Inquiries should be directed to:
Department of Agriculture, Fisheries and Forestry
Northern Fisheries Centre
PO Box 5396
Cairns Qld 4870
Disclaimer
The authors do not warrant that the information in this document is free from errors or omissions. The authors do not accept any form of liability, be it contractual, tortious, or otherwise, for the contents of this document or for any consequences arising from its use or any reliance placed upon it. The information, opinions and advice contained in this document may not relate, or be relevant, to a reader’s particular circumstances. Opinions expressed by the authors are the individual opinions expressed by those persons and are not necessarily those of the publisher, research provider, DAFF Queensland or the FRDC.
The Fisheries Research and Development Corporation plans, invests in and manages fisheries research and development throughout Australia. It is a statutory authority within the portfolio of the federal Minister for Agriculture, Fisheries and Forestry, jointly funded by the
Assessing genetic and ecological effects of fish stocking
iii
Table of contents
Table of contents ... iii
List of figures ... vi
List of tables ... vii
Non technical summary ... 1
Outcomes achieved ... 1
Acknowledgements ... 3
Background ... 4
Fish stocking in Australia ... 4
Benefits of stocking ... 4
Issues with stocking ... 5
Biological impacts of stocking ... 5
Ecological impacts of stocking ... 6
Disease... 7
Genetic impacts of fish stocking ... 7
Responsible fish stocking ... 8
Consultation ... 9
Need ... 9
Objectives ... 9
General methods ... 10
Study locations ... 10
Stocking ... 10
Release sites ... 14
Tagging program ... 14
Johnstone River ... 16
Lake Tinaroo ... 16
Field sampling... 16
Fish sampling techniques ... 16
Water quality... 17
Growth and condition ... 17
Diet ... 17
Genetic tissue sampling ... 17
Broodstock and pre–release fingerlings... 17
Pre–stocking genetic profile ... 18
Genetics field sampling ... 18
Analyses ... 18
Diet ... 18
Growth and condition ... 19
Movements and relative abundance ... 19
Movements ... 20
Introduction ... 20
Methods ... 21
Results ... 22
Movements ... 22
Comparative CPUE ... 30
Discussion ... 31
Assessing genetic and ecological effects of fish stocking
iv
Introduction ... 34
Methods ... 35
Results ... 35
Dietary composition ... 35
Cannibalism and interaction with rare species ... 35
Variation in diet between sampling zones ... 36
Condition factor ... 38
Growth ... 38
Discussion ... 39
Genetics ... 43
Introduction ... 43
Methods ... 45
Genomic DNA extraction: Johnstone River samples (wild and CWT recaptures) ... 46
Genomic DNA extraction: broodstock and pre–release project fingerlings ... 46
Genomic DNA extraction: otoliths... 46
PCR amplification and scoring of microsatellite marker ... 47
Genotyping error checking ... 47
Parentage analysis: pre–release project fingerlings ... 48
Parentage analysis: post–release fingerlings recovered as CWT fish ... 48
Pre– vs post–stocking genetic diversity ... 49
Identification of putative progeny resulting from stocked/wild matings ... 49
Results ... 50
Summary parentage assignment of project stocked barramundi fingerlings: Hatchery 1 ... 50
Summary parentage assignment of project fish: Hatchery 2 ... 51
Pre–stocking versus contemporary genetic diversity in the Johnstone River ... 53
Detection of introgressed F1 individuals between hatchery stocked fish and wild barramundi ... 55
Discussion ... 56
Benefits ... 63
Benefits and beneficiaries ... 63
Further development ... 64
Planned outcomes ... 64
Conclusions... 66
References ... 68
Appendix 1... 86
Intellectual property ... 86
Appendix 2... 87
Project staff ... 87
Appendix 3... 88
Movements of stocked barramundi (Lates calcarifer) in Australia: a desktop study ... 88
Introduction ... 88
Assessing genetic and ecological effects of fish stocking
v
Results and discussion ... 90
Recaptures of stocked fish from the Suntag database ... 90
Movement trends ... 90
Movements by region ... 94
Growth of stocked fish ... 100
Conclusions ... 102
Acknowledgements ... 103
Assessing genetic and ecological effects of fish stocking
vi
List of figures
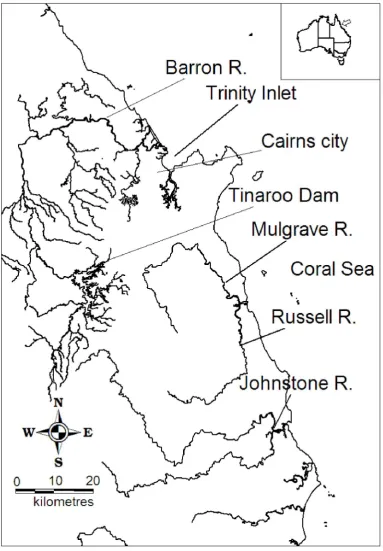
Figure 1. Study areas in north Queensland 12
Figure 2 Tinaroo Falls Dam (a) and Johnstone River (b) study areas. Crosshatched areas
are the Wet Tropics World Heritage area. 13
Figure 3. Stocking and sampling locations in Lake Tinaroo (top) and the north and south
Johnstone Rivers (bottom). 15
Figure 4. Sites (pink dots) in Lake Tinaroo where no stocked 2009 barramundi were
caught. 24
Figure 5. CPUE of stocked 2009 age class barramundi in Lake Tinaroo. The size of
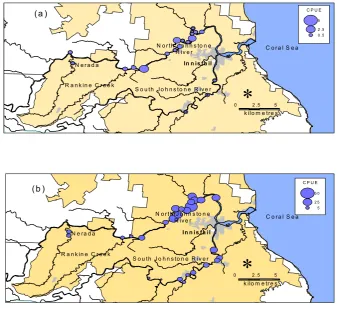
mauve markers indicated the relative CPUE at individual sites. 26 Figure 6. CPUE (mauve markers) for (a) stocked and (b) wild 2009-2010 age class
barramundi. 28
Figure 7. CPUE of (a) stocked and (b) wild Barramundi from all age classes except
2009-2010 in the Johnstone River 29
Figure 8. Box and whisker plot for CPUE for wild and stocked barramundi from Lake
Tinaroo and the Johnstone River. 31
Figure 9. Detrended Correspondence Analysis of broad dietary groups of barramundi and
sampling zones. 37
Figure 10. Condition factors of stocked and wild fish at the study locations. 38 Figure 11. Mean monthly size (TL) barramundi of the same age cohort of stocked and /or
wild barramundi from the Johnstone River and Tinaroo Falls Dam. 39 Figure 12. Half-sib family contributions as per cent of individuals assigned to Hatchery 1
broodstock with strict (> 95%) confidence and zero mismatches using 16
microsatellite loci. 51
Figure 13. Family contributions as per cent of individuals assigned to Hatchery 2 broodstock with strict (> 95%) confidence and zero mismatches using 16
microsatellite loci. 52
Figure 14. Structure program screenshot of the proportion of genome ancestry to either a simulated DPI&F progeny or wild Johnstone River genetic cluster (k=2)
under an independent loci with prior population data, admixture model. 54 Figure 15. Mean (± S.D) proportion of genome coancestry (q-value) of simulated and
contemporary barramundi to either a DPI&F hatchery progeny genetic cluster (Cluster 1), or wild Johnstone River progeny genetic cluster (Cluster 2). 55 Figure 16. Frequency of recaptured stocked barramundi movements by region in
Queensland. 90
Figure 17. Types of movement by stocked barramundi in Queensland. 91 Figure 18. Frequency of stocked barramundi movements within Queensland. Fish
moving < 5 km are not included. 91
Figure 19. Mean distance (± S.E.) travelled by stocked barramundi in eastern Queensland that moved downstream from point of stocking or tagging. 92 Figure 20. Mean distance (± S.E.) of stocked barramundi in north Queensland that
travelled upstream from point of stocking or tagging. 93 Figure 21. Wet tropics watercourses. Red arrows show examples of fish movements. 94 Figure 22. Sites in the Townsville area. Red bars show weirs and impoundments and red
arrows show selected fish movements. 96
Figure 23. Movement trends of tagged barramundi stocked into Lake Dalrymple on the
Burdekin River. 97
Figure 24. Movement trends of tagged barramundi stocked into the Fitzroy River system. 98 Figure 25. Movement trends of barramundi stocked into Lake Callemondah and the
Assessing genetic and ecological effects of fish stocking
vii
Figure 26. Relationship between time at liberty and length of stocked barramundi by
region. 101
Figure 27. Mean growth (± S.E.) of stocked barramundi in north Queensland. Samples
sizes (n) are above each data point 102
List of tables
Table 1. Numbers of barramundi stocked by site. 14
Table 2. Number of recaptures of stocked and wild barramundi that have made large intra-riverine movements since the commencement of monitoring in the early
1990s. 23
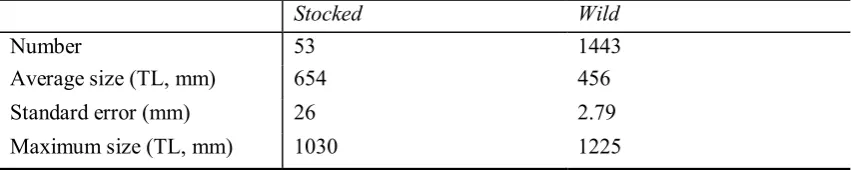
Table 3. Length and maximum size of all age classes, except 2009-2010, of stocked and
wild L. calcarifer in the Johnstone River. 30
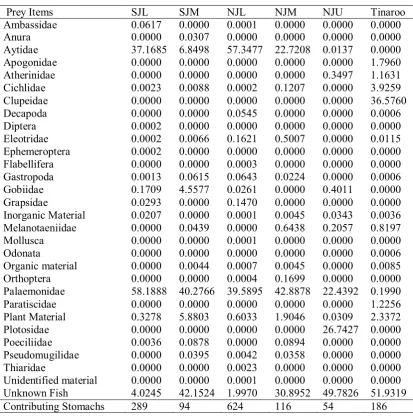
Table 4. Index of Preponderance (Ip) showing importance of different prey items in the diet of L. calcarifer from each of the stocking locations. 36 Table 5. Allelic diversity, expected heterozygosity (He) and Garza–Williamson Index of
pre–stocked and contemporary Johnstone River barramundi genotyped at 15
microsatellite loci. 53
Table 6. Analysis of molecular variance (weighted average over all loci) for pre–stocked and contemporary barramundi from the Johnstone River. 55 Table 7. Mean total lengths (± S.E.) at release and recapture, growth and period at liberty
Assessing genetic and ecological effects of fish stocking
1
Non technical summary
2009/040 Fish stocking programs: assessing the benefits against potential long-term genetic and ecological impacts
PRINCIPAL INVESTIGATOR: D. J. Russell
ADDRESS: Northern Fisheries Centre
Department of Agriculture, Forestry and Fisheries, Queensland
PO Box 5396
Cairns Queensland 4870
Telephone: 07 4057 3717
Fax: 07 4057 3811
OBJECTIVES:
1. Assess movements and ecological impacts of stocked barramundi in a model river and impoundment
2. Determine if barramundi stocking has any discernable adverse genetic impacts on wild populations in a previously stocked river system
Outcomes achieved
The principal outcome of this project was to provide fisheries managers and other relevant stakeholders with the quantitative data needed to assess some of the likely ecological and genetic impacts of barramundi stocking. Access to these data will enable them to address sustainability concerns by refining stocking permit conditions and protocols to ensure that they are aligned with world's best practice. This, in turn, will help to ensure that the substantial benefits of fish stocking are continued to be enjoyed by industry and the community. The results of this project were well received when presented to a dedicated workshop of industry, community stocking groups, fisheries and natural resource managers in Townsville in May 2012. The results will also be available to be used in the development of freshwater fisheries policy by Fisheries Queensland.
Assessing genetic and ecological effects of fish stocking
2
An earlier survey (2008) of key stakeholders including fisheries and conservation managers, community groups and industry representatives identified a number of key management questions related to fish stocking in Australia, including:
Is there leakage of stocked fish into sensitive environmental habitats? Do stocked fish threaten vulnerable species?
Have historic stocking programs caused changes in the genetic population structure of wild stocks?
Are there impacts on survival and growth and displacement of wild fish populations? Is stocking density of barramundi in rivers and impoundments at sustainable and/or
optimal levels?
The first four of these questions formed the basis for the objectives of this current project and were addressed with a particular emphasis on barramundi stocking in the north Queensland Wet Tropics Bioregion.
To address Objective 1, barramundi were strategically stocked into sites in the Johnstone River and Tinaroo Falls Dam at densities similar to what were commonly used in historic stocking programs. Their movements, diet, growth and condition were monitored. Wild stocks of barramundi exist in the Johnstone River but Tinaroo Falls Dam supports only a ‘put and take’ fishery. Stocked barramundi in both the Johnstone River and Tinaroo Falls Dam showed no inclination to move upstream into smaller tributary streams where they would be more likely to encounter and/or impact on prey species that are of conservation significance, for example, some species of amphibians. In the Johnstone River, stocked barramundi generally occupied the same locations and habitat types as wild fish, while in Tinaroo Falls Dam recently stocked juvenile barramundi mostly moved away from tributary streams and into the main body of the impoundment.
Dietary studies of both stocked and wild (Johnstone River) barramundi suggest a low predation rate on prey species that may be considered to be of conservation significance. Rather than being selective in their dietary preferences, barramundi in the study areas are opportunistic predators, consuming a range of different prey items. The diet of barramundi varied depending on the abundance of prey species in the habitats where they were captured. At the current stocking densities, no evidence was found to suggest widespread cannibalism of stocked and/or wild barramundi in the Johnstone River or of stocked fish in Tinaroo Falls Dam.
Growth rates of stocked and wild fish in the Johnstone River were similar, but barramundi in Tinaroo Falls Dam grew at a faster rate, probably because of an abundance of suitable prey and refuge habitat. The condition factor of the stocked barramundi in Tinaroo Falls Dam was similar to that observed in both wild and stocked fish in the Johnstone River.
Assessing genetic and ecological effects of fish stocking
3
Despite barramundi stocking in the Johnstone River being undertaken continuously from 1993 until 2005 and again in 2009, no evidence was found of either a loss of genetic diversity in the wild population or increased inbreeding levels. Furthermore, there was no evidence of movement of genes from the original broodstock back into the wild population of barramundi in the Johnstone River (introgression). Individual family contributions in pre-stocking cohorts and in subsequent recaptures were highly skewed. Tracking the proportions of the various families of stocked barramundi both prior to release and in the recaptured population, while suggesting differential survival between family groups, may simply be due to sampling error.
These results suggest that, for the management issues investigated, barramundi stocking at the current rate in the Johnstone River and Tinaroo Falls Dam have had minimal impact. This is likely to hold true for other catchments in the Wet Tropics Bioregion with similar hydrology patterns, catchment morphologies and land uses. However, increased stocking densities and stocking in other regions will undoubtedly produce different results and there is a need for further research to determine optimal/sustainable stocking levels. There is also a need to develop and implement appropriate hatchery protocols to ensure the future genetic viability of wild barramundi fisheries in Queensland.
Keywords: Freshwater fish stocking, sustainability, environmental impacts, barramundi, Wet Tropics Bioregion.
Acknowledgements
This project would not have been possible without the assistance of the many commercial and recreational fishers who provided biological samples. In particular we wish to thank Steve Howe and Mario Corica.
We also gratefully acknowledge the invaluable guidance given by the steering committee for this project, including Michael Hutchison, Peter Kind, Warwick Nash, Malcolm Pearce, Stuart Rowland and Bill Sawynok.
Department of Agriculture, Fisheries and Forestry , Queensland staff members including Wayne Hagadoorn, Sam Hedge, Stuart Hyland, Mark Leith, Malcolm Pearce, Joe Sariman and others who assisted either in field operations or by collecting samples while engaged in other duties. Giana Gomes also helped in the processing of some of the genetic samples. We would also like to thank members of the Tablelands Fish Stocking Society, and in particular Jenny and John Mondora, who provided the fish for release into Tinaroo Falls Dam for this project and then assisted in tagging and releasing them into the impoundment. We would also like to thank Richard Saunders who assisted in writing and editing this document. The picture of the front cover was supplied courtesy of John and Jenny Mondora.
Assessing genetic and ecological effects of fish stocking
4
Background
Fish stocking in Australia
In Australia, fish stocking activities have resulted in the creation of valuable new ‘put and take’ fisheries as well as enhancing existing wild fisheries (e.g. Cadwallader and Kerby, 1995; Rowland, 1995; Holloway and Hamlyn, 1998). As a result, stocking activities have been of considerable economic benefit to industry and the community, particularly rural and regional communities. Recently, questions have been raised about the environmental sustainability of fish stocking activities, and these need to be addressed if industry and the community are to continue to enjoy the benefits of fish augmentation programs (see Phillips, 2003).
Fish stocking is not a new practice in Australia, with several species of northern hemisphere trout released regularly for over a century. Furthermore, the ready availability of Australian native species, due to advances in fish breeding technologies, has resulted in a huge increase in the magnitude of stocking activities since the late 1970s.
In Queensland alone, there are 73 community fish stocking groups active that are permitted to release fingerlings into approximately 150 locations. In New South Wales in 2010/11, around three million fingerlings were released, up from around 1.24 million in 2001/02. Annual production of Murray cod (Maccullochella peelii peelii), golden perch (Macquaria ambigua) and silver perch (Bidyanus bidyanus) by commercial hatcheries totalled 5–8 million
fingerlings (Rowland and Tully, 2004). In Victoria between 730,000 and a million native fish are released annually with golden perch and Murray cod the dominant species (Department of Primary Industries, 2005).
Benefits of stocking
There have been many positive outcomes from fish stocking activities in Australia. For example, advances in breeding technology for barramundi (Lates calcarifer) in the 1980s resulted in the creation of successful “put and take” recreational fisheries for that species in many Queensland impoundments including Tinaroo Falls Dam. The increase in visitor numbers that resulted from the creation of the Tinaroo Falls Dam fishery has been of significant economic benefit to the local rural community. A cost-benefit analysis of the barramundi stocking program in Tinaroo Falls Dam concluded that each dollar spent on fish stocking returned a potential $31 of economic benefit to the Queensland economy (Rutledge et al. 1991). Hogan (pers. comm.) estimates the value of the Tinaroo Falls Dam fishery alone to be in excess of $10 million. There are also many other examples of highly successful stockings creating large recreational fisheries in impoundments and rivers in New South Wales (Rowland, 1995) and other parts of Australia.
As well as impoundment stocking, a number of fish species have been released into many inland and coastal rivers around Australia. Some of these stockings are designed to enhance or promote the recovery of existing fisheries. Barramundi stocking in Queensland is one example where hatchery-produced fish have been released to enhance existing wild fisheries.
Assessing genetic and ecological effects of fish stocking
5
stocking has been used in some places as a tool for the conservation of the endangered eastern freshwater cod (Maccullochella ikei), trout cod (M. macquariensis) and Mary River cod (M. mariensis)
(www.environment.act.gov.au/__data/assets/pdf_file/0004/156820/Fish_stockplan_2009-2014_final.pdf). In Victoria, trout cod are stocked in small numbers to establish self-sustaining populations to ensure the survival of this species in the wild (Department of Primary Industries, 2005).
Issues with stocking
Adding large numbers of fish, particularly high level predators, to an ecosystem will have environmental consequences. In Australia, potential issues associated with the stocking of native fishes were reviewed by Harris (2003) and discussed at a workshop “Managing Fish Translocation and Stocking in the Murray-Darling Basin” (Phillips, 2003) held in Canberra in September 2002. Gillanders et al.(2006) reviewed the impacts of native fish stocking on fish within the Murray-Darling Basin and recommended that, given the continued increase in stocking of hatchery-reared fish and the potential for such interactions with wild fish, it was essential to take a “responsible approach” and to “monitor and experimentally evaluate any stocking program”.
In the Wet Tropics of north Queensland, a review of stocking activities and consideration of the potential impact of fish stocking was done by Burrows (2002). An Environmental Impact Statement (EIS) on freshwater fish stocking in New South Wales (New South Wales
Fisheries, 2003) noted numerous considerations were likely to pose a risk to the environment. The EIS also highlighted the lack of specific research into the impacts of stocking on the receiving environment.
These reviews and assessments have identified several common threats from stocking
including the loss of population genetic diversity, impacts on indigenous aquatic communities (including threats to listed species), and the spread of diseases. These threats have been recognised globally and have provided some of the impetus for calls for “responsible fish stocking” (Blankenship and Leber, 1995b, a, 1997; Lorenzen et al., 2010) and these calls have been reinforced in Australia (Taylor et al., 2005).
Inherent in the recommendations for responsible fish stocking is the ability to distinguish wild from stocked fish. Numerous marking techniques have been developed and evaluated
including chemical marking (Munro et al., 2008; Woodcock et al., 2011), genetic identification (Robbins et al., 2008) as well as dart, anchor and coded wire tags (Ingram, 1993; Booth and Weyl, 2008). The ability to distinguish wild from stocked fish is essential to evaluate the effectiveness of a stocking program and to facilitate study of the biological impacts of fish stocking. Internationally, such evaluations have been produced, particularly for salmonid stocking in Europe and North America (see Pearsons, 2008). In Australia, while technologies to determine the origin of fish have been the subject of research effort (see Woodcock et al., 2011), little empirical work has been done on the biological impacts of stocking and it remains poorly understood (Taylor et al., 2005).
Biological impacts of stocking
Assessing genetic and ecological effects of fish stocking
6
biological impacts of fish stocking can be broadly categorised into three types (1) ecological, (2) disease and (3) genetic.
Ecological impacts of stocking
It is well established that fish have a strong influence on ecosystem processes and the
mechanisms by which this occurs are complex and diverse. Competition for resources such as food and space is a primary mechanism (Pearsons, 2008). Such density-dependent
mechanisms of impact have been demonstrated (Achord et al., 2003) and it follows that successful stocking can limit the available resources for wild fish populations.
Direct predation by stocked fish is a simple, clear mechanism of ecosystem alteration. Increased mortality of wild fish due to predation by stocked fish has been demonstrated for salmonids (Pearsons and Fritts, 1999) and is likely for other piscivorous fishes such as barramundi. Such direct predation can have flow-on effects beyond the aquatic environment. For example, in North America the dietary changes of a seabird have been at least partly attributed to a stocking program that altered the trophic dynamics in the Laurentian Great Lakes (Hebert et al., 2008). Beyond piscivory, stocked fish consume other animals. There has been speculation that deliberate stocking or accidental introductions of novel fish predators can place at risk significant amphibian and crustacean assemblages, particularly in areas like the high mountain streams of the Queensland Wet Tropics (Burrows, 2002). Burrows (2002) cited European and North American examples of significant reductions, even localised extinctions, of frog populations resulting from the introduction of novel predators (e.g. Bradford, 1989). Impacts on frog populations in Australia have also been documented with introduced trout taking significant numbers of tadpoles of the spotted tree frog (Gillespie, 2001). Other studies have suggested that novel predators can influence the distribution, size structure and behaviour of prey species even though the affected prey species may already have endemic predators (Concepcion and Nelson, 1999; Leberer and Nelson, 2001).
The complexity of ecosystems means that the impact of fish stocking can be far reaching and direct predation is one mechanism by which ecosystems can be impacted. Pearsons (2008), while focussing on salmonids, provides an excellent overview of mechanisms of ecological impacts of stocking and, amongst others, lists direct and indirect predation, behavioural anomalies and changed nutrient dynamics as key impacts on recipient ecosystems and species.
In Australia and New Zealand, declines of native galaxias species have been associated with the stocking of non-native salmonids, primarily brown (Salmo trutta) and rainbow trout (Oncorhynchus mykiss). These species of trout prey directly on native galaxias (Tilzey, 1976; Ault and White, 1994). Evidence of the impact of such predation was provided by the
removal of rainbow trout from a stream in the Australian Capital Territory after which galaxias species were able to recolonise a nine kilometre section of that stream from which they had previously been excluded (Lintermans, 2000). Indirect impacts of stocking trout have also been documented. Specifically, the diet of galaxias overlaps considerably with the introduced salmonids (Glova et al., 1992; Glova and Sagar, 1993). In New Zealand,
introduced salmonids have been demonstrated to consume the majority of all benthic invertebrate production (Huryn, 1996, 1998).
Even without considering direct predation, such predation pressure, combined with a broad dietary overlap, could leave no food resources for native galaxias (McDowall, 2003). In spite of these and other studies, the evidence for the impact of salmonid stocking on galaxias has been criticised as being circumstantial, but the evidence is nonetheless compelling
Assessing genetic and ecological effects of fish stocking
7
invertebrates can also have far reaching consequences for the tropho-dynamics of ecosystems (McIntosh and Townsend, 1996; Biggs et al., 2000).
A further Australian example of ecological impacts was the translocation, for fishery purposes, of the large piscivorous gudgeon the sleepy cod (Oxyeleotris lineolatus) into the upper reaches of the Burdekin River, Queensland in the 1980s. This area of the river is isolated from its lower catchment by the Burdekin Falls. Sleepy cod does not naturally occur in the Burdekin River Basin and the population initially remained small and restricted to the site of introduction for the course of a decade. However, after the occurrence of a large flood and subsequent entry into a prolonged period of drought, it expanded its population size and distribution to a point where it was present in every available tributary of the Burdekin basin (Pusey et al., 2006). This, in addition to the translocation of other species into the upper reaches of the Burdekin River (e.g. barramundi, L. calcarifer), has had a substantial effect on the fish fauna of the river. Post-introduction fish surveys suggest that the spread of sleepy cod was concomitant with a significant decline in abundance of the purple-spotted gudgeon (Morgunda adspersa) in the Burdekin River (Pusey et al., 2006). Further, it would appear that the purple-spotted gudgeon has been driven to near extinction in parts of the Burdekin River when the sleepy cod has reached high abundance (Pusey et al., 2006).
While the above examples are of species (both exotic and native) that were translocated to regions where they did not naturally occur, there is currently limited information on the ecological impacts of enhancement of natural stocks on wild conspecifics or the receiving ecosystems in Australia. While not directly addressing the impacts of fish stocking, some work has been carried out on ecosystem carrying capacity by considering habitat limitations (Taylor and Suthers, 2006; Smith et al., 2011) and dietary requirements (Taylor and Suthers, 2008). This highlights the unresolved question as to whether enhancement programs increase biomass of the target species or displace wild fishes. Indeed, even for highly “successful” stock enhancements of salmonoids in Alaska this question remains valid (Neff et al., 2011).
Disease
Disease outbreaks can have devastating impacts on fish populations (e.g. Rahimian and Thulin, 1996; Gaughan, 2002), and while disease transfers from hatchery fish to wild populations can occur, it has rarely been well documented (but see McVicar, 1997). There are, however, numerous examples of disease transfer from farmed fish to wild fish (see Amos and Thomas, 2002; Olivier, 2002). Inter-species transfer of pathogens is also of concern, for example of fish carrying viruses that can impact amphibians (e.g. Ranavirus: Daszak et al., 1999). These examples serve to demonstrate that there are disease risks associated with introducing captive animals into the natural environment. Management of these risks is an essential component of good stocking practices (Lorenzen et al., 2010).
Genetic impacts of fish stocking
Fish that have been reared in captivity often have reduced and skewed allelic genetic diversity compared to progenitor populations (Taylor, 1991; Palm and Ryman, 1999; Frost et al., 2006). This is because hatchery progeny are usually derived from few parental broodstock that do not possess the wide accompaniment of alleles represented in the species as a whole. Small effective population sizes within hatcheries also result in the production of large numbers of highly related progeny (Frost et al., 2006). Furthermore, captive broodstock are subject to different selective pressures (e.g. domestication selection) to wild fish and their progeny may be poorly adapted to survive in the wild (Lynch and O'Hely, 2001; Ford, 2002).
Thus, when the progeny of these fish are stocked into a wild population, and they survive and breed, there is the potential for these fish to impact the genetic diversity of the wild
Assessing genetic and ecological effects of fish stocking
8
stocking population is too high, this can lead to swamping of the indigenous gene pool with highly related genotypes resulting in increased inbreeding and reduced genetic diversity in the receiving population (Neff et al., 2011). Further, if the stocking population has been subject to domestication selection, intentionally or otherwise, and the genotypes they carry are mal-adapted for wild conditions, it may reduce the genetic fitness of the wild population, which can have long-term implications for the resilience of that population (Christie et al., 2012). Finally, there is the risk of introgression hybridisation where the hybrids between wild and stocked fish inherit a gene (or genes) whose frequency has been artificially increased in the hatchery, but which are detrimental to survival in the wild (Philipp et al., 2002; Marzano et al., 2003). This can result in a reduction in the effective population size and loss of genetic variability (Ward, 2006). However, it is difficult to assess the detrimental impacts of these genetic effects without an understanding of the adaptive significance of the lost or altered traits in the local environment (Houde et al., 2011).
Natural selection in the wild will remove individuals with low fitness, but when these individuals have swamped the natural population and reduced natural genetic diversity, the net effect can be a decline in the overall population size. These effects have been documented for some species. In one example from Spain, the genetic effects of stocking hatchery-reared brown trout into wild populations included (1) stocked fish failing to reproduce, (2) wild brown trout populations experiencing substantial introgression from hatchery stocks and (3) virtual extinction of local endemic populations (Garcia-Marin et al., 1991; Garcia-Marin et al., 1999). Inbreeding depression and loss of genetic variation from bottlenecks (very small effective population size, Ne) have been documented in Atlantic salmon and several trout species (Waples and Drake, 2004).
The need for genetic management during stock enhancement programs is recognised
worldwide. Genetic diversity is positively correlated with fitness (Reed and Frankham, 2001), and interfering with natural genetic diversity can result in populations with less resilience to disease and a reduced ability to meet environmental challenges. Lowering of genetic diversity of progeny coming out of hatcheries is inevitable without the guaranteed contribution of a large number of brood-stock and appropriate breeding programs for the production of offspring. An understanding of the level of interbreeding between stocked and wild fish is essential to determine appropriate stocking rates. In Australia, there is no current
understanding of the genetic interaction between wild and stocked fishes.
Responsible fish stocking
Calls from scientists and the community for “responsible stocking” that takes into account the biological impacts have been made repeatedly over the past fifteen years at national and international levels (Blankenship and Leber, 1995a; Lorenzen, 2005; Taylor et al., 2005; Lorenzen et al., 2010). The call for responsible fish stocking requires research into the impacts of stocking on genetic diversity, ecology of aquatic ecosystems and disease.
Most of the information on sustainability of fish stocking in Australia is from desktop studies using information gleaned from overseas work, particularly for salmonids, the relevance of which is uncertain. To date, there have been no published Australian studies that have sought to directly assess the ecological impacts of stocking programs. Therefore, it would be unwise to excessively extrapolate the outcomes of cold water and temperate fish stocking studies in the northern hemisphere to temperate, tropical and sub-tropical ecosystems in Australia where species assemblages and ecological characteristics differ significantly.
Assessing genetic and ecological effects of fish stocking
9
impacts of stocked barramundi in a model river and impoundment, and (2) determine if barramundi stocking has had any discernible adverse genetic impacts on wild populations in a previously stocked river system.
Consultation
Prior to the commencement of this project, delegates at a national expert workshop held as part of the FRDC sponsored project “Towards responsible native freshwater fish stocking” acknowledged the need for further work on sustainability issues related to barramundi stocking programs and assisted in the development of a project outline. The peak recreational fishing organisation in Queensland (Sunfish) reviewed the proposal for the current project and gave it a high priority. Other groups that were consulted include Sunwater, the Wet Tropics Management Authority, the Freshwater Fishing and Stocking Association of Queensland, the Recfishing Research Steering Committee and resource managers in the Department of Agriculture, Fisheries and Forestry (DAFF) Queensland. This project also addressed priority issues for, and was supported by, the Queensland Freshwater Management Advisory
Committee. More recently, a workshop was held in Townsville in May 2012 where a range of stakeholders including fisheries and natural resource managers, industry representatives, stocking groups and community bodies were briefed on the results of the project.
Need
Recreational fish stocking is widely practised throughout Australia and has delivered considerable benefits to anglers, and substantial economic flow-on effects have been previously documented in some fisheries (Rutledge et al., 1990; Rutledge, 1990). The long-term “success” of freshwater fish stocking in Queensland and other states is, however, contingent on demonstrating that it is an ecologically sustainable practice, having no or minimal detrimental effects on wild populations and ecosystems. Some environmental groups and government agencies (e.g. Wet Tropics Management Authority) are now questioning if freshwater fish stocking is a sustainable activity. The Threatened Species Scientific
Committee considered a nomination to list the introduction of live native or non-native fish into Australian watercourses that are outside their natural geographic distribution as a key threatening process.
One of the criteria that fisheries managers now use for assessing freshwater fish stocking applications is the risk they pose to local aquatic communities, although there is very little real information on the likely ecological and genetic impacts of native freshwater fish stocking activities to support this decision making process. This type of information is
therefore urgently needed if our stocking industry is to adopt “world’s best practice” to ensure future sustainability.
These same concerns were expressed at a 2008 FRDC national expert workshop “Towards responsible native freshwater fish stocking”, where the potential ecological and genetic impacts of fish stocking, particularly for barramundi and Murray cod, were nominated as the most pressing research and management issues. This proposed project is part of a coordinated national response to these critical issues.
Objectives
Assessing genetic and ecological effects of fish stocking
10
2. Determine if barramundi stocking has any discernible adverse genetic impacts on wild populations in a previously stocked river system.
General methods
The overall experimental plan for this study involved releasing batches of hatchery reared juvenile L. calcarifer into a Queensland wet tropics river and impoundment (Figure 1), and then closely monitoring their immediate post-stocking movements, diet, growth and condition. The river selected for this study was the lower freshwater reach of the Johnstone River and the impoundment was Lake Tinaroo (Figure 2). Both these study locations had previously been stocked with L. calcarifer and the Johnstone River has an existing wild barramundi fishery.
Study locations
Lake Tinaroo – is the largest artificial water body in the Wet Tropics bioregion of north Queensland and is an in-channel impoundment on the Barron River (17°10′S, 145°35′E) on the Atherton Tablelands. It has a capacity of 407 000 ML, a surface area of 33.7 km2, a shoreline of 39 km and a surface elevation of 670 m.
Johnstone River – is a large catchment of the Wet Tropics bioregion that has its source on the Atherton Tablelands at an elevation of 1385 m ASL. The system flows into the Coral Sea near the township of Innisfail (17°32′S, 146°02′E). On the coastal plain, the river bifurcates into two major arms—the North and South Johnstone Rivers with catchment areas of 994 km2 and 640 km2 respectively. Both of these rivers have significant upland and lowland components to their catchments that are separated by steep gorge sections with numerous waterfalls and cascades. These act as migratory barriers to most native catadromous species such as L. calcarifer. The vegetation in the lowland sections is heavily cleared for agriculture, however, remnant riparian rainforest consisting of mostly mesophyll vine forest with dominant palms (MFPVF, Type 3) (Tracey, 1982) remains.
Stocking
Fish stocked into the Johnstone Rivers were sourced from two commercial hatcheries using broodstock of local genetic provenance (Keenan, 1994). These hatcheries supplied 5615 and 3808 fish respectively 50–70 mm Total Length (TL) and these were stocked into the
Johnstone River during November–December 2009. During February 2010, a separate batch of fish at ~200 mm TL were released into Lake Tinaroo. These fish were spawned earlier in 2009 and were grown out to a larger size than the Johnstone River fish to meet the
Assessing genetic and ecological effects of fish stocking
11
.
Table 1. Numbers of barramundistocked by site.
Site November 2009 December 2009 February 2010
North Johnstone (NJU) 1625 1724
North Johnstone (NJL) 2183 1854
South Johnstone (SJU) 2037
Lake Tinaroo (Severin Creek) 998
Lake Tinaroo (Kauri Creek) 999
Lake Tinaroo (Robson Creek) 999
12
13
14
Release sites
Johnstone River
In the North Johnstone, stockings for this current study occurred in the tidally influenced lower freshwater reaches of the main channel and further upstream (~ 25 km) at Nerada in Rankin Creek and the adjacent main river channel (Figure 3). In the South Johnstone River, barramundi stockings only took place in Utchee Creek and in the adjacent main river channel. Both the South and North Johnstone Rivers have numerous feeder creeks (stream order ≤ 3) that potentially provide habitat for species of conservation concern (e.g. regionally endemic fish and amphibians). The upper catchments of many of these tributaries drain the Wet Tropics World Heritage Area (WTWHA), a large conservation reserve (894,420 ha) that extends along the north–east Queensland coast from Cooktown in the north to just north of Townsville in the south (http://rainforest-australia.com/wet_tropics_world_heritage.htm).
Stockings sites were selected to 1) encompass the natural range of L. calcarifer in the freshwater reaches of the Johnstone River, and 2) ensure stocked barramundi had the
opportunity to migrate into potential areas of conservation concern (e.g. small feeder streams) by releasing them into locations adjacent to these areas. At all sites, fish were released into areas that provided refuge from predators (i.e. macrophyte beds, rock piles and woody snags) to maximise survival.
Lake Tinaroo
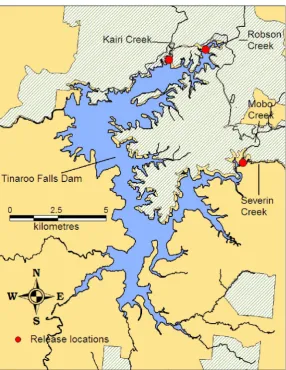
These fish were released into three large arms of the dam: the Severin Creek arm, Robson Creek arm and the Kairi Creek arm (Figure 3). These sites were adjacent to significant feeder creek networks in the Danbulla National Park (also part of the WTMA). The terrestrial vegetation in this area consists mostly of intact rainforest (Complex Notophyll Vine Forest, Type 1c) (Tracey, 1982), and is considered an area of high conservation value with regionally endemic species (i.e. crustaceans, fishes and amphibians).
Tagging program
To facilitate later identification of the stocked fish during the monitoring program, all fish, depending on size, were marked with either a coded wire tag (CWT) or a dart or anchor tag.
Table 1. Numbers of barramundistocked by site.
Site November 2009 December 2009 February 2010
North Johnstone (NJU) 1625 1724
North Johnstone (NJL) 2183 1854
South Johnstone (SJU) 2037
Lake Tinaroo (Severin Creek) 998
Lake Tinaroo (Kauri Creek) 999
Lake Tinaroo (Robson Creek) 999
15
Figure 3. Stocking and sampling locations in Lake Tinaroo (top) and the north and south Johnstone Rivers (bottom).
16
Johnstone River
Prior to their release into the Johnstone River, all L. calarifer, because of their relatively small size (50-70 mm TL), were marked with a CWT (Northwest Marine Technologies Inc., Shaw Island, WA, USA, www.nmt.us). Tags, which measured 1.00 x 0.25 mm diameter, were laser etched with a unique batch number. CWTs were inserted under the skin and into the muscle layer of the cheek (gill cover) using an automatic tag injector (model MKIV). Following tagging, fish were passed through a Quality Control Device (model QCD) to confirm successful tag insertion. Barramundi were then returned to holding tanks for a period of at least two days, and again passed through the QCD to ensure the CWTs had been retained. Fish stocked into the South Johnstone River were double tagged (left and right cheeks), while those released into the North Johnstone River were single tagged (left or right cheek only). Prior to their release, fin clips were taken from samples of L. calcarifer purchased from each of the hatcheries to be used for later genetics analyses (see ‘Genetic tissue sampling’ section below for details).
A handheld magnetic wand detector was used to determine if fish recaptured during field electrofishing surveys were wild or stocked. Upon recapture in the river, if a CWT marked fish had grown larger than ~200 mm, it was externally tagged with a Hallprint type TBF-2 (45 mm) fine anchor T-bar tag (Hallprint Pty. Ltd, Hindmarsh Valley South Australia,
www.hallprint.com). Details of the tagging procedure are outlined in Russell et al. (2003). These tags are marked with a unique number in the flag end to allow non–destructive identification of individual fish. Fish greater than 350 mm were tagged with a Hallprint 85 mm plastic tipped dart tag, which was inserted between the posterior ptyregiophores of the second dorsal fin rays using a hollow tagging needle. Any wild fish caught were also externally tagged using these methods.
Lake Tinaroo
At Lake Tinaroo, because of their larger size (~ 200mm TL), all hatchery reared fish were able to be externally tagged using a Hallprint type TBF-2 (45 mm) fine anchor T-bar tag before being measured (nearest mm TL) and then released in February 2009. These fish were slightly larger and older (spawned mid 2009) than the fish released into the Johnstone River (spawned late 2009 and ~60 mm TL). Lake Tinaroo is an artificial L. calcarifer fishery with no wild stocks, therefore there was no need to distinguish between wild and stocked fish, but there are other age cohorts of unmarked stocked barramundi in the impoundment. The local community fish stocking association assisted in marking the barramundi before their release. If any previously stocked L. calcarifer were captured during subsequent electrofishing surveys, these were also tagged.
Field sampling
Fish sampling techniques
All research sampling during this project was undertaken using electrofishing. In small and shallow streams, this was undertaken using a Smith-Root Model LR24 backpack (Smith Root Inc., Vancouver, Washington, www.smith-root.com) or a smaller 3.5 m aluminium boat fitted with a Smith-Root Model 2.5 GPP electrofisher unit and one netter. A Smith-Root 7.5 GPP boat-mounted electrofisher was used for larger and deeper streams (stream order ≥ 4) or Lake Tinaroo. These boat surveys were conducted with two netters aboard a 4.5 m aluminium boat.
17
the Johnstone River and Lake Tinaroo. Lates calcarifer caught during these surveys were first anesthetised using Aqui-S (Aqui-S Ltd., Lower Hutt, New Zealand, www.aqui-s.com), with dosages ranging between 20–40 mg L−1. Following application of the anesthetic, all fish were weighed, measured (TL), gut–flushed and, if unmarked, tagged with an anchor or dart tag before being released. All Johnstone River barramundi (both stocked and wild) that had not previously been caught in this study were also fin–clipped for a DNA sample. The capture locations of each fish were recorded using a Garmin Model 60CSx GPS (Garmin
International Inc., Kansas City, Kansas, www.garmin.com). At the conclusion of each survey, electrofishing power on time (seconds) was recorded as a measure of fishing effort.
The aim of these surveys was to assess the site fidelity of stocked fish, and to determine the movements of individuals into areas of conservation concern—particularly small, upstream tributaries that drain the WTWHA (Figure 3). Sites were chosen to represent a range of habitats that L. calcarifer could potentially disperse between (i.e. not above migratory barriers such as waterfalls). These included main channel sites in the lower and upper freshwater sections of the Johnstone River catchment, and associated tributaries and headwater streams. In Lake Tinaroo, monitoring took place in the main arms of the impoundment that fish were released into, and associated feeder streams (Figure 3).
Water quality
Surface water quality parameters (dissolved oxygen, turbidity, temperature and salinity) were routinely recorded at each sampling event in both the Johnstone River and Lake Tinaroo using a Yeokal YK615 water quality analyser. Temperature and light in situ dataloggers (Hobo ©) were deployed at multiple locations in both systems.
Growth and condition
The TL of all fish captured was measured to the nearest ± 1 mm. A sub–sample of both wild and stocked fish approximately < 500 mm were also weighed (± 1 g) using Arlec digital scales (Melbourne).
Diet
Stomach contents of captured L. calcarifer were removed by stomach flushing (gastric lavage) (Kamler and Pope, 2001). This method was elected as the most appropriate as it is non–destructive, and was considered an effective technique for fish > 140 mm (Hartleb and Moring, 1995). Lates calcarifer (both stocked and wild) were first anesthetised as described above, and the stomach flushing was then undertaken by inserting soft polypropylene tubing (tube diameter varied depending on fish size) into the fore–gut. A 12 volt mechanical pump was then used to pump freshwater into the stomach of the fish. Once the stomach had visibly expanded with water, gentle pressure was applied and prey items were regurgitated into a sieve. These food items were subsequently stored in vials containing 70% ethanol. A small subsample (n =10) of stomach–flushed L. calcarifer was collected opportunistically (i.e. if a fish was injured/diseased) and the euthanased fish was subsequently dissected in the
laboratory to determine the efficacy of this technique.
Genetic tissue sampling
Broodstock and pre–release fingerlings
18
DNA samples (pectoral or caudal fin clips) and TL measurements were also taken in 2009 from samples of the fingerlings purchased from two commercial hatcheries (Hatchery 1, n = 92 and Hatchery 2, n= 184) for release into the Johnstone River as part of this current project. These samples were taken to a) establish the number of families represented within each hatchery batch and b) to determine the respective contribution to pre–stocking of each of the families.
Pre–stocking genetic profile
To obtain a genetic profile of the Johnstone River L. calcarifer population prior to the commencement of stocking activities, DNA was extracted from a number of archived otolith samples held at the Queensland Government’s Northern Fisheries Centre. These otolith samples were collected from barramundi captured in the Johnstone River system prior to 2000 and were stored dry at room temperature in individual sample vials. The otoliths that were eventually used were selected on the assumption that the very earliest that stocked L. calcarifer could contribute to the spawning population was in 1996, when as three-year-old fish they would be ~ 300–550 mm TL (Russell and Rimmer, 1997). Otoliths from barramundi that were at least three years old in 1996 were judged as wild fish and included in the
analyses. There is no evidence of any unauthorised barramundi stocking in the Johnstone River.
Genetics field sampling
During field sampling of stocked areas in the Johnstone River, caudal or pectoral fin clips were taken from all L. calcarifer (i.e. both stocked and wild) upon their first recapture. Stocked fish were identified via the presence / absence of an internal wire–coded microtag in the flesh of the cheek. This was determined using a handheld wand detector. After capture, all fish large enough (> 170 mm ) were marked externally with a Hallmark fine anchor T-bar tag or dart tag to allow ready identification if recaptured at a later date. This also aided in
eliminating the number of duplicate genetic samples collected and processed in the laboratory.
Analyses
Diet
In the laboratory, prey items in the gut samples were first identified to the lowest possible taxonomic level given their state of digestion, using a stereoscopic binocular microscope. Items were then blotted dry and weighed to the nearest 0.1 g before being volumetrically measured by calculating the displacement of each food group in a graduated measuring cylinder (Hyslop, 1980). The frequency of occurrence of individual prey items in each stomach was also recorded (Hyslop, 1980). Initially prey items were identified to the lowest taxonomic level possible, but later grouped (where possible) into families for analyses. An index of preponderance was calculated (Natarajan and Jhingran, 1961) to determine the prevalence of different prey species in the diet. The formula for calculating this index is:
Ip= ViOi (∑ViOi)-1
19
Detrended Correspondence Analysis (DCA; (McGarigal et al., 2000) was used to assess for differences in diet (Ip) of L. calcarifer between areas using the software package PC-ORD version 4.0 (McCune and Mefford, 1999). In these analyses, five broad zones, North
Johnstone lower (NJL), South Johnstone lower (SJL), North Johnstone middle (NJM), North Johnstone upper (NJU) and Tinaroo Falls Dam (TIN) (Figure 3) were considered. Data were first log (x + 1) transformed and the down-weighting procedure within PC-ORD was applied to reduce the influence of rare species. Food items consumed by less than five fish were removed completely from the analysis. This was because very rare species are likely to appear randomly and their inclusion in the analyses may disproportionately obscure patterns of more commonly consumed prey items (Gauch, 1982). The interaction between diet and site was plotted in a two-dimensional ordination diagram.
Growth and condition
Condition factor of stocked L. calcarifer in Lake Tinaroo and both stocked and wild Barramundi in the Johnstone River was calculated using Fulton’s condition factor (K). The formula for this is:
K = 1003
l w
where w is the fish weight in grams and l is the length in centimetres (Bagenal and Tesch, 1978). In analysing these data, stocked and wild fish in the 2009-2010 cohort were separated into four distinct zones; North Johnstone lower (NJL), South Johnstone lower (SJL), North Johnstone middle (NJM) and Tinaroo Falls Dam (TIN) (Figure 3). Tinaroo Falls Dam was omitted from the analyses because it only contained stocked fish and Zones NJU, SJM and SJU in Figure 3 were not included because of small sample sizes. ANOVAs using total length as a covariate were used to compare condition factors of stocked and wild L. calcarifer within zones and between zones. Growth data were expressed as average daily growth (mm.day-1).
Movements and relative abundance
The recorded locations of recaptured fish were used to determine local movements of both stocked and wild L. calcarifer in the Johnstone River and stocked fish in Lake Tinaroo. To assist with collating and analysing abundance and movement data, each fish was also assigned to a 1 km2 reference grid identical to that used in the Suntag recreational fishing database (http://database.info-fish.net/suntag/recaptures/inputform.asp). This allowed for the ready inclusion of recapture data from the Suntag recreational fishing database. Relative abundance or Catch Per Unit Effort (CPUE) in the form of number of fish caught in each grid per hour was calculated for both stocked and wild fish. A Kruskal-Wallis test was used to compare the median CPUE values of stocked and wild L. calcarifer caught in the Johnstone River and in stocked fish from Tinaroo Falls Dam. CPUEs were also used to give an
20
Movements
Introduction
There have been numerous studies on the movements of wild barramundi (Lates calcarifer) both within Australia and also overseas (e.g. Dunstan, 1959; Dunstan, 1962; Davis, 1986; Milton et al., 2000; Sawynok and Platten, 2009). Barramundi are a facultative catadromous species (e.g. Jones and Sujansingani, 1954) that utilise a range of riverine habitats, including freshwaters, but must return to high salinity environments to spawn and complete their life cycle (e.g. Dunstan, 1959; Moore, 1982; Davis, 1986, 1987; Russell and Garrett, 1988). Many of the published movement studies on this species therefore relate only to seasonal spawning migrations of L. calcarifer where there is a general downstream migration towards coastal spawning grounds (Davis, 1986; Griffin, 1987).
Early tagging studies of L. calcarifer to determine movement were first undertaken in Papua New Guinea and Australia (Dunstan, 1959; Dunstan, 1962). Although very few tags were ever reported as being recaptured in Australia, none were ever recovered in Papua New Guinea. A much more intensive tagging study was later undertaken by Moore and Reynolds (1982) in Papua New Guinea where over 15% of the nearly 6400 fish released were
subsequently recaptured. They found that adult fish released into inland waters migrated to coastal spawning grounds, while at least some of those that were released directly onto spawning grounds moved to inland waters—generally to the same areas from which they originally migrated. Moore and Reynolds (1982) also documented a progressive movement of juveniles from spawning grounds to coastal nursery areas and then upstream into inland waters.
In Australia, Davis (1986) found in the Northern Territory a general seaward movement of mature fish from freshwater, which he associated with spawning. Contrary to the findings of Moore and Reynolds (1982) in Papua New Guinea, he found no evidence of any subsequent return of L. calcarifer to freshwater after spawning. Davis (1986) also found some limited evidence of exchange of fish between river systems. Also in the Northern Territory, Griffin (1987) concluded that L. calcarifer were catadromous, moving upstream as 0+ year old fish where they generally remained until maturity.
Russell and Garrett (1988) conducted an intensive study of the movements of juvenile fish resident in small coastal streams in north–eastern Queensland. In this study, they found that juvenile L. calcarifer remained resident in small tidal creeks until they were about a year old, after which they dispersed into adjacent streams and coastal habitats. The streams investigated by Russell and Garrett (1988) were much smaller systems than either those in the Northern Territory where the work was done by Davis (1986) and Griffin (1987) or in Papua New Guinea (Moore and Reynolds, 1982). Since these initial studies, the most comprehensive tagging study on wild barramundi in Australia (and probably worldwide) has been conducted by recreational fishers under the auspices of the Australian National Sportsfishing
21
reared fish marked prior to their release with coded wire tags (CWT) (Russell and Rimmer, 2004; Russell et al., 2004). The major disadvantage of using CWT is that, in the absence of a second, visually apparent external tag or mark, these fish cannot be readily identified without the use of a special detector (Nielsen, 1992).
The most extensive, continuous tagging study on stocked L. calcarifer was undertaken by the now Queensland Department of Agriculture, Fisheries and Forestry (DAFF) from 1993 to 2005 when some 287 000 stocked barramundi marked with CWT were released into the Johnstone River in North Queensland (see Appendix 3). In addition, a further 9523 CWT L. calcarifer were released into the Johnstone River in 2009 as part of this current study (see General Methods section). Release locations for the 2009 stocking are shown in Figure 3. In February 2010, another 2996 L. calcarifer were also released into Lake Tinaroo and stocking locations in this impoundment are shown in Figure 3. Stocking fish implanted with CWT provides a means of tracing both localised and wider movements. Rimmer and Russell (1998) found that most stocked fish (62%) in the Johnstone River were recaptured within 3 km of their release site, but 38% undertook intra-riverine movements of up to 37 km. A small number (1%) of stocked L. calcarifer undertook inter-riverine and coastal movements both to the north and south of the Johnstone River (Russell et al., 2004). This current study aimed to evaluate the movements of stocked L. calcarifer in both the Johnstone River and Lake Tinaroo to determine if stocked fish were moving into potentially environmentally sensitive areas, including the adjacent Wet Tropics World Heritage Area.
Methods
Techniques used to mark the fish prior to stocking and those used to recapture stocked and wild fish, are outlined in the ‘General methods’ section. In this chapter, fish released into Lake Tinaroo as part of this study will be referred to as the 2009 age class, and those put into the Johnstone River will be identified as 2009-2010 age class. The fish released into the Johnstone River were marked with CWTs only. To assist with determining which river the fish were released into (without recovering the CWT by killing the fish), those stocked into the North Johnstone River were tagged with a single CWT in either the left or right cheek, while those released into the South Johnstone River were tagged with two CWTs, one in each cheek. When these fish were recaptured as part of the electrofishing monitoring program (see ‘General methods’ section) they were marked with an anchor or dart tag prior to being re-released.
Most of the recapture data from this current study and from previous stockings in both the Johnstone River and Lake Tinaroo were recorded in the Suntag database. This database was used, in part, to obtain information on movements of wild L. calcarifer and barramundi stocked into the Johnstone River prior to 2006 as part of previous programs. The Tableland and District Fish Stocking Association provided the barramundi for this current stocking and assisted in the tagging and release of the fish into Lake Tinaroo. Where possible, all
recaptured fish were assigned to a year class either as a result of size or a combination of size, and the presence and location of a CWT. It was not possible to confidently assign all fish, particularly larger barramundi (e.g. > ~500 mm TL) to a year class.
22
CPUE, which was used as an index of relative abundance for both stocked and wild L. calcarifer, was calculated as the number of fish electrofished hr-1. The statistical package Genstat® Release 11.1 (VSN International; www.vsni.co.uk) was used for statistical analyses. The GIS software package Mapinfo® Version 6 (Pitney Bowes Software Inc.,
www.pbinsight.com/MapInfo-Pro) was used to create maps of the Johnstone River and Lake Tinaroo and CPUE data were square root transformed to create thematic maps.
Results
Movements
Inter-riverine movements
Since the commencement of L. calcarifer stocking in the Johnstone River in 1993, there have been only 22 records of both stocked and wild fish making inter-riverine movements to or from this system. Of these, two were stocked fish marked with a CWT that had been released into the Johnstone River in 1999 and 2003. One of these fish had moved south into the adjacent Mourilyan Harbour and the other north into the Mulgrave River. The fish that moved into the Mulgrave River was at liberty for 862 days while the Mourilyan Harbour fish was at liberty for 545 days before recapture (Figure 1). From the original 22, seven wild (non-CWT) fish that were tagged with plastic dart or anchor tags in the Johnstone River as part of past research programs (or by recreational fishers) moved into adjacent river systems. Of these, six moved north into the Russell/Mulgrave River system and the other further north into Trinity Inlet. These fish were at liberty between 429 and 1483 days.
Other barramundi, including at least eight stocked fish, had moved from the Russell/Mulgrave Rivers and were subsequently recaptured in the Johnstone River. These fish were stocked at a larger size (~200-300 mm TL) by a local community stocking group and marked with plastic dart or anchor tags prior to release to facilitate identification. No L. calcarifer stocked as part of this current program have as yet been found to have undertaken inter-riverine movements.
Intra-riverine movements between the North and South Johnstone Rivers
23
None of the L. calcarifer stocked in 2009 as part of the current program has so far been found to have made extensive intra-riverine movements. However, 14 fish with single CWTs were subsequently recaptured in the lower South Johnstone River. Given that only double–tagged fish (both left and right cheeks) were released into the South Johnstone River, it is likely that there has been some movement of stocked fish from the North to the South Johnstone River. No double tagged Barramundi were recaptured in the North Johnstone River, suggesting no or minimal movement of stocked fish out of the South Johnstone River.
Wild L. calcarifer tagged during this current study have made some large intra-riverine movements. Seven barramundi with an average recapture size (± S.E.) of 517 ± 21.3 mm TL were found to have moved from the North Johnstone River into the South Johnstone River. These fish were at liberty for an average of 940 ± 190 days. In the North Johnstone River, three wild L. calcarifer between 413 and 519 mm TL were tracked as moving 37 km downstream from the Nerada site to the lower North Johnstone River.
Linear movements between riverine zones
There were nine wild 2009-2010 year class L. calcarifer that had been marked with plastic tags and then subsequently recaptured. All were caught moving either upstream (n = 4) or downstream (n = 5) in the North Johnstone River. The largest movement was a single fish that moved upstream from the middle zone (NJM) to the upper (Nerada) zone (NJU) (see Figure 3 for zonal definitions). When all year classes (including 2009-2010) of both stocked and wild
L. calcarifer are considered, there were 81 inter-zonal movements. One of these was by a stocked fish that was 775 mm TL when it was recaptured at Nerada (NJU) after being released in the middle zone (NJM) of the North Johnstone River. In the South Johnstone River, three fish from the 2009-2010 stocking cohort were found to have moved downstream. In the North Johnstone River, CWT fish had moved into the NJM zone and up to 6 km upstream of the lower freshwater reach release site. It is not known if these fish moved either upstream or downstream to reach their new recapture locations.
Site fidelity
Of all the 2009-2010 age class fish that were captured, tagged with plastic tags and then subsequently recaptured, 244 were caught in the same zone where they were originally tagged and released. Of these, 135 were stocked fish and 109 were wild fish. The average time at liberty for wild fish was 117 days with a maximum of 457 days and a minimum of 8 days. Stocked fish had a minimum average time at liberty of 163.5 days with a maximum of 616 days and a minimum of 8 days. If the initial release date when fish were stocked into the river was considered, not when they were first caught and tagged with a dart or anchor tag, times at liberty were considerably longer than those reported above.
Table 2. Number of recaptures of stocked and wild barramundi that have made large intra-riverine movements since the commencement of monitoring in the early 1990s.
Some fish were recaptured on more than one occasion. Stocked fish numbers are in parentheses.
Capture site North Johnstone R. South Johnstone R. Ninds Creek (estuary)
North Johnstone R. 88 (65) 14 (7)
South Johnstone R. 71 (20) 9 (8)
Ninds Creek (estuary) 14 (5) 15 (2)
Coastal foreshore 3 (1) 0
24
25
Of the 2996 L. calcarifer that were released into Lake Tinaroo in early 2010, 188 were subsequently recaptured at least once. In addition, a further 119 L. calcarifer that were not part of this current program, but were stocked into Lake Tinaroo on previous occasions, were recaptured. Only five stocked 2009 age class L. calcarifer were not recaptured in the same general locale (i.e. Robson Creek arm or Severin Creek arm) as they were originally released.
However, on a finer scale, there were 31 L. calcarifer caught in the same 1 km2 grid where they were originally released with 23 of these caught within 31 days of release. This indicates a gradual dispersal away from the specific release locations into other parts of the
impoundment. However, a L. calcarifer 1180 mm TL from a previous stocking was
electrofished at one of the release locations suggesting that larger fish do, from time to time, forage in areas of the dam near the mouths of feeder streams. No barramundi, either from these current or previous stockings, were caught in the upper reaches of Lake Tinaroo feeder streams (Figure 4).
26
27
Dispersal of 2009-2010 wild and stocked L. calcarifer
Lake Tinaroo
Areas where stocked fish were not sampled include upstream tributaries of Lake Tinaroo that drain the Wet Tropics World Heritage area (Figure 4). The pink arcs on the tributary creeks in Figure 4 show the approximate upstream limits of the distribution of stocked L. calcarifer. Sites on the western and southern sides of the impoundment showed no evidence of the presence of 2009 age class barramundi and it is likely that, at the time of sampling, large numbers of these fish had not dispersed to these areas. Most of the recaptured L. calcarifer
from the February 2010 stocking were in the arms of Lake Tinaroo close to where the fish were originally stocked. There was some suggestion, however, of a gradual westerly dispersal into the main body of the impoundment. The high relative abundance of 2009 L. calcarifer
28
Green markers show sites