An Engineering Learning Community
To Promote Retention And Graduation
Of At-Risk Engineering Students
Kenneth G. Ricks, University of Alabama, USAJames A. Richardson, University of Alabama, USA Harold P. Stern, Texas State University, USA Robert P. Taylor, University of Alabama, USA Ryan A. Taylor, Mississippi State University, USA
ABSTRACT
Retention and graduation rates for engineering disciplines are significantly lower than desired, and research literature offers many possible causes. Engineering learning communities provide the opportunity to study relationships among specific causes and to develop and evaluate activities designed to lessen their impact. This paper details an engineering learning community created to combat three common threats to academic success of engineering students: financial difficulties, math deficiencies, and the lack of a supportive engineering culture. The project tracks participants in the learning community from first year through graduation to assess the effectiveness of its activities in improving retention and graduation rates. Scholarships were made available to address the financial difficulties; tutors, mentors, study groups, and a “freshman-to-sophomore bridge” summer program were provided to address math deficiencies; cohort engineering courses, active learning techniques, required group meetings, required group study sessions, dedicated study space, and dedicated faculty advisors were used to promote a sense of community. Quantitative retention and graduation rates for the cohort are compared to other engineering groups at the same institution. Qualitative results collected via student surveys and interviews, and lessons learned by project administrators are also presented. Retention and graduation rates of the cohort are better than those of comparable groups at the same institution. Graduation rates based upon freshman math placement are also higher than comparable groups.
Keywords: At-Risk Engineering Students; Engineering Learning Community; Graduation Rate; Retention Rate
I. INTRODUCTION
n 2006, nationally less than 55% of students who began engineering studies actually completed an engineering degree program (Clough, 2006). Another source reports the 2007 average retention rate at U.S. engineering schools was just 56%, and at some schools it was as low as 30% (Grose, 2012). Retention rates of underrepresented minorities in engineering can be significantly worse, as much as 20% lower for certain groups (H. Hartman & M. Hartman, 2006). Although recent research suggests retention rates in engineering are comparable to those in other majors (Ohland et al., 2008) and that the gap in attrition rates between men and women in engineering has narrowed (Marra, Rodgers, Shen, & Bogue, 2012; National Science Foundation [NSF], 2008), there is still concern especially considering the growing demand for graduates in engineering disciplines (Marra et al., 2012).
first year math courses (Gilmer, 2007; Hanover Research, 2011; Herzog, 2003; Moore & Shulock, 2009), lack of work ethic (H. Hartman & M. Hartman, 2006), the so-called “chilly climate” within the engineering community (Gates Jr. & Mirkin, 2012; H. Hartman & M. Hartman, 2006; Marra et al., 2012; Matthews, 2012; Matusovich, Streveler, & Miller, 2010; Seymour & Hewitt, 1997), lack of “hands-on” projects (Knight, Carlson, & Sullivan, 2003), financial difficulties (Grimm, 2005; Scalise et al., 2000; Veenstra, 2010), poor study habits (Grimm, 2005; Scalise et al., 2000), individual characteristics making some students less likely to persist (Litzler & Young, 2012), and institutional characteristics (Tinto, 1975; Tinto, 2006) which are often considered as part of the “climate”.
With improved persistence in STEM disciplines as the goal, many universities are offering programs to address the various reasons presented for lack of retention. Many institutions are establishing cohort learning communities specifically designed to address different aspects of this problem (Gates Jr. & Mirkin, 2012; Gilmer, 2007; H. Hartman & M. Hartman, 2006; Rutar & Mason, 2005; Terenzini, Cabrera, Colbeck, Parente, & Bjorklund, 2001; Zhao & Kuh, 2004), and the successes of such communities are well documented (Zhao & Kuh, 2004). Other initiatives include pre-college bridge programs to better prepare students for their first year (Gates Jr. & Mirkin, 2012; Gilmer, 2007; Grimm, 2005), improved peer and faculty mentoring (Gilmer, 2007), increased undergraduate research opportunities (Gates Jr. & Mirkin, 2012), and various active and collaborative learning initiatives (Knight et al., 2003; Rutar & Mason, 2005; Terenzini et al., 2001).
Though not a new concept, learning communities have only gained broad recognition within the last 15-20 years. In general, learning communities consist of a group of students, connected via some common academic thread, who are offered opportunities for extracurricular interaction through common group activities and/or courses. Due to the shared experiences and common academic interests, participants often demonstrate increased levels of academic engagement, improved personal development, improved social awareness, stronger problem-solving skills, and increased levels of student learning (Zhao & Kuh, 2004). Learning communities typically take one of four forms:
1) curricular learning communities where the student group, as a whole, is enrolled in two or more courses; 2) classroom learning communities where most group activities take place within the classroom and often
involve various active and collaborative learning activities;
3) residential learning communities where the student group lives within close proximity of one another, often on-campus, providing more opportunities for social interaction;
4) student-type learning communities where all the student participants share common personal characteristics, such as members of underrepresented groups, honor students, engineering students, etc. (Zhao & Kuh, 2004).
This paper describes a pilot project at the University of Alabama (UA) that was designed to address three of the significant threats to the academic success of engineering students: financial difficulties, math deficiencies, and a lack of sense of belonging to the engineering community which is often referred to as the “chilly climate” problem. The UA project was built upon well-documented techniques to address these areas of concern such as the establishment of a learning community, availability of scholarships, the use of bridge programs, the use of active and collaborative learning opportunities, and enhanced peer and faculty mentoring. The learning community established as part of this project can be classified as a combination of a curricular community, a classroom community, and a student-type learning community where the common student characteristics include financial need, below average preparation in mathematics, and interest in either Electrical and Computer Engineering (ECE) or Civil Engineering (CE) (Zhao & Kuh, 2004). Participants in the learning community, hereafter referred to as the UA S-STEM program, were tracked from their first year through graduation, and the effectiveness of the cohort activities in improving retention and graduation rates is presented.
students from the economically-depressed regions is heavily impacted by financial obstacles, and substandard high school preparation, especially in mathematics and the sciences, often prevents such students from qualifying for merit-based scholarships. Similarly, many institutions see engineering freshmen placed across a wide range of first semester mathematics courses. For freshmen who are not Calculus-ready, this presents many problems, especially for those who are more than one course removed from taking Calculus I. Finally, all universities with a large College of Engineering are faced with challenges to create a more inviting environment for engineering students, especially for those in underrepresented groups. The popularity of engineering learning communities attests to these challenges.
The original UA participants in the pilot program consisted of 12 freshmen in ECE and 12 freshmen in CE who enrolled at UA in the Fall 2007 semester. Continued participation was based upon participants meeting specified academic and project-related requirements after each semester. Replacements were selected from the pool of transfer applicants from State of Alabama community colleges. In this way, the UA S-STEM program could also provide support to transfer students, another at-risk group (Coston, Lord, & Monell, 2013). In total, ten replacement students were selected during the 5.5 year program, resulting in 34 total participants. The final participant graduated from UA in December 2012.
Project results are meant to provide data reflecting the quality of the activities to promote persistence to graduation. Quantitative data is presented in the form of retention and graduation rates for the participants compared to peer groups. It is believed that comparison data to peer groups not offered the same benefits provides valuable insight to the effectiveness of the project. It is noted that the sample set for this pilot project is small, necessitated by the large financial commitment required to support the student group from the time they entered UA through graduation. However, while not conclusive, the quantitative results are encouraging and can be used when designing larger-scale projects. Finally, qualitative data from this project have resulted in the institutionalization of key ideas at a much larger scale and designed to benefit all entering freshman in the UA College of Engineering.
II. PROGRAM IMPLEMENTATION SPECIFICS
A. Student Selection Process and Criteria
Scholastic Eligibility Requirements
For the first year of the project, student participants were required to be entering freshmen who had met all scholastic requirements necessary for admission to UA and the UA College of Engineering including: high school GPA of at least 3.0 and a minimum math ACT score of 22. The ACT target score was chosen specifically to include participants who might not be Calculus-ready as entering freshmen.
Financial Requirements
Cost of Attendance (COA) for UA is established by university administrators using an estimated student budget for tuition, fees, books, meals, and parking (UA, 2014a). The Estimated Family Contribution (EFC) for a student was determined using the Free Application for Federal Student Aid (FAFSA) form (Federal Student Aid, 2014). The amount of financial need for a student was calculated by Equation 1.
COA – EFC (1)
and any student with positive financial need according to this metric was considered eligible for the UA S-STEM program.
Personal Requirements
Statement of Academic Purpose were reviewed to assess each candidate’s potential to contribute positively to the student cohort. There was no requirement that participants be State of Alabama residents.
Continuing Eligibility Requirements
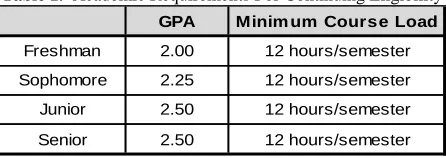
Each participant was assessed for continuing eligibility at the end of each semester. GPA and credit hour requirements are shown in Table 1. GPA and minimum course load requirements were established with the background of many of the participants in mind. The GPA requirements were based upon a 4.00 scale and pertain to on-campus GPA only. Transfer credit was not used in GPA calculations.
Table 1. Academic Requirements For Continuing Eligibility GPA Minim um Course Load
Freshman 2.00 12 hours/semester Sophomore 2.25 12 hours/semester Junior 2.50 12 hours/semester Senior 2.50 12 hours/semester
In addition to these academic requirements, participants had to remain as either ECE or CE majors and be a contributing member of the cohort. For each semester, all participants were assigned a project status: good standing or warning. A status of good standing meant that all academic and project-related requirements were met for the previous semester. The warning status meant that one or more requirements were not met. Those on warning were given specific requirements to meet by the end of the subsequent semester. These requirements were customized to the individual student. For example, in some cases specific GPA requirements were provided. In other cases, specific course loads were required. Exceptions to the GPA and course load thresholds stated in Table 1 were allowed only if students were making progress to eliminate the deficiencies. If individual requirements were met, students could continue in the program. If not met, the student was dropped from the program. In this way, students were given an opportunity to correct any shortfalls before being dropped.
Replacement Students
Attrition of participants occurred both voluntarily and involuntarily. For those students who voluntarily left the program, it was almost always due to a change in major field of study. However, most attrition occurred involuntarily when students were dropped from the program by administrators due to not maintaining the continuing eligibility requirements as stated above. Due to attrition among the original 24 participants, replacements were selected from the pool of transfer applicants from State of Alabama community colleges. In this way, the UA S-STEM program could also provide scholarships and support activities to transfer students, another at-risk group that is often overlooked for such opportunities (Coston et al., 2013). Four replacements entered the program in Fall 2008. Six more entered the program in Fall 2009. Replacements were only invited into the program in Fall semesters to coincide with the beginning of an academic year. Beginning in Fall 2010, it was believed that new members would be difficult to integrate into the cohort considering some of the original students were entering their fourth year and nearing graduation. Also, there was concern that introduction of new members eroded the benefits of the cohort. Therefore, no new members were invited after the Fall 2009 semester. In total, ten replacement students were invited to join the program, resulting in 34 total participants. All participants were evaluated for continuing eligibility using the same metrics regardless of when they joined the program.
B. Project Activities and Support Services
Financial Support
reviews occurring before each semester to determine continuing eligibility. Over the life of the project, $486,600 was allocated for scholarships for the 34 participants.
Table 2. Scholarship Amounts By Academic Year Academ ic Year Scholarship Am ount
2007-2008 $2000/semester 2008-2009 $2500/semester 2009-2010 $2500/semester 2010-2011 $3500/semester 2011-2012 $3500/semester 2012-2013* $3666/semester * Fall 2012 only
Mathematics Support Activities
At many universities, entering freshmen engineering students are typically placed in a wide range of first semester math courses. For those placed in high-level math courses such as Calculus I or higher, they are either on schedule or ahead of the mathematics sequence, since it is typical for curricula in engineering disciplines to start with Calculus I in the first semester of the freshman year. Students not Calculus-ready may have to take one to three courses to prepare them just to start the mathematics sequence. Some universities prevent such students from being admitted to engineering, and some engineering learning communities only admit students at most one course away from Calculus (Gilmer, 2007). For those programs such as UA that have no such limits, this broader range of starting math courses represents an extra burden making it more difficult to retain students. The longer it takes students to become Calculus-ready, the more difficult it is to keep them in the discipline because prerequisite dependencies among courses often make it impossible to find hours that will count toward the degree if a student is not in Calculus I by their second semester. Until these students get through Calculus I, they often have to take courses that do not count toward their degree just to remain as full-time students. For those students in this situation and with financial limitations, they cannot afford to take courses that do not count toward the degree and often solve this problem by changing majors so they are no longer delayed by the Calculus sequence.
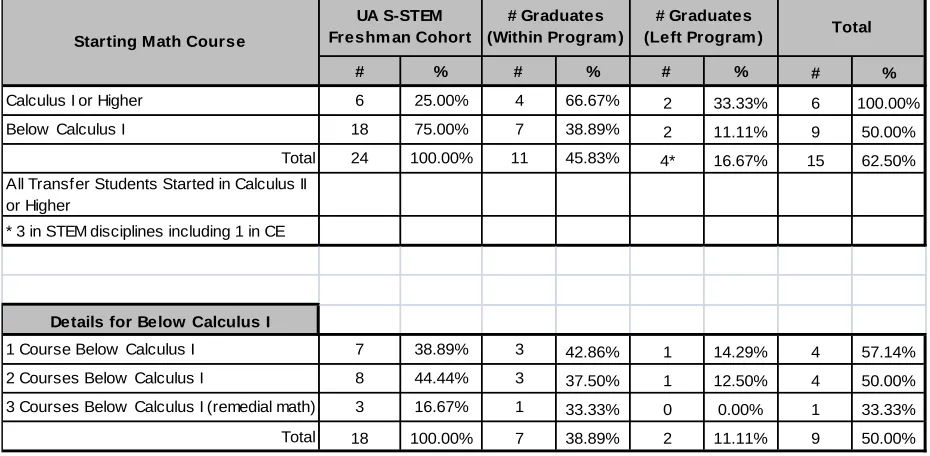
Table 3 shows the starting math courses for the 24 original UA S-STEM participants. Participants were pre-assessed and placed in a starting math course using their score on the standardized mathematics placement test used by UA for all entering freshmen. As shown in Table 3, only six of 24, or 25%, entered UA Calculus-ready, and 11 of the 24 required at least two courses before taking Calculus I. The percentage of students in the UA S-STEM program that are not Calculus-ready is higher than that of typical UA freshman cohorts as shown in Table 4 where this data is presented for general freshman engineering cohorts and for CE and ECE freshman cohorts. However, this higher percentage was by design to assess the effectiveness of the project for at-risk students.
Table 3. Starting Mathematics Courses For Original UA S-STEM Participants
Starting Math Course # % # of Bridge Participants
Calculus I or Higher 6 25.00% 1
1 Course Below Calculus I 7 29.17% 3
2 Courses Below Calculus I 8 33.33% 2
3 Courses Below Calculus I (remedial math) 3 12.50% 0
Total 24 100.00% 6
Table 4. Starting Math Courses For Each Freshman Cohort From 2001-2007 (UA, 2014c)
# % # % # %
2001 Calculus I or Higher 102 36.04% 14 36.84% 6 17.65%
Below Calculus I 181 63.96% 24 63.16% 28 82.35%
Total 283 38 34
2002 Calculus I or Higher 132 40.87% 15 36.59% 13 36.11%
Below Calculus I 191 59.13% 26 63.41% 23 63.89%
Total 323 41 36
2003 Calculus I or Higher 122 37.77% 19 33.93% 13 28.26%
Below Calculus I 201 62.23% 37 66.07% 33 71.74%
Total 323 56 46
2004 Calculus I or Higher 152 42.70% 19 38.00% 28 48.28%
Below Calculus I 204 57.30% 31 62.00% 30 51.72%
Total 356 50 58
2005 Calculus I or Higher 156 39.90% 12 25.53% 23 43.40%
Below Calculus I 235 60.10% 35 74.47% 30 56.60%
Total 391 47 53
2006 Calculus I or Higher 275 54.46% 32 39.02% 31 63.27%
Below Calculus I 230 45.54% 50 60.98% 18 36.73%
Total 505 82 49
2007 Calculus I or Higher 246 50.51% 31 34.07% 34 49.28%
Below Calculus I 241 49.49% 60 65.93% 35 50.72%
Total 487 91 69
Engineering CE ECE
Year Starting Math Course
To help students regarding math deficiencies, weekly peer study sessions were established during the first year of the project. Those participants in Calculus were asked to serve as tutors for the other students. This way, participants in the cohort began to establish strong relationships within the group, and those with strong study skills could advise others, thus taking on a mentoring role. Also, top performing engineering graduate and upper-level undergraduate students were hired to serve as additional mentors and tutors for all participants. Ad hoc training was provided to all tutors/mentors by project administrators, and informal interactions among tutors/mentors and participants were encouraged. Tutoring and mentoring was not limited to but did focus on mathematics courses.
The UA S-STEM program also established a “freshman-to-sophomore bridge” to help students who did not enter as Calculus-ready to “catch-up” in the math courses. Specifically, scholarships were provided to students to take math courses during the summer after the freshman year. Scholarships were only available to those students taking a math course during the summer term. A total of six students took advantage of the summer bridge program, only one of those entered the program as Calculus-ready. One positive result of the “freshman-to-sophomore bridge” was to reduce the mathematics differential between students within the cohort. This strengthened the cohort making it easier for students to form study groups and making it more likely that students within the group could register for the same courses in subsequent semesters.
Community Building Activities
program is crucial for long term persistence in the discipline (Besterfield-Sacre, Atman, & Shuman, 1997; Marra et al., 2012).
The UA learning community established as part of this project was designed to incorporate components from three types of learning communities: curricular communities, classroom communities, and student-type communities (Zhao & Kuh, 2004). The student-type aspects were established based upon the characteristics of the participants and were discussed previously. During the first year, all participants were registered in the same sections of several freshman engineering courses, thus establishing a curricular learning community (Zhao & Kuh, 2004). These courses are generic, introductory-level courses required of all engineering freshmen at UA. To incorporate a classroom community component, active learning techniques were employed within these freshman courses to give students a more “user-friendly” and experimental introduction to the discipline (Zhao & Kuh, 2004). These techniques included hands-on projects and group field trips to engineering sites. Particular attention was given to projects and sites having a social and/or environmental aspect since these are areas that often interest a broad range of student groups from different disciplines, including underrepresented groups. For example, students visited local water treatment facilities and then were asked to design and build prototype water treatment systems. Emphasis was placed on environmentally-friendly water treatment approaches. After the first year, students were encouraged to register for the same courses when possible. However, diverging curricula made it impossible to formalize this as a requirement for the entire group.
Also during the first year, the cohort was required to attend a weekly study session led by a faculty member either in ECE or CE. During this two-hour time period, students were encouraged to break into study groups and tutors were available. Emphasis was placed on mathematics courses; however, any course could be studied. The cohort had access to a dedicated study room with computers and a printer. This space was not advertised as a “lounge”. Instead, students were encouraged to use the space for group meetings and study sessions. Also, mentoring among members of the cohort was encouraged, and the graduate and undergraduate tutors also served as mentors and promoted use of the space as a study room.
Each Fall semester, the cohort was required to attend a project “status” meeting. During this meeting, special time was given to introduce the new students and to attempt to integrate them into the existing group. This was especially important considering that new members missed all of the team-building activities during the first year of the project and considering that transfer students often feel alienated from the rest of the student population at their new institution (Coston et al., 2013).
For the entire duration of the project, students were advised each semester by a faculty member in ECE or CE. Advising took the form of mentoring, professional/career advising, and academic advising. For the latter, faculty advisors reviewed students’ progress toward a degree, determined whether students met all project requirements for continuing eligibility, and helped students plan for future courses.
III. STUDENT PERFORMANCE AND PROJECT RESULTS
A. Quantitative Results
Retention Rates
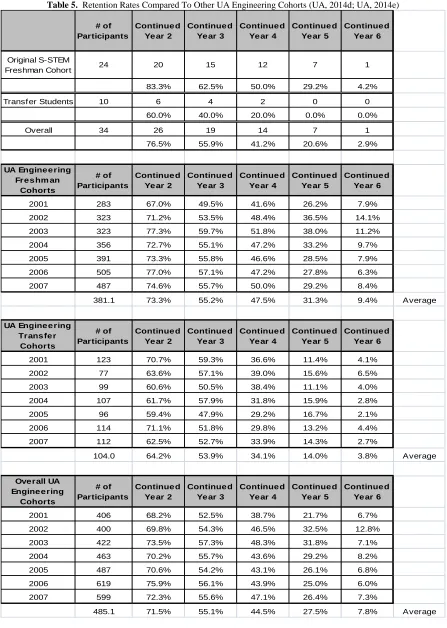
Table 5. Retention Rates Compared To Other UA Engineering Cohorts (UA, 2014d; UA, 2014e)
# of Participants
Continue d Ye ar 2
Continue d Ye ar 3
Continue d Ye ar 4
Continue d Ye ar 5
Continue d Ye ar 6
Original S-STEM
Freshman Cohort 24 20 15 12 7 1
83.3% 62.5% 50.0% 29.2% 4.2%
Transf er Students 10 6 4 2 0 0
60.0% 40.0% 20.0% 0.0% 0.0%
Overall 34 26 19 14 7 1
76.5% 55.9% 41.2% 20.6% 2.9%
UA Engine e ring Fre s hm an
Cohorts
# of Participants
Continue d Ye ar 2
Continue d Ye ar 3
Continue d Ye ar 4
Continue d Ye ar 5
Continue d Ye ar 6
2001 283 67.0% 49.5% 41.6% 26.2% 7.9%
2002 323 71.2% 53.5% 48.4% 36.5% 14.1%
2003 323 77.3% 59.7% 51.8% 38.0% 11.2%
2004 356 72.7% 55.1% 47.2% 33.2% 9.7%
2005 391 73.3% 55.8% 46.6% 28.5% 7.9%
2006 505 77.0% 57.1% 47.2% 27.8% 6.3%
2007 487 74.6% 55.7% 50.0% 29.2% 8.4%
381.1 73.3% 55.2% 47.5% 31.3% 9.4% Average
UA Engine e ring Trans fe r
Cohorts
# of Participants
Continue d Ye ar 2
Continue d Ye ar 3
Continue d Ye ar 4
Continue d Ye ar 5
Continue d Ye ar 6
2001 123 70.7% 59.3% 36.6% 11.4% 4.1%
2002 77 63.6% 57.1% 39.0% 15.6% 6.5%
2003 99 60.6% 50.5% 38.4% 11.1% 4.0%
2004 107 61.7% 57.9% 31.8% 15.9% 2.8%
2005 96 59.4% 47.9% 29.2% 16.7% 2.1%
2006 114 71.1% 51.8% 29.8% 13.2% 4.4%
2007 112 62.5% 52.7% 33.9% 14.3% 2.7%
104.0 64.2% 53.9% 34.1% 14.0% 3.8% Average
Ove rall UA Engine e ring
Cohorts
# of Participants
Continue d Ye ar 2
Continue d Ye ar 3
Continue d Ye ar 4
Continue d Ye ar 5
Continue d Ye ar 6
2001 406 68.2% 52.5% 38.7% 21.7% 6.7%
2002 400 69.8% 54.3% 46.5% 32.5% 12.8%
2003 422 73.5% 57.3% 48.3% 31.8% 7.1%
2004 463 70.2% 55.7% 43.6% 29.2% 8.2%
2005 487 70.6% 54.2% 43.1% 26.1% 6.8%
2006 619 75.9% 56.1% 43.9% 25.0% 6.0%
2007 599 72.3% 55.6% 47.1% 26.4% 7.3%
The retention rates for the freshmen UA S-STEM participants are higher in years two, three, and four compared to that for UA freshmen engineering cohorts, significantly higher in years two and three. The retention numbers for transfer students and the combined numbers also indicate that the UA S-STEM participants did as well or better than their non-S-STEM counterparts. It should be noted that retention rates for years four and five can be deceptive. Graduates who complete their program of study in four years are not available to continue to years five and six. Therefore, lower retention rates in the latter years of the program are not necessarily a bad thing.
Graduation Rates
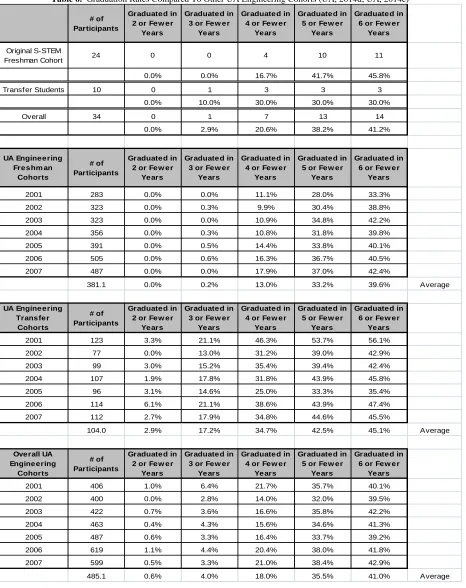
The top portion of Table 6 shows the graduation data of the 34 participants of the UA S-STEM program. In this case, “graduation” means these students persisted in either ECE or CE at UA and maintained their eligibility for the UA S-STEM program through their graduation. In the bottom portions of Table 6, graduation rates for UA engineering freshmen cohorts, engineering transfer cohorts, and overall combined engineering cohorts (freshmen and transfers) from 2001 – 2007 are presented for comparison (UA, 2014d; UA, 2014e). For the comparison cohorts, “graduation” means that these students entered UA in some engineering discipline and graduated with a B.S. in any engineering discipline at UA, and includes those students who changed disciplines within engineering.
The graduation rates for the original UA S-STEM freshman cohort are higher than those for UA freshmen engineering cohorts in most cases, even though the UA S-STEM students were held to a more restrictive environment, i.e. they had to remain in either ECE or CE and they had to meet all continuing eligibility requirements for the UA S-STEM program. The UA S-STEM transfer participant graduation rates and the graduation rates for the combined UA S-STEM group are comparable to or higher than their non-S-STEM counterparts in most cases.
Table 6. Graduation Rates Compared To Other UA Engineering Cohorts (UA, 2014d; UA, 2014e)
# of Participants
Graduated in 2 or Few er
Years
Graduated in 3 or Few er
Years
Graduated in 4 or Few er
Years
Graduated in 5 or Few er
Years
Graduated in 6 or Few er
Years
Original S-STEM
Freshman Cohort 24 0 0 4 10 11
0.0% 0.0% 16.7% 41.7% 45.8%
Transf er Students 10 0 1 3 3 3
0.0% 10.0% 30.0% 30.0% 30.0%
Overall 34 0 1 7 13 14
0.0% 2.9% 20.6% 38.2% 41.2%
UA Engineering Freshm an Cohorts # of Participants Graduated in 2 or Few er
Years
Graduated in 3 or Few er
Years
Graduated in 4 or Few er
Years
Graduated in 5 or Few er
Years
Graduated in 6 or Few er
Years
2001 283 0.0% 0.0% 11.1% 28.0% 33.3%
2002 323 0.0% 0.3% 9.9% 30.4% 38.8%
2003 323 0.0% 0.0% 10.9% 34.8% 42.2%
2004 356 0.0% 0.3% 10.8% 31.8% 39.8%
2005 391 0.0% 0.5% 14.4% 33.8% 40.1%
2006 505 0.0% 0.6% 16.3% 36.7% 40.5%
2007 487 0.0% 0.0% 17.9% 37.0% 42.4%
381.1 0.0% 0.2% 13.0% 33.2% 39.6% Average
UA Engineering Transfer Cohorts # of Participants Graduated in 2 or Few er
Years
Graduated in 3 or Few er
Years
Graduated in 4 or Few er
Years
Graduated in 5 or Few er
Years
Graduated in 6 or Few er
Years
2001 123 3.3% 21.1% 46.3% 53.7% 56.1%
2002 77 0.0% 13.0% 31.2% 39.0% 42.9%
2003 99 3.0% 15.2% 35.4% 39.4% 42.4%
2004 107 1.9% 17.8% 31.8% 43.9% 45.8%
2005 96 3.1% 14.6% 25.0% 33.3% 35.4%
2006 114 6.1% 21.1% 38.6% 43.9% 47.4%
2007 112 2.7% 17.9% 34.8% 44.6% 45.5%
104.0 2.9% 17.2% 34.7% 42.5% 45.1% Average
Overall UA Engineering Cohorts # of Participants Graduated in 2 or Few er
Years
Graduated in 3 or Few er
Years
Graduated in 4 or Few er
Years
Graduated in 5 or Few er
Years
Graduated in 6 or Few er
Years
2001 406 1.0% 6.4% 21.7% 35.7% 40.1%
2002 400 0.0% 2.8% 14.0% 32.0% 39.5%
2003 422 0.7% 3.6% 16.6% 35.8% 42.2%
2004 463 0.4% 4.3% 15.6% 34.6% 41.3%
2005 487 0.6% 3.3% 16.4% 33.7% 39.2%
2006 619 1.1% 4.4% 20.4% 38.0% 41.8%
2007 599 0.5% 3.3% 21.0% 38.4% 42.9%
Graduation Rates for Students Who Left the S-STEM Program
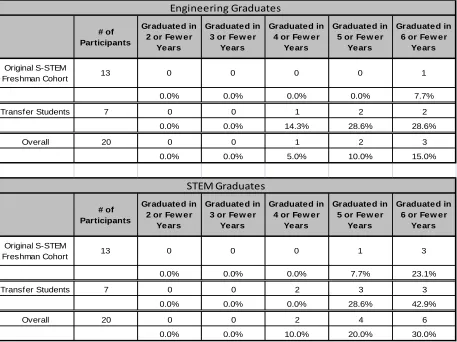
Another group of students should also be considered when evaluating the results of this project. This group consists of those students who left the UA S-STEM project at some point by their own choice or because of not maintaining eligibility requirements. Overall, 20 students separated from the program over the 5.5 year project period. Of these 20, eight separated voluntarily. The separated students participated in many of the cohort activities. Therefore, it is possible that these activities played a role in their academic progress. Unfortunately, students who left UA were difficult to track, resulting in no data for those students. However, some students who left the UA S-STEM program stayed at UA and their progress was tracked. Table 7 shows the graduation rates for the students who separated from the program and graduated from UA in either engineering or another STEM discipline. Out of the 20 students who separated from the program, seven graduated from UA, six of those in STEM disciplines including three in engineering. These are worst-case numbers since they only represent those seven students who remained at UA.
Table 7. Graduation Rates For Participants Who Left The UA S-STEM Program
# of Participants
Graduated in 2 or Few er
Years
Graduated in 3 or Few er
Years
Graduated in 4 or Few er
Years
Graduated in 5 or Few er
Years
Graduated in 6 or Few er
Years
Original S-STEM
Freshman Cohort 13 0 0 0 0 1
0.0% 0.0% 0.0% 0.0% 7.7%
Transf er Students 7 0 0 1 2 2
0.0% 0.0% 14.3% 28.6% 28.6%
Overall 20 0 0 1 2 3
0.0% 0.0% 5.0% 10.0% 15.0%
# of Participants
Graduated in 2 or Few er
Years
Graduated in 3 or Few er
Years
Graduated in 4 or Few er
Years
Graduated in 5 or Few er
Years
Graduated in 6 or Few er
Years
Original S-STEM
Freshman Cohort 13 0 0 0 1 3
0.0% 0.0% 0.0% 7.7% 23.1%
Transf er Students 7 0 0 2 3 3
0.0% 0.0% 0.0% 28.6% 42.9%
Overall 20 0 0 2 4 6
0.0% 0.0% 10.0% 20.0% 30.0%
Engineering Graduates
STEM Graduates
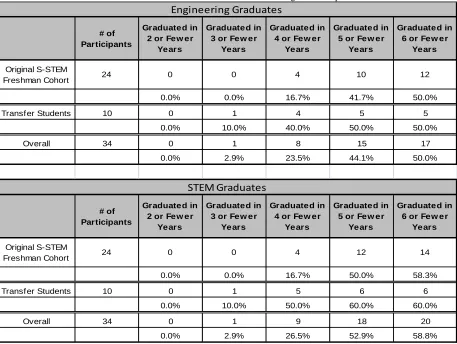
Although not shown in Table 8, it should be noted that one other student from the UA S-STEM program graduated in a non-STEM discipline bringing the total graduation rate to 61.8%.
Table 8. Graduation Rates For All UA S-STEM Program Participants
# of Participants
Graduated in 2 or Few er
Years
Graduated in 3 or Few er
Years
Graduated in 4 or Few er
Years
Graduated in 5 or Few er
Years
Graduated in 6 or Few er
Years
Original S-STEM
Freshman Cohort 24 0 0 4 10 12
0.0% 0.0% 16.7% 41.7% 50.0%
Transf er Students 10 0 1 4 5 5
0.0% 10.0% 40.0% 50.0% 50.0%
Overall 34 0 1 8 15 17
0.0% 2.9% 23.5% 44.1% 50.0%
# of Participants
Graduated in 2 or Few er
Years
Graduated in 3 or Few er
Years
Graduated in 4 or Few er
Years
Graduated in 5 or Few er
Years
Graduated in 6 or Few er
Years
Original S-STEM
Freshman Cohort 24 0 0 4 12 14
0.0% 0.0% 16.7% 50.0% 58.3%
Transf er Students 10 0 1 5 6 6
0.0% 10.0% 50.0% 60.0% 60.0%
Overall 34 0 1 9 18 20
0.0% 2.9% 26.5% 52.9% 58.8%
STEM Graduates
Engineering Graduates
Table 9. Graduation Status vs. Starting Math Course For The Original UA S-STEM Students
# % # % # % # %
Calculus I or Higher 6 25.00% 4 66.67% 2 33.33% 6 100.00%
Below Calculus I 18 75.00% 7 38.89% 2 11.11% 9 50.00%
Total 24 100.00% 11 45.83% 4* 16.67% 15 62.50%
All Transfer Students Started in Calculus II or Higher
* 3 in STEM disciplines including 1 in CE
Details for Below Calculus I
1 Course Below Calculus I 7 38.89% 3 42.86% 1 14.29% 4 57.14%
2 Courses Below Calculus I 8 44.44% 3 37.50% 1 12.50% 4 50.00%
3 Courses Below Calculus I (remedial math) 3 16.67% 1 33.33% 0 0.00% 1 33.33%
Total 18 100.00% 7 38.89% 2 11.11% 9 50.00% Starting Math Course
UA S-STEM Freshm an Cohort
# Graduates (Within Program )
# Graduates (Left Program ) Total
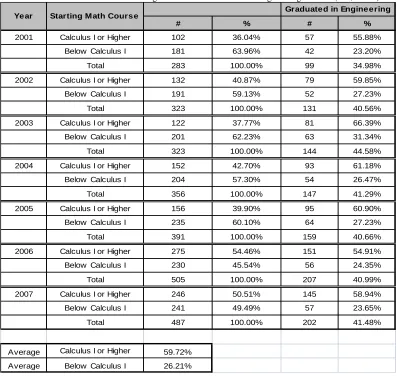
Comparative data for UA freshman engineering cohorts is shown in Table 10. Again, the data is presented as percentages of the total size of each math group, not the total cohort size. All students who graduated as of Summer 2013 are included in Table 10. This is in contrast to providing graduation rates within a sliding timeframe as was done in Table 6. Considering both those students who completed the UA S-STEM program and those who left the program, 100% of the Calculus-ready participants graduated compared to the average of 59.7% for the engineering cohorts. Even if one only considers the UA-STEM participants that graduated as part of the UA S-STEM program, the 66.7% (four out of six) graduation rate of those who were Calculus-ready is significantly higher than any UA engineering cohort.
Table 10. Graduation Data vs. Starting Math Courses For General Engineering Cohorts (UA, 2014c)
# % # %
2001 Calculus I or Higher 102 36.04% 57 55.88%
Below Calculus I 181 63.96% 42 23.20%
Total 283 100.00% 99 34.98%
2002 Calculus I or Higher 132 40.87% 79 59.85%
Below Calculus I 191 59.13% 52 27.23%
Total 323 100.00% 131 40.56%
2003 Calculus I or Higher 122 37.77% 81 66.39%
Below Calculus I 201 62.23% 63 31.34%
Total 323 100.00% 144 44.58%
2004 Calculus I or Higher 152 42.70% 93 61.18%
Below Calculus I 204 57.30% 54 26.47%
Total 356 100.00% 147 41.29%
2005 Calculus I or Higher 156 39.90% 95 60.90%
Below Calculus I 235 60.10% 64 27.23%
Total 391 100.00% 159 40.66%
2006 Calculus I or Higher 275 54.46% 151 54.91%
Below Calculus I 230 45.54% 56 24.35%
Total 505 100.00% 207 40.99%
2007 Calculus I or Higher 246 50.51% 145 58.94%
Below Calculus I 241 49.49% 57 23.65%
Total 487 100.00% 202 41.48%
Average Calculus I or Higher 59.72%
Average Below Calculus I 26.21%
Year Starting Math Course Graduated in Engineering
B. Qualitative Results
While retention and graduation rates provide quantitative data for evaluation of the project, student activities and accomplishments while participating in the UA S-STEM program, student feedback, and observations from project administrators serve as qualitative evaluation metrics. The following is a list of notable accomplishments by the students who completed the UA S-STEM project. This data was collected via surveys, student interviews, and review of student records.
Notable student accomplishments:
Seven (7) students participated in the UA Cooperative Education Program.
One (1) student participated in a Research Experiences for Undergraduates (REU) program in California during Summer 2009 and Summer 2010.
One (1) participant was recognized as the ECE Sophomore Meritorious Award Winner in Spring 2009, the ECE Junior Meritorious Award winner in Spring 2010, and the ECE Senior Meritorious Award winner in Spring 2011 having maintained an overall GPA of 4.00/4.00.
At least seven (7) graduates are employed full-time as engineers in their respective discipline (only twelve (12) students surveyed).
One (1) participant served as President of the UA IEEE student chapter.
One (1) participant was a member of the UA IEEE SoutheastCon Hardware Competition Team, placing 6th out of 54 teams at the competition in Orlando, Florida in Spring 2012.
According to student feedback, much of this progress can be attributed to the peer study groups, mentoring, and tutoring created as part of the project. The financial assistance was also recognized as an integral part for these students. Student testimonials are presented below supporting these conclusions.
“I wanted to personally say thank you so much for the opportunities that you have helped me receive through the S-STEM project. It really helped me financially …”
“…the classes that myself and the other students had together as a group freshman year created bonds and study partners that lasted throughout college.”
Finally, some observations and conclusions from project administrators are presented. These observations were developed after 5.5 years coordinating the project, interacting with the student participants, conducting student interviews and compiling survey results, and interviews with project administrators for similar projects at other institutions.
Students felt that their cohort study groups were a significant part of this project and directly contributed to their success.
Recruiting of transfer students was very time consuming. In fact, if student progress is evaluated after the end of each semester, it is virtually impossible to recruit new participants between the Fall and Spring semesters. This results in attrition that cannot be replaced in the Spring semester. Also, adding new participants to the cohort group each semester tends to erode the benefits of the cohort itself.
Student feedback indicates that undergraduates appreciated mentoring and tutoring from undergraduate upperclassmen more so than from graduate students. There seemed to be an element of intimidation when interacting with graduate students.
The mentoring success of this project helped in the institutionalization of a mentoring program within the UA College of Engineering. Specifically, a new program, called Mentor UPP: Undergraduate Peer Partnering, has been created to facilitate peer mentoring. In the Mentor UPP program, undergraduates at the junior and senior levels serve as peer mentors to freshmen, sophomores, and transfer students. As lower-level undergrads advance, they are asked to give back by serving as mentors in the program. Faculty also serve as mentors to groups of undergrads, and plans include the use of alumni mentors for upper-level undergraduates (UA, 2014b).
Transfer students need special programs to help them acclimate to their new environment.
The establishment of efficient procedures needed to perform the administrative tasks associated with this type of project is critical. Necessary tasks included review of the academic status of all students each semester, allocation of scholarships each semester, recruiting replacements, verification of financial need, academic advising, and coordination of student support services like hiring tutors, lining up mentors, and organizing extracurricular activities. These tasks required coordination with several offices across campus and should not be taken lightly, especially considering the dynamic nature of student activities (dropping and adding courses without permission, changing majors without consulting an advisor, etc.). This infrastructure played a significant role in project success and failure.
IV. CONCLUSIONS AND FUTURE WORK
The research reported in this paper contributes to the knowledge base regarding the effectiveness of learning communities for increasing retention and graduation rates in STEM disciplines, specifically in this case engineering disciplines. This project was designed to address three significant threats to the academic success of engineering students: financial difficulties, math deficiencies, and a lack of sense of belonging to the engineering community. Scholarships were made available to address the financial issues; tutors, mentors, study groups, and a “freshman-to-sophomore bridge” summer program were provided to address math deficiencies; cohort engineering courses, active learning techniques involving field trips and hands-on projects, required group meetings, required study sessions, peer mentoring, dedicated study space, and dedicated faculty advisors were used to promote a sense of community and belonging as well as improved study habits.
The resulting retention and graduation rates of the participants completing the project are higher than most comparable cohort groups at the same institution. Additional analysis was performed on those students who partially completed the project, leaving before completion either voluntarily or due to failing to meet one or more continuing eligibility requirements. When combined with those who completed the project, retention and graduation rates are significantly higher than comparable cohort groups. Qualitative student feedback indicates that scholarships, cohort course sections, study groups, and peer mentoring/peer relationships played a significant role in student successes.
The next step is to continue institutionalization of many aspects of this project. While Mentor UPP is one example of institutionalization resulting from this project, there are opportunities for others. Specifically, more work is needed to help transfer students acclimate to a new institution and to succeed. Scholarship and mentoring programs dedicated to transfer students are in short supply and are desperately needed. More research is needed to study relationships among math starting points and graduation and retention rates. For those students who need several pre-Calculus courses, there needs to be courses that will count toward the degree while the student is prepping for Calculus I. This can be solved in many cases by decoupling some courses from the Calculus sequence, specifically courses that have little dependence upon the Calculus material but use Calculus as a prerequisite “filter” for scholastic maturity. Finally, more research is needed to investigate non-academic reasons for “drop out” among engineering students.
REFERENCES
1. Besterfield-Sacre, M., & Atman, C. J., & Shuman, L. (1997). Characteristics of Freshman Engineering Students: Models for Determining Student Attrition in Engineering. Journal of Engineering Education, 86(2), 139–149.
2. Clough, G. W. (2006). Reforming Engineering Education. The Bridge. 36(2), 3.
3. Coston, C. T. M., & Lord, V. B., & Monell, J. S. (2013). Improving the Success of Transfer Students: Responding to Risk Factors. Learning Communities Research and Practice, 1(1), Article 11. Retrieved from http://washingtoncenter.evergreen.edu/lcrpjournal/vol1/iss1/11.
4. Federal Student Aid. (2014). Free Application for Federal Student Aid. Retrieved from https://fafsa.ed.gov/.
6. Gilmer, T. C. (2007). An Understanding of the Improved Grades, Retention, and Graduation Rates of STEM Majors as the Academic Investment in Math and Science (AIMS) Program of Bowling Green State University (BGSU). Journal of STEM Education. 8(1, 2), 11-21.
7. Grimm, M. (2005). Work in progress – An Engineering Bridge Program – The Foundation for Success for Academically At-Risk Students. Proceedings of the 35th ASEE/IEEE Frontiers in Education Conference, Indianapolis, IN.
8. Grose, T. K. (2012). 10,000 Challenge. ASEE Prism. Retrieved from http://www.prism-magazine.org/feb12/feature_02.cfm.
9. Hanover Research. (2011). Innovative Practices for Improving Student Performance in College Level Mathematics. Retrieved from
http://www.mybrcc.edu/intranet/attachments/article/110/Innovative%20Practices%20for%20Improving%2 0Student%20Performance%20in%20College%20Level%20Mathematics.pdf.
10. Hartman, H., & Hartman, M. (2006). Leaving Engineering: Lessons from Rowan University’s College of Engineering. Journal of Engineering Education, 95(1), 49-59.
11. Herzog, S. (2003). Measuring Determinants of Student Return vs. Transfer vs. Stopout, vs. Dropout: A First-to-Second year Analysis of New Freshmen. Paper presented to the California Association for Institutional Research. Retrieved from
http://www.cair.org/conferences/CAIR2003/SergeHerzogBPComp.pdf.
12. Knight, D. W., & Carlson, L. E., & Sullivan, J. F. (2003). Staying in Engineering: Impact of a Hands-On, Team-Based, First-Year Projects Course on Student Retention. Proceedings of the 2003 American Society for Engineering Education Annual Conference & Exposition. Retrieved from
http://itll.colorado.edu/images/uploads/about_us/publications/Papers/ASEE%2003%20Retention%20GEE N%201400%20Proceedings.pdf.
13. Lichtenstein, G., & McCormick, A. C., & Sheppard, S., & Puma, J. (2010). Comparing The Undergraduate Experience Of Engineers To All Other Majors: Significant Differences Are Programmatic. Journal of Engineering Education. 99(4), 305-317.
14. Litzler, E., & Young, J. (2012). Understanding the Risk of Attrition in Undergraduate Engineering: Results from the Project to Assess Climate in Engineering. Journal of Engineering Education. 101(2), 319–345. 15. Marra, R. M., & Rodgers, K. A., & Shen, D., & Bogue, B. (2012). Leaving Engineering: A Multi-Year
Single Institution Study. Journal of Engineering Education. 101(1), 6-27.
16. Matthews, M. (2012). Keeping students in engineering: A research-to-practice brief. American Society for Engineering Education. Retrieved from http://www.asee.org/retention-project/keeping-students-in-engineering-a-research-guide-to-improving-retention.
17. Matusovich, H. M., & Streveler, R. A., & Miller, R. (2010). How They See Themselves: Students who identify with engineering persist in the field. ASEE Prism.
18. Moore, C. & Shulock, N. (2009). Student Progress Toward Degree Completion: Lessons from the Research Literature. Institute for Higher Education Leadership and Policy, p. 4, Retrieved from
http://www.csus.edu/ihelp/PDFs/R_Student_Progress_Toward_Degree_Completion.pdf.
19. National Science Foundation, Science and Engineering Indicators: 2008 (NSB 08-01), Retrieved from http://www.nsf.gov/statistics/seind08/pdf/front.pdf.
20. National Science Foundation Scholarships in Science, Technology, Engineering, and Math (S-STEM) Program. (2014). Retrieved from http://www.nsf.gov/funding/pgm_summ.jsp?pims_id=5257&org=DUE. 21. Ohland., M., & Sheppard, S., & Lichtenstein, G., & Eris, O., & Chachra, D., & Layton, R. (2008).
Persistence, Engagement, and Migration in Engineering Programs. Journal of Engineering Education. 97(3), 259–278.
22. Parker, M. (2005). Placement, Retention, and Success: A Longitudinal Study of Mathematics and Retention. The Journal of General Education, 54(1), 22-40.
23. Rutar, T., & Mason, G. (2005). A Learning Community of Freshman Design, Freshman Graphics, and High School Technology Students: Description, Projects, and Assessment. Journal of Engineering Education. 94(2), 245-254.
25. Seymour, E. Y., & Hewitt, N. M. (1997). Talking About Leaving: Why Undergraduates Leave the Sciences, Colorado: Westview Press.
26. Terenzini, P. T., & Cabrera, A. F., & Colbeck, C. L., & Parente, J. M., & Bjorklund, S. A. (2001). Collaborative Learning vs. Lecture/Discussion: Students’ Reported Learning Gains. Journal of Engineering Education. 90(1), 123-130.
27. The University of Alabama. (2014a). Retrieved from http://cost.ua.edu/undergraduate-budget.html. 28. The University of Alabama College of Engineering Mentor UPP Program. (2014b). Retrieved from
http://mentoring.eng.ua.edu/.
29. The University of Alabama Office of Institutional Research and Assessment. (2014c). First-Time, Full-Time Undergraduate Engineering Cohorts by First Math Course and Graduation in Engineering. Internal report.
30. The University of Alabama Office of Institutional Research and Assessment. (2012, updated 2014d). Engineering Graduation and Retention Rates. Internal report.
31. The University of Alabama Office of Institutional Research and Assessment. (2010, updated 2014e). Engineering Graduation Rate of Transfer Students. Internal report.
32. Tinto, V. (1975). Dropout from Higher Education: A Theoretical Synthesis of Recent Research. Review of Educational Research. 45(1), 89-125.
33. Tinto, V. (2006). Research and Practice of Student Retention: What Next? Journal of College Student Retention. 8(1), 1-19.
34. Veenstra, C. P. (2010). The Diversity of STEM Majors and a Strategy for Improved STEM Retention. Veenstra and Associates, Retrieved from
https://static.squarespace.com/static/51fafa0ee4b0d906af53ce83/51fb1157e4b0951c6cc91d03/51fb1157e4b 0951c6cc91d08/1325119321937/Diversity-of-STEM-Majors.pdf.