First-Year Effects Of An Engineering
Professional Development Program
On Elementary Teachers
So Yoon Yoon, Purdue University, USAHeidi Diefes-Dux, Purdue University, USA Johannes Strobel, Purdue University, USA
ABSTRACT
The ultimate objective of teacher professional development (TPD) is to deliver a positive impact on students’ engagement and performance in class through teacher practice via improving their content and pedagogical content knowledge and changing their attitudes toward the subject being taught. However, compared to other content areas, such as mathematics and science, relatively few engineering TPD programs have been developed, and there has been a lack of research on the effective practice of TPD for K-12 engineering education. As a part of a five-year longitudinal project, this study reports the first-year effect of TPD offered by the Institute for P-12 Engineering Research and Learning (INSPIRE) at Purdue University on elementary teachers integrating engineering. Thirty-two teachers of second through fourth grade from seven schools attended a one-week intensive Summer Academy and integrated engineering lessons throughout the year. Based on a pre- and post-test research design, multiple measures were utilized to examine changes in teachers’ knowledge and perceptions of engineering and their variations in knowledge and perceptions by school and teacher characteristics. Overall, teachers were satisfied with the engineering TPD program, significantly increased their engineering design process knowledge, and became more familiar with engineering. While teachers’ knowledge about engineering did not vary by school and teacher characteristics, some aspects of teachers’ perceptions regarding engineering integration and their practice differed by school and teacher characteristics.
Keywords: K-12 Engineering Education; Teacher Professional Development; Engineering Integration; Elementary Teachers
INTRODUCTION
eacher professional development (TPD) is an essential gateway to improving teachers’ knowledge in any content area and their classroom teaching practices (Guskey, 2003, 2005). Professional development for engineering education is no exception. Through engineering TPD, it is hoped that teachers will increase their content, curricular, and pedagogical content knowledge as well as develop confidence and a positive attitude toward engineering (Katehi, Pearson, & Feder, 2009).
The preparation of teachers for effective K-12 engineering education, however, has been a challenge for TPD developers because many teachers lack an educational background in engineering (Custer & Daugherty, 2009) and the introduction of engineering means added complexity in classrooms and educational systems. This complexity includes the introduction of a new content area, the integration of which must be actively negotiated with other subject areas. It also includes new pedagogical approaches, such as the engineering design process, optimization, and modeling. Despite the added complexity, the result of introducing engineering into K-12 classrooms could be, and in some cases is, that teachers see the relevance of engineering processes for the improvement of school practices (Lee & Strobel, in press).
In addition, compared to other subject areas, such as mathematics and science, relatively few professional development programs have been created, implemented, and evaluated in the context of K-12 engineering education (e.g., Brophy, Klein, Portsmore, & Rogers, 2008; Daugherty, 2009; Moskal et al., 2007). Further, according to reports by the Committee on K-12 Engineering Education (Katehi et al., 2009), teacher preparation programs have produced only a modest-sized engineering teaching workforce and rigorously-researched models are scarce.
While few in number, studies have reported positive effects of engineering TPD. For instance, teachers who attended a TPD program demonstrated increased mathematics and science content knowledge (Macalalag, Lowes, Guo, Tirthali, Mckay, & McGrath, 2010) and improved their instruction of these subjects (Moskal et al., 2007). Students also improved their academic performance in engineering-related subjects, such as mathematics and science (Macalalag et al, 2010; Mehalik, Doppelt, & Schuun, 2008). Further, TPD projects engaged a wide range of diverse students (e.g., Cantrell, Pekcan, Itani, & Velasquez-Bryant, 2006). Overall, both teachers and students in experimental groups that integrated engineering in their classrooms outperformed counterparts in control groups (Macalalag et al., 2010).
While substantial work has focused on improvement of students’ academic performance, the studies about the effects of TPD programs on teachers have mostly been descriptive. In other words, the effects of TPD on teachers have rarely been investigated, at least not with great rigor. This dearth of research has recently become even more alarming since engineering is now incorporated as a “core idea,” “crosscutting concept,” and “authentic practice” in the new national science standards framework (NRC, 2011) and in the forthcoming Next Generation Science Standards (Achieve, 2013). Thus, there is a dire need for rigorous research-based evaluation of the effects of profession development on teachers and students (Daugherty, 2009; Katehi et al., 2009) to identify the best practices for TPD.
Purpose of the Study
This study introduces research on a TPD program designed by the Institute for P-12 Engineering Research and Learning (INSPIRE) housed at Purdue University in the United States. As a part of a five-year longitudinal study, we report the first-year effects of the TPD on elementary teachers through an evaluation framework grounded in Guskey’s TPD evaluation framework (1998, 2005). This study attempts to rigorously investigate the impact of the first year of the engineering TPD program on teachers as well as associated relationships among school and teacher characteristics. Here, we define the direct effectiveness of the TPD on teachers as an increase in their knowledge and changes in their perceptions regarding engineering and engineering education. While the longitudinal project includes evaluation of both teachers and students, the purpose of this study is to investigate the effect of the TPD on teachers’ knowledge and perceptions, as well as the associated relationships among the putative factors that may control the effect of the TPD.
Based on INSPIRE’s TPD evaluation framework discussed in the Theoretical Framework section, the primary research questions focus on the direct effects of the TPD on teachers: (a) were teachers satisfied with the TPD program?; and (b) how were teacher knowledge and perceptions regarding engineering changed by the TPD program?. The secondary questions seek to explore the associations among school and teacher characteristics: (c) how did teacher knowledge and perceptions regarding engineering differ by teacher characteristics?; (d) how was teacher practice associated with teacher characteristics?; and (e) how did school characteristics account for teacher knowledge, perceptions, and practice?
Background
and reluctance. Thus, teachers’ feelings of ineptitude toward engineering would be a barrier to effective engineering TPD. In the meantime, however, teachers can overcome these feelings through effective TPD. Third, due to differences in teacher education between elementary and secondary education, TPD needs to be differentiated by grade level. While secondary teachers have specializations in particular subject areas, elementary teachers generally do not. Therefore, different approaches in TPD are necessary depending on teachers’ grade level or school operations. Finally, along with the lack of research-based evaluation of TPD programs, there have been no exemplary TPD models for K-12 engineering education. However, research results on TPD programs in other subject areas, such as mathematics and science, can provide guidance for successful approaches for the design of TPD programs.
Several studies – responding to the committee’s call for more research – have investigated engineering TPD and reported on efforts to implement TPD programs for successful K-12 engineering education. In the Teachers Integrating Engineering into Science (TIES) project, middle school science teachers took a course consisting of three, ten-hour TPD sessions and developed three modules to teach science topics in their classes. The modules included a web-based simulation activity, lesson plan development, an engineering design project, assessments, and materials (Cantrell et al. 2006). In the TIES program, ten teachers attended five, four-hour TPD workshops to apply the engineering design based approach to their science courses. Similarly, Mehalik, Doppelt, and Schunn (2008) conducted an experimental study comparing the different effects on middle school students’ science performance between two instructional methods (traditional scripted inquiry versus an engineering design based approach). Moskal et al. (2007) reported their four-year efforts concerning the effects of various TPD programs on middle school students’ academic performance. The TPD programs in the literature reveal various formats in terms of learning environment (from on-site workshops to online courses), duration (from a few days to several weeks), teachers’ grade level (from elementary to middle school to high school), and engineering integration of other subjects (e.g., mathematics, science, or technology). However, these prior studies usually involved a small number of teachers and the results about the effects of the TPD on teachers were explanatory or not sufficiently examined. Thus, a large sample size and various approaches to evaluation would enable researchers to make sufficient inferences about the effects of the engineering TPD and provide support for teachers from various perspectives in thoughtful ways.
Daugherty (2009) identified the lack of research on the effective practice of TPD in K-12 engineering education and explored the components of effective TPD in secondary engineering education through a qualitative approach. From five case studies of TPD programs, the following themes emerged as common characteristics of good practice: TPD requires (a) a philosophy through which to approach student learning with engineering, (b) online support for the teachers, (c) self-selected or school identified teachers, (d) a model to integrate engineering into curriculum or lessons, (e) instructional strategies to scaffold problem solving or self-guided learning, and (f) instructors who have mastery skills in the content area.
While existing studies provide descriptions of the design of TPD (Cantrell et al., 2006), the effect on students (Mehalik et al., 2008a), a descriptive account for a several year-long process of TPD (Moskal et al., 2007), and common characteristics of good TPD practice (Daugherty, 2009), the studies produced qualitative and therefore more explanatory results with a small number of teachers. Studies that tie different TPD elements together, provide a systematic evaluation to identify effective elements of the TPD, and use a comprehensive model, have not been conducted, despite the formative and summative evaluations of reported programs. Our quantitative approach with a strong comprehensive model is meant to provide testable and generalizable results and a model for other TPD programs. This research study focuses on the first year of a five-year project in order to provide a manageable scope to develop and refine our model.
Theoretical Framework
The first level explores teachers’ reactions, like satisfaction with experiences. The second level assesses teachers’ learning, such as acquisition of new knowledge or instructional skills. The third level investigates the influence of the school or district, such as support and advocacy, and the fourth level examines changes in how teachers use new knowledge and skills. Finally, the fifth level assesses the final impact of the TPD on students, such as their learning outcomes, including their cognitive, affective, and behavioral changes in class.
Adopting Guskey’s (2003, 2005) framework, Newman (2010) hypothesized and tested a model (Figure 1) to examine the interactions among the five components using hierarchical linear modeling (HLM). Here, if TPD positively influences teachers’ perceptions about a topic, then teachers are motivated to learn the topic and subsequently increase their knowledge of the topic. Teachers’ increased knowledge directly improves their teaching practices, while administrative support interacts with teachers’ practices. Both teachers’ practices and administrative support are important factors that affect students’ performance in class.
Figure 1. Guskey’s (2003, 2005) teacher professional development evaluation model structured by Newman (2010, p. 5)
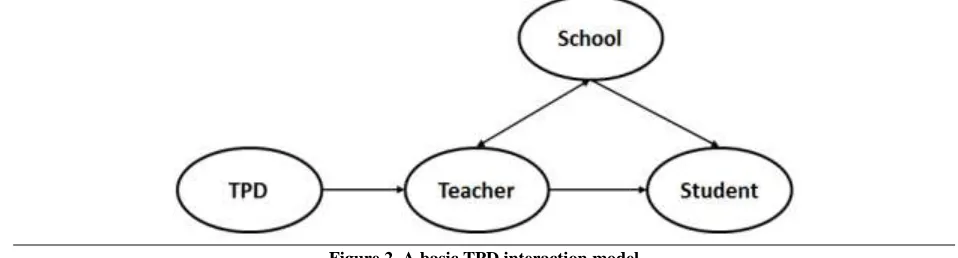
Although there is sufficient evidence that links the effect of TPD, via teacher practice, to students’ achievement (Wallace, 2009; Wenglinsky, 2002), the effect of TPD can vary due to other factors. For example, school characteristics (e.g., school size, location, and Title I status) can shape the effect of TPD (Yoon, Duncan, Lee, Scarloss, & Shapley, 2007). Thus, both teachers’ perceptions and practices and students’ perceptions and performance in class can be influenced by school characteristics. The interactions among school, teacher, and student can be modeled, as shown in Figure 2. While TPD directly influences teachers’ perceptions and practices, the effect of TPD on students’ performance is mediated by the teachers who interact with school. Here, school is an exogenous variable that affects both teachers’ and students’ perceptions and performance.
Figure 2. A basic TPD interaction model
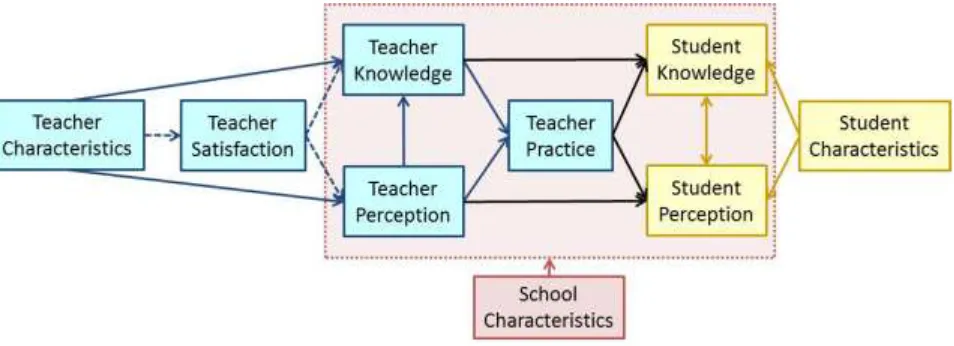
evaluation framework, INSPIRE’s evaluation framework is distinct in that both teachers’ and students’ knowledge and perceptions of engineering are considered in the model. The model also takes into account the influence of the characteristics of schools, teachers, and students. In Figure 3, each arrow presents the direction of the influence of one factor toward another. As a summative evaluation of the first year of the TPD program, the framework is designed to make explicit the associated relationships among schools, teachers, and students.
Figure 3. INSPIRE’s TPD evaluation framework grounded in Guskey’s (1998) professional development evaluation framework and Newman’s (2010) interaction model
PROJECT DESCRIPTION
This study is part of a five-year NSF funded research project focused on the attributes of elementary engineering TPD that support and sustain the integration of engineering for desired student achievement. Embedded in this focus are research questions about teachers’ knowledge, attitudes, and behaviors necessary for successful and sustained integration of engineering in elementary classrooms and the nature and evidence of desired student achievement as a result of integrating engineering in formal elementary education. This initial piece of the longitudinal study looks at the first-year teacher cohort in a single, very large school district to begin to construct a framework for investigating and understanding the relationships between the TPD as offered by INSPIRE on teachers’ knowledge of engineering and engineering education, perceptions (attitudes) of engineering and engineering education, and practice with elementary engineering (behaviors) and teacher and school characteristics. The inclusion of measures of teachers’ knowledge, attitudes, and behaviors was recommended by Lawless and Pellegrino (2007) to ensure a more systematic evaluation of TPD.
Engineering Teacher Professional Development
The INSPIRE began providing engineering TPD on the Purdue University campus for elementary teachers from across the country in 2006 (Lambert et al., 2007). The four stated goals for the Institute’s introductory week-long academies are to prepare teachers to (a) convey a broad perspective of the nature and practice of engineering; (b) articulate the differences and similarities between engineering and science thinking; (c) develop a level of comfort in discussing what engineers do and how engineers solve problems; and (d) use problem-solving processes (i.e. science inquiry, model development, and design processes) to engage P – 6th grade students in complex open-ended problem solving.
In detail, one district science specialist and three teachers who attended the 2007 on-campus INSPIRE academy provided logistical support throughout the week. Participants constructed working definitions of technology and engineering, learned about an engineering design process (EDP) through a short engineering design activity, and engaged in two Engineering is Elementary (EiE) units (Cunningham, 2004) and one model development activity. Participants maintained engineering notebooks in which they kept their work and reflections on the activities. All grade levels were provided development with one common EiE unit (“Catching the Wind: Designing Windmills”; Wind & Weather; Mechanical Engineering) and then each grade level focused on a different second unit that the district had committed to using in trained teachers’ classrooms. Grade 2 adopted “A Work in Process: Designing a Play Dough Process” (Solids & Liquids; Chemical Engineering), grade 3 adopted “Marvelous Machines: Making Work Easier” (Simple Machines; Industrial Engineering), and grade 4 adopted “Thinking Inside the Box: Designing a Plant Package” (Plants; Packaging Engineering). Special events were also provided during this academy. The Sunday night reception to get to know one another was held at a local restaurant, and an engineering tour was conducted at a manufacturing facility mid-week. A local university hosted and co-sponsored the K-12 and Engineering Education Dinner and provided panel speakers. The local university also provided a tour of their competitive automotive design facilities for university student teams. At the end of the academy, the teachers created and implemented an engineering activity for groups of local elementary students invited to attend an engineering day. During the school year, teachers were expected to deliver a “what is technology?” activity, a “what is engineering?” activity, an introduction to EDP lesson, and the four lessons contained in an adopted EiE unit.
METHODS
Teacher Recruitment
One school district located in south-central United States partnered with Purdue University researchers to provide TPD and measure its effect. Teachers of grades two through four across the school district were emailed an invitation to apply for the INSPIRE academy in teams of no fewer than four. INSPIRE sought input from the school district administration concerning schools they felt would be most able to fully participate in and benefit from elementary engineering TPD. Due to space considerations, enrollment was capped at 40.
Participants
Teams of four or five teachers from seven different schools in the district volunteered for the project and became the first cohort of the five-year project. Thirty-two teachers (including one instructional facilitator), who attended the one-week long on-school-site Summer Academy in 2008, implemented engineering lessons in their classrooms. Each teacher was assigned a classroom of between 14 to 23 students in the following school year.
Table 1. Characteristics of schools and teachers that participated in the first-year of TPD
Category Summer Academy Participation
School 7
Location Suburban 1
Urban 6
Size Small (650 students and below) 4
Large (Above 650 students) 3
Title I Status Schoolwide Title I 6
No schoolwide Title I 1
Teacher 32
Gender Female 29
Male 3
Ethnicity Black 4
Hispanic 2
White 24
Multiracial 2
Education Bachelor 24
Master’s or Ph.D. 8
Science Kit Yes 24
No 8
Teaching Grade 2 11
3 8
4 12
Facilitator 1
Instruments
To investigate the impact of TPD on teachers involved in the first year Summer Academy, four teacher surveys were utilized: (a) the engineering TPD evaluation survey (ETES), (b), the design process knowledge test (DPKT), (c) the design, engineering, and technology (DET) teacher survey, and (d) the Teacher Debrief. In addition, teacher demographic information was collected to identify teacher characteristics. Table 2 summarizes the characteristics of each instrument, and each instrument is briefly described below.
Table 2. Characteristics of the instruments used for elementary teachers in the first-year Summer Academy
Instrument Construct/Topic Items Scale Total Score Reliability
ETES
(Yoon et al., 2013)
Overall satisfaction with the engineering TPD
3 5-point Likert scale
3 rα = 0.78
Perceptions of engineering TPD effects on instructional strategies
7 7 rα = 0.92
DPKT
(Hsu et al., 2010)
Engineering Design Process Knowledge 2 Open-ended 8 —
DET
Teacher Survey (Hong et al., 2011)
Importance of DET 19 4-point
Likert scale
4 rα = 0.91
Familiarity with DET 8 4 rα = 0.81
Stereotypical Characteristics of Engineers
7 4 rα = 0.77
Barriers in Integrating DET 6 4 rα = 0.68
Teacher Debrief
Hours spent to implement engineering lessons
— — — —
Number of engineering activities employed — — — —
Engineering TPD Evaluation Survey (ETES). This survey was designed to examine teachers’ evaluation of the Summer Academy engineering TPD (Yoon, Kong, Diefes-Dux, & Strobel, 2013). The survey consists of ten 5-point Likert type items (very poor, poor, fair, good, and excellent) and seven open-ended questions. The ten Likert type items indicate two constructs: teachers’ overall satisfaction with the engineering TPD and teachers’ perceptions of the TPD effects on their instructional strategies. Seven open-ended questions inquired about teachers’ suggestions and comments regarding the program. For this study, only the ten Likert type items were analyzed.
Design process knowledge test (DPKT). The DPKT was designed to assess elementary school teachers’ knowledge of engineering design concepts and processes that could be implemented in classrooms (Hsu, Cardella, & Purzer, 2010). Given a description of how a person completed an engineering design task, teachers were asked to respond to two-open ended questions: (a) to identify the good parts of the person’s process and (b) to comment on how to improve the person’s process. Each teacher’s responses were coded to identify eight aspects (ask, imagine, plan, create, test, improve, time, and document) of the EDP. If a teacher showed sufficient evidence of understanding an aspect of the EDP, then one point was given. Thus, the total points indicate the level of a teacher’s understanding of the EDP.
Design, engineering, and technology (DET) teacher survey. Since its development and validation, the DET teacher survey (Yaşar et al., 2006) has been frequently used to assess K-12 teachers’ perceptions of and familiarity with engineering. The effect of TPD programs on engineering teaching can be measured in a pre-post fashion (High et al., 2009; Hsu, Purzer, & Cardella, 2011). The DET teacher survey, which was recently refined (Hong, Purzer, & Cardella, 2011), consists of 40 items rated with a four-point Likert scale (strongly disagree, disagree, agree, and strongly agree). Four aspects of teacher perceptions toward teaching DET are measured: (a) Importance of DET in students’ and teachers’ education, (b) Familiarity with DET in the teachers’ education, (c) Stereotypical Characteristics of Engineers (e.g. “A typical engineer has good verbal skills”, “…does well in science.”, “…works well with people.” , and (d) Barriers in Integrating DET in classroom. As the items were negatively presented, the scores for the last two items were reversed.
Teacher Debrief. After each engineering lesson was taught, teachers complete one of four debriefs depending on the type of lesson taught: (1) literacy and engineering – using a story or book to discuss engineers and engineering, (2) role of engineers, work of engineers and types of engineers, (3) scientific data and inquiry – using science investigations to gather data to inform a design solution, and (4) engineering design process (EDP) – solving design challenges. Teachers were to reflect upon their teaching practices and students’ performance. The debrief questions in the survey are a mix of 6-point Likert type questions and open-ended questions. With respect to Likert type questions, teachers rated their level of comfort in various aspects of teacher practice. Open-ended questions include information about the time spent on each EiE lesson and types of engineering activities delivered in class. From the latter part, the number of engineering activities taught during the academic year could be discerned.
Demographics. Teacher demographic information included gender, ethnicity, age, full time teaching experience in years, final degree, STEM background, and experience using science kits (e.g., FOSS, GEMS, RISE, and Sci-Tec). School information, such as school size, location, schoolwide Title I status, was collected through the school district website and the National Center for Educational Statistics (2012).
Procedures
Data Analyses
First, the data were explored to check outliers and assumptions for parametric tests (Field, 2009). Second, statistical methods were selected to answer each research question including: independent t-tests and paired-sample t-tests for parametric tests, and Mann-Whitney U tests and Kruskal-Wallis H tests for non-parametric tests to compare means. Third, effect sizes of the mean differences were obtained. For example, when comparing two means, a Hedges’ g effect size was calculated, which is an unbiased estimate, since a Cohen’s d effect size overestimates the magnitude of the difference in small samples. When comparing more than two means, partial η2 was calculated as a measure of effect size (Borenstein, Hedges, Higgins, & Rothestein, 2009). Fourth, correlation coefficients were obtained to examine putative associations among the observed variables.
RESULTS
Descriptive Statistics
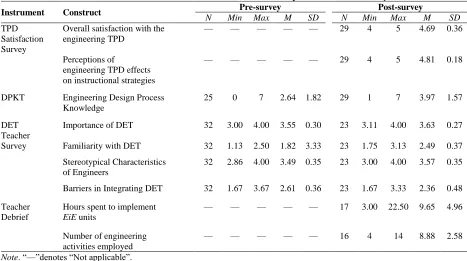
Table 3 presents an overview of the teacher responses for each measure. While 32 teachers attended the Summer Academy, the number of respondents on each survey varied because participation was voluntary; this resulted in marginal sample sizes for inferential statistics. On average, teachers showed positive effects of the engineering TPD on post-surveys, such as increased knowledge and positive changes in perceptions. The results from appropriate inferential statistics based on the sample sizes for pre-post comparisons are described below for each instrument.
Table 3. Means and standard deviations of teachers’ responses on teacher surveys
Instrument Construct Pre-survey Post-survey
N Min Max M SD N Min Max M SD
TPD Satisfaction Survey
Overall satisfaction with the engineering TPD
— — — — — 29 4 5 4.69 0.36
Perceptions of
engineering TPD effects on instructional strategies
— — — — — 29 4 5 4.81 0.18
DPKT Engineering Design Process Knowledge
25 0 7 2.64 1.82 29 1 7 3.97 1.57
DET Teacher Survey
Importance of DET 32 3.00 4.00 3.55 0.30 23 3.11 4.00 3.63 0.27
Familiarity with DET 32 1.13 2.50 1.82 3.33 23 1.75 3.13 2.49 0.37 Stereotypical Characteristics
of Engineers
32 2.86 4.00 3.49 0.35 23 3.00 4.00 3.57 0.35
Barriers in Integrating DET 32 1.67 3.67 2.61 0.36 23 1.67 3.33 2.36 0.48
Teacher Debrief
Hours spent to implement
EiE units
— — — — — 17 3.00 22.50 9.65 4.96
Number of engineering activities employed
— — — — — 16 4 14 8.88 2.58
Note. “—”denotes “Not applicable”.
Teachers’ Satisfaction with the Institution’s TPD Program
Changes in Teachers’ Knowledge and Perceptions Regarding Engineering
Paired-samples t-statistics revealed that teachers significantly increased their knowledge about the EDP (t(23) = 2.98, p = 0.01, Hedges’ g = 0.76) and perceptions of Familiarity with DET (t(22) = 7.54, p < 0.001, Hedges’ g = 1.95). However, no significant changes occurred in perceptions of Importance of DET (t(22) = 0.85, p = 0.41, Hedges’ g = 0.17), Stereotypical Characteristics of Engineers (t(22) = 1.10, p = 0.28, Hedges’ g = 0.26), and Barriers in Integrating DET (t(22) = -1.91, p = 0.07, Hedges’ g = -0.60). Figure 4 depicts that, as the effect of the engineering TPD, teachers acquired knowledge about the EDP and became more familiar with design, engineering, and technology. While teachers still possessed stereotypical images of engineers and perceived less difficulties in integrating engineering in class after the engineering TPD, these changes were not statistically significant.
Figure 4. Teachers’ knowledge and perceptions regarding engineering pre- and post-TPD.
DPKT scores were rescaled to half (e.g., 8 points to 4 points) to be on the same scale of the DET scores in the graph. Vertical lines indicate 95 % confidence interval of the means.
Variations in Teachers’ Knowledge and Perceptions by Teacher Characteristics
Due to the limited diversity among participants based on gender, ethnicity, and STEM career, we examined variations in teachers’ knowledge and perceptions by teachers’ education level (bachelor’s versus master’s or Ph.D.), teaching grade (grades 2, 3, and 4), and experience with science kits. Mann-Whitney U and Kruskal-Wallis H tests showed no significant differences in the teachers’ pre-knowledge based on their characteristics. Regarding the changes in teachers’ knowledge after the engineering TPD (differences between post-knowledge and pre-knowledge), no significant differences existed by their teaching grade and science kit experiences. However, teachers’ acquisition of the EDP knowledge significantly differed by their education level (U = 28.5, z = -2.00, p = 0.047, r = -0.41). The knowledge of teachers with a master’s degree or Ph.D. increased more than those with only a bachelor’s degree.
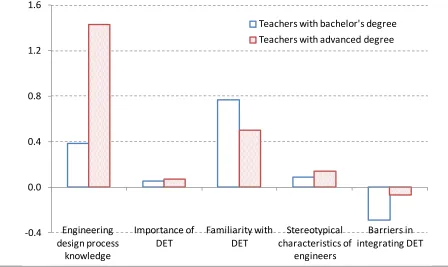
Regarding teachers’ pre-perceptions, Mann-Whitney U and Kruskal-Wallis H tests revealed no significant differences by their education level, teaching grade, and science kit experience. Teachers’ changes in perceptions after the engineering TPD did not differ by their characteristics either. Figure 5 depicts the changes in teachers’ knowledge and perceptions by their educational attainment as the effect of the engineering TPD. Here, DPKT scores
0 1 2 3 4 Engineering design process knowledge Importance of DET Familiarity with DET Stereotypical characteristics of engineers Barriers in integrating DET Le ve l o f A gr ee me n t (e .g ., 1= St ro n gl y D is gr ee ; 4 = St ro n gl y A gr ee )
Teacher Knowledge and Perceptions
Pre-survey
were rescaled to half (e.g., 8 points to 4 points) to be on the same scale as the DET scores in the graph. While teachers with advanced degrees (master’s or Ph.D.) gained more knowledge about the EDP, teachers with a bachelor’s degree became more familiar with DET and perceived less barriers in integrating DET in class. However, the changes were not statistically significant.
Figure 5. Changes in teachers’ knowledge and perceptions regarding engineering by their education level
Associations among Teachers’ Practice and Teachers’ Characteristics
Mann-Whitney U tests revealed no significant variations in the number of engineering activities delivered in class and the time spent on the EiE lessons by teachers’ education level and science kit experience. While Kruskal-Wallis H tests present no significant variations in the number of engineering activities delivered in class by teaching grade (H(2) = 1.18, p = 0.56), statistically significant differences existed in engineering lesson hours by teaching grade (H(2) = 8.19, p = 0.017). Post-hoc analyses using Mann-Whitney U tests revealed that third grade teachers spent significantly more time delivering EiE lessons than fourth grade teachers (U = 0.00, z = 2.45, p = 0.016, r = 0.82) (Figure 6).
-0.4 0.0 0.4 0.8 1.2 1.6
Engineering design process
knowledge
Importance of DET
Familiarity with DET
Stereotypical characteristics of
engineers
Barriers in integrating DET
Changes of Teacher Knowledge and Perceptions
Figure 6. Mean number of engineering activities and EiE lesson hours by teaching grade
Variations in Teacher Knowledge, Perceptions, and Practice by School Characteristics
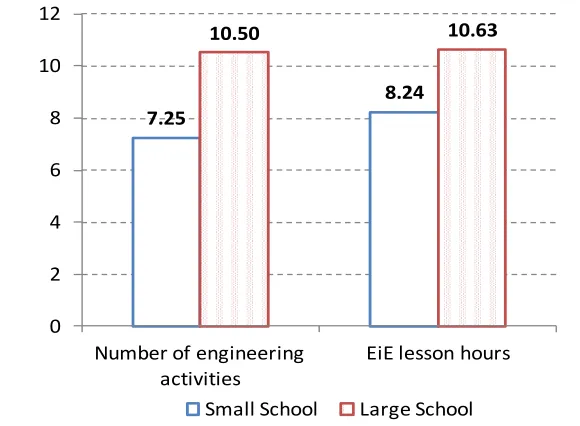
Due to the small sample size of each category for school location and Title I status, variations in teachers’ knowledge, perceptions, and practice were only examined by school size. Mann-Whitney U tests revealed that teachers had no variations in pre-knowledge and pre-perceptions regarding engineering by school size. Teachers’ increase in knowledge and changes in perceptions did not show any significant effect by school size. However, the number of engineering activities delivered in class significantly differed by school size with a large effect size (U = 8.00, z = 2.56, p = 0.010, r = 0.64). Teachers who taught in large schools delivered more engineering activities than ones in small schools (Figure 7). Regarding EiE lesson hours, on average, teachers in large schools spent more time than teachers in small schools, but the difference was not statistically significant by school size with a small effect size (U = 24.00, z = 1.074, p = 0.315, r = 0.26).
Figure 7. Number of engineering activities and EiE lesson hours by school size
9.57
8.97 8.00
13.73
8.75
5.90
0 2 4 6 8 10 12 14
Number of engineering activities
EiE lesson hours
Grade 2 Grade 3 Grade 4
7.25
8.24
10.50 10.63
0 2 4 6 8 10 12
Number of engineering activities
EiE lesson hours
DISCUSSION AND CONCLUSIONS
Using multiple measures with a pre- and post-survey research design, this study explores the direct effects of a week-long engineering TPD program on teachers’ integration of engineering lessons into their curriculum through the investigation into their engineering knowledge, attitudes (perceptions), and behaviors (practice). Based on INSPIRE’s TPD evaluation framework (Figure 3), we discuss the direct effects of the TPD on teachers followed by a discussion of variations in the effects of the TPD by teacher and school characteristics.
Direct Effects of Engineering TPD on Teachers
The engineering TPD was overall more meaningful and motivating than other TPD workshop experienced by these teachers. Teachers were very satisfied with the one-week long program provided by the Summer Academy, and the Summer Academy was highly rated. They also perceived that the engineering TPD would be beneficial to their instructional strategies. So, the INSPIRE Summer Academy provided teachers with a positive elementary engineering education experience. Teachers’ EDP knowledge was significantly increased, which can be considered a direct effect of the TPD. However, there was still room for improvement when considering the mean score, which is about half of the total possible score (Table 3). Thus, EDP content may need to be bolstered in follow-up TPD.
After participation in the week-long engineering TPD program, on average, teachers positively changed their perceptions of DET. However, statistical significance existed only for Familiarity with DET:teachers became more familiar with DET than before. Even though teachers’ perception of the Barriers in Integrating DET on average decreased, it was not significant. This slight drop may be attributed to a better understanding of what elementary engineering looks like. However, barriers were not explicitly addressed in the engineering TPD, partly because not enough was known about the district and schools to address barriers teachers would likely experience in their school contexts. This was a topic that was considered in follow-up TPD. On the pre-surveys, teachers strongly perceived the Importance of DET in education and highly agreed with the Stereotypical Characteristics of Engineers (which were phrased as positive views), which may explain why there were no significant changes after participation in the TPD; there was a ceiling effect of the scores. While this finding might be related to the characteristics of the teachers who volunteered for this study, the results are consistent with the results from the study by Hsu, Purzer, and Cardella (2011), in which elementary teachers with no engineering TPD experiences highly perceived the Importance of DET but had relatively low Familiarity with DET.
Effect of Teacher Characteristics
While teachers’ pre-knowledge and perceptions regarding engineering did not differ by teachers’ education level, teaching grade, and experience using science kits (Table 4), teachers with advanced degrees (master’s or Ph.D.) improved their EDP knowledge more than those with only a bachelors’ degree (Figure 5) suggesting the necessity of additional support for the latter teachers when designing an engineering TPD program. Teachers with advanced degrees, beyond a bachelor’s, likely increased their EDP knowledge more because they have more advanced pedagogical backgrounds to which the EDP can be related. If they can connect the EDP to things they already know and do in their classrooms, they are more likely to get more out of this TPD topic.
No significant variations existed in changes in teachers’ perceptions by their characteristics, indicating that the engineering TPD equally affected teachers’ perceptions of DET regardless of their characteristics. Teachers with advanced degrees might be more aware of systemic issues (e.g., state testing, district benchmarking, and future administrative changes) that could hinder the integration of DET. Thus, they seemed to have more limited changes in their perception of the Barriers in integrating DET compared to teachers with a bachelor’s degree.
No difference existed in the number of engineering activities delivered in class by teaching grade (Figure 6). This is not surprising as the teachers committed to deliver one technology lesson, one EDP lesson, and one EiE unit per year regardless of teaching grade.
Play Dough Process”; 6.58 ~ 8.08 hours for EiE unit, “Marvelous Machines: Making Work Easier”; and 6.92 ~ 8.08 hours for EiE unit, “Thinking Inside the Box: Designing a Plant Package.” However, on average, second and third grade teachers (8.97 hours and 13.73 hours, respectively) tended to spend more time than the proposed lesson time, while fourth grade teachers (5.90 hours) spent less time (Table 7). In general, the EiE lesson hours might depend on the age and preparation of the students doing each unit. In this study, the third grade teachers spent more time on their EiE unit. The third grade lessons may have included more difficult engineering concepts (i.e., simple machines) than the other grades. For the students in this study, the fourth grade EiE unit was likely a review of the science topic (plants); while the third grade lessons contained new and difficult concepts for third graders. It could also be that third grade teachers tried to teach simple machines through the EiE lessons rather than separately; this would make the lessons longer but more integrated with the science content.
Effect of School Characteristics
There was no significant effect of school size on teachers’ knowledge and perceptions, but teachers in large schools delivered more engineering lessons (often going beyond the expected lessons) than ones in small schools. This can be interpreted in various ways: (a) school support for the teachers might be different by school size; or (b) teachers in large schools might have more flexibility or freedom to deliver more engineering activities in class, particularly if they are departmentalized. Further research on the relationship between teacher practice with engineering and school size is suggested to see if this effect holds in other settings.
Student Impact
A conservative estimate is that the first cohort’s INSPIRE TPD impacted 500 students, at approximately16 students per classroom. However, it is likely that more than this number of students were impacted due to two engineering lesson implementation strategies. First, some schools departmentalize as early as third grade, meaning a single teacher may teach all students at their assigned grade level science, math, language arts, or social studies. So, some first cohort teachers taught engineering lessons to all students at their grade level which in these schools ranged between 75 and 125 students. Second, some teachers paired or grouped with non-INSPIRE trained teachers to teach the engineering lessons. For these teachers, their impact would be double or triple their own classroom enrollment. These implementation strategies were unanticipated in the first year of this longitudinal project and necessitated better tracking in subsequent years.
Overall, the one-week long engineering TPD was effective at improving the participating teachers’ EDP knowledge and changing their perceptions of integrating DET. Through these analyses, we could identify areas that were the most effective at increasing teachers’ EPD knowledge and changing teachers’ perceptions of engineering. Areas of the program that need to be strengthened to improve teachers’ performance at integrating engineering in their curriculum were also revealed.
Limitations and Future Studies
The first cohort teachers were self-selected, perhaps making them early adopters (Rogers, 1962). Findings might not be generalizable to teachers who may be classified as late-adopters or laggards - those more adverse to change. So, these findings need to be investigated with these latter groups.
Teacher practice was not directly observed but gathered indirectly through self-report in the Teacher Debriefs, so accuracy of the information might depend on teachers’ memory. Direct observation of teacher practice in class would guarantee richer and more accurate information about how teachers adopt particular strategies when integrating engineering and about the link between teacher practice and students’ performance in class.
A lot of questions regarding TPD remain in engineering education. Some examples of future research topics include: identification of the essential components of TPD to optimize the effectiveness of engineering TPD; investigation into best teacher practices for engineering education that are different from other subject areas; further examination of the effect of teacher and school characteristics on student achievement; and studies into how to improve teacher quality and effectiveness in teaching engineering and how to retain those qualified to sustain engineering integration.
Significance of the Study
Several points made this study are significant. First, areas that were the most impacted by of the engineering TPD were identified. Conversely, the results of this study to identify components that were not impactful could be used to enhance teachers’ knowledge and perceptions regarding engineering in the design of future TPD program. Second, potential factors of school and teacher characteristics that may influence the TPD effect on teachers were identified. Third, based on the research-based evidence of this study, policy makers/stake-holders could make research-based decisions with regards to support for K-12 engineering TPD programs (AERA, 2005). Thus, the results of this study are expected to contribute to the literature for K-12 engineering education.
ACKNOWLEDGEMENTS
This work was made possible by a grant from the National Science Foundation (DLR 0822261). Any opinions, findings, and conclusions or recommendations expressed in this material are those of the authors and do not necessarily reflect the views of the National Science Foundation.
AUTHOR INFORMATION
So Yoon Yoon, Institute for P-12 Engineering Research and Learning (INSPIRE), School of Engineering Education, Purdue University, 315 N. Grant Street West Lafayette, IN 47907-2023, USA. E-mail: [email protected] (Corresponding author)
Heidi Diefes-Dux, Institute for P-12 Engineering Research and Learning (INSPIRE), School of Engineering Education, Purdue University, 315 N. Grant Street West Lafayette, IN 47907-2023, USA. E-mail: [email protected]
Johannes Strobel, Institute for P-12 Engineering Research and Learning (INSPIRE), School of Engineering Education, Purdue University, 315 N. Grant Street West Lafayette, IN 47907-2023, USA. E-mail: [email protected]
REFERENCES
1. Achieve, Inc. (2013, February). The Next Generation Science Standards. Retrieved from http://www.nextgenscience.org
2. American Educational Research Association (AERA) (2005). Teaching teachers: Professional development to Improve student achievement. Research Points, 3(1), 1-4.
4. Brophy, S., Klein, S., Portsmore, M., & Rogers, C. (2008). Advancing engineering education in P-12 classrooms. Journal of Engineering Education, 97(3), 369-387.doi: 10.1002/j.2168-9830.2008.tb00985.x 5. Cantrell, P., Pekcan, G., Itani, A., & Velasquez-Bryant, N. (2006). The effects of engineering modules on student learning in middle school science classrooms. Journal of Engineering Education,95(4), 301-309. doi: 10.1002/j.2168-9830.2006.tb00905.x
6. Cunningham, C. M. (2004). Engineering is Elementary, Boston Museum of Science. Retrieved from http://www.mos.org/eie
7. Custer, R. L., & Daugherty, J. L. (2009). Professional Development for Teachers of Engineering: Research and Related Activities. The Bridge: Linking Engineering and Society, 39(3), 18-24.
8. Daugherty, J. L. (2009). Engineering professional development design for secondary school teachers: A multiple case study. Journal of Technology Education, 21(1), 10-24.
9. Duncan, D., Diefes-Dux, H.A., & Gentry, M. (2011). Professional development through engineering academies: An examination of elementary teachers’ recognition and understanding of engineering. Journal of Engineering Education,100(3), 520-539. doi: 10.1002/j.2168-9830.2011.tb00025.x
10. Field, A. (2009). Discovering Statistics Using SPSS. 3rd Ed. London: SAGE Publications Ltd. 11. Guskey, T.R. (1998). The age of our accountability: Evaluation must become an integral Part of staff
development. Journal of Staff Development, 19(4), 33-44.
12. Guskey, T. R. (2003). What makes professional development effective? Phi Delta Kappan, 84, 748-750. 13. Guskey, T. R. (2005). Taking a second look at accountability. Journal of Staff Development,26(1), 10-18. 14. High, K., Antonenko, P., Damron, R., Stansberry, S., Hudson, G., Dockers, J., & Peterson, A. (2009). The
effect of a teacher professional development integrated curriculum workshop on perceptions of design, engineering, and technology experiences. Proceedings of the American Society for Engineering Education Annual Conference and Exposition, Austin, TX.
15. Hong, T., Purzer, Ş, & Cardella, M. E. (2011). A psychometric re-evaluation of the Design, Engineering and Technology (DET) Survey. Journal of Engineering Education, 100(4), 800–818. doi: 10.1002/j.2168-9830.2011.tb00037.x
16. Hsu, M.-C., Cardella, M., & Purzer, S. (2010). Development of an instrument to assess elementary teachers’ design process knowledge: Findings from a pilot test. Proceedings of the American Society for Engineering Education Annual Conference and Exposition, Louisville, KY.
17. Hsu, M.-C., Purzer, S., & Cardella, M. E. (2011). Elementary teachers’ views about teaching design, engineering, and technology. Journal of Pre-College Engineering Education Research, 1(2), 31–39. doi: 10.5703/1288284314639.
18. Katehi, L., Pearson, G., & Feder, M. (Eds.). (2009). Engineering in K-12 education: Understanding the status and improving the prospects (Committee on K-12 Engineering Education, National Academy of Engineering and National Research Council). Washington, DC: National Academies Press.
19. Kirkpatrick, D. L. (1959). Techniques for evaluating training programs. Journal of the American Society of Training Directors, 13(3), 21-26.
20. Lambert, M., Diefes-Dux, H. A., Beck, M., Duncan, D., Oware, E., and Nemeth, R. J. (2007). What is engineering? – An exploration of P-6 grade teachers’ perspectives. Frontiers in Education Conference, Milwaukee, WI.
21. Lawless, K. & Pellegrino, J. (2007). Professional development in integrating technology into teaching and learning: Knowns, unknowns, and ways to pursue better questions and answers. Review of Educational Research, 77(4), 575-614.
22. Lee, J. & Strobel, J. (in press). Concerns and drivers of teachers integrating engineering into classrooms. In Strobel, J., Purzer, S., & Cardella, M. (Eds.) (in press). Engineering in pre-college settings: Research into practice. West Lafayette, IN: Purdue University Press.
23. Macalalag, A., Lowes, S., Guo, K., Tirthali, D., Mckay, M., & McGrath, E. (2010). Teacher professional development in grades 3-5: Fostering teachers’ and students’ content knowledge in science and engineering. Proceedings of the American Society for Engineering Education Annual Conference and Exposition, Louisville, KY.
25. Moskal, B. M., Skokan, C., Kosbar, L., Dean, A., Westland, C., Barker, H., Nguyen, Q. N., & Tafoya, J. (2007). K-12 outreach: Identifying the broader impacts of four outreach projects. Journal of Engineering Education, 96(3), 173-189. doi: 10.1002/j.2168-9830.2007.tb00928.x
26. National Center for Educational Statistics (2012). Numbers and types of public elementary and secondary schools from the common core of data: school year 2009-10 – Glossary. Retrieved from
http://nces.ed.gov/pubs2011/pesschools09/glossary.asp#s
27. National Research Council (NRC) (2011). A framework for K–12 science education: Practices, crosscutting concepts, and core ideas. Washington, DC: National Academies Press.
28. Newman, D. (2010). An empirical validation of Guskey’s professional development evaluation model using six years of student and teacher level reading data (Doctoral Dissertation, Cleveland State University). Retrieved from http://etd.ohiolink.edu/view.cgi?acc_num=csu1297108993
29. Rogers, E. M. (1962). Diffusion of Innovations. Glencoe: Free Press.
30. Wallace, M. R. (2009). Making sense of the links: Professional development, teacher practice, and student achievement. Teachers College Record, 111, 573-596.
31. Wenglinsky, H. (2002). How schools matter: The link between teacher classroom practices and student academic performance. Education Policy Analysis Archives, 10(2). Retrieved from
http://epaa.asu.edu/ojs/article/view/291
32. Yaşar, ¸ S., Baker, D., Robinson-Kurpius, S. R., Krause, S., & Roberts, C. (2006). Development of a survey to assess K-12 teachers’ perceptions of engineers and familiarity with teaching design, engineering, and technology. Journal of Engineering Education, 95(3), 205–216. doi: 10.1002/j.2168-9830.2006.tb00893.x 33. Yoon, K. S., Duncan, T., Lee, S. W-Y., Scarloss, B., & Shapley, K. S. (2007). Reviewing the Evidence on
How Teacher Professional Development Affects Student Achievement. Issues and Answers Report, REL 2007 – No. 033. Washington, D.C.: U.S. Department of Education, Institute of Education Sciences, National Center for Education Evaluation and Regional Assistance, Regional Educational Laboratory Southwest. Retrieved from http://ies.ed.gov/ncee/edlabs
34. Yoon, S. Y., Kong, Y., Diefes-Dux, H., & Strobel, J. (2013). K-8 teachers’ responses to their first