R E S E A R C H
Open Access
Development and validation of the
self-management profile for type 2 diabetes
(SMP-T2D)
Mark Peyrot
1*, Donald M Bushnell
2, Jennie H Best
3, Mona L Martin
2, Ann Cameron
3and Donald L Patrick
4Abstract
Background:This study evaluated the measurement properties of a newly developed instrument–the Self-Management Profile for Type 2 Diabetes (SMP-T2D).
Methods:The 18-item SMP-T2D assesses 12 constructs: level and perceived ease of performance in five self-care domains (blood glucose monitoring, medication-taking, healthy eating, being physically active, and coping), and two global constructs (ease of weight management, confidence with ability to manage diabetes). Validation analyses were based on two studies involving 240 patients with T2D, Study 1 (Clinicaltrials.gov #NCT00637273) with SMP-T2D administration supplemented by SMP-T2D retest one week later, and Study 2 (Clinical trials.gov
#NCT00877890) with SMP-T2D administration supplemented by 24-week SMP-T2D follow-up after medication change. Validation included clinical indicators and measures of patient reported quality of life, psychological well-being and treatment outcomes.
Results:All multi-item SMP-T2D measures showed acceptable internal consistency (alphas = 0.71 to 0.87); ten measures had test-retest reliability >0.75. Correlations among SMP-T2D measures and between SMP-T2D measures and validation measures, which were as hypothesized, provided evidence of convergent and discriminant validity. Scores for six SMP-T2D measures improved significantly during Study 2. Multiple regression analysis showed independent associations between change in SMP-T2D measures and change in trial outcomes from baseline to end-of-study.
Conclusions:Two studies provide preliminary evidence regarding the reliability, validity and responsiveness of the SMP-T2D. Further research on the utility of the instrument is needed.
Background
Type 2 diabetes mellitus can have substantial effects on patients’ physical and psychosocial well-being. People with diabetes, their families and health care providers, and health policymakers are interested in improving dia-betes outcomes, which requires both medical care and patient self-management. As such, the American Dia-betes Association (ADA) Standards of Medical Care has identified self-management education and ongoing sup-port as integral components of diabetes care, and recommends monitoring self-management behaviors in patients receiving treatment for diabetes [1].
Given the importance of patient self-management in the control of diabetes, evaluations of effectiveness in clinical trials of behavioral and pharmacologic treatments should include an assessment of diabetes self-manage-ment, augmenting physiological outcomes such as blood glucose and patient reported outcomes (PROs) such as health-related quality of life. Better self-management is expected to lead to improved glycemic control and better patient outcomes in weight management and diabetes-related distress. Therefore, we initiated a project to de-velop and validate a new patient self-report instrument, the Self-Management Profile for Type 2 Diabetes (SMP-T2D), which would assess multiple domains and dimen-sions of self-management and would be brief enough for use in clinical trials.
* Correspondence:[email protected]
1Department of Sociology, Loyola University Maryland, Baltimore, MD, USA Full list of author information is available at the end of the article
The US Food and Drug Administration (FDA) has provided guidance on the development of PRO instru-ments for use in evaluating medical products for labeling claims [2]. Data used for labeling claims must meet the most stringent standards and these standards define best practice. The FDA guidance requires documentation of patient input into instrument development, and the de-velopment of the SMP-T2D used patient input to assess the relevance of the concepts reflected in the instrument as well as patient comprehension and interpretation of individual items.
This paper reports the development of the SMP-T2D and the results of two studies evaluating the measure-ment properties of the SMP-T2D in the clinical trial setting.
Methods
Concept development
Concepts to be included in the SMP-T2D development process were based on a systematic review of the dia-betes self-management literature. The American Dia-betes Association and the American Association of Diabetes Educators (AADE) have developed standards for the provision and evaluation of diabetes self-management education and support [1,3]. These stan-dards identified seven domains (the AADE7) that are the essential components of self-management: physical ac-tivity, healthy eating, medication taking, blood glucose monitoring, problem solving, risk reduction, and coping (psychosocial adaptation) [4,5]. A self-administered questionnaire, the Diabetes Self-Management Assess-ment and Report Tool (D-SMART), was developed to assess the AADE7 [6-8].
The D-SMART was developed to provide a detailed assessment that could be used to guide comprehensive self-management education. But this instrument is too lengthy to be used in clinical trials of diabetes treatment medications. Of the seven AADE domains, two have less relevance to the clinical trial situation. Risk reduction involves efforts to prevent long-term complications, e.g., by having periodic tests and examinations, and actions such as vaccinations, prophylactic aspirin, foot checking, etc. Although important, these are not targets of dia-betes medication trials. Problem solving relates to deal-ing with situations that are likely to be covered by clinical trial protocols and/or to be managed by clini-cians on the research team. Therefore, these two domains were not included in the instrument develop-ment process.
The D-SMART also incorporates dimensions believed to be important in patient implementation of self-man-agement, including confidence in managing diabetes, barriers to self-care, and self-care goals. While patient goals are important in routine clinical care, in clinical
trials the goals are generally defined by the trial, and so the SMP-T2D was not designed to assess personal goals. The concept of barriers has been identified as an im-portant factor in self-management [6-10]. Instead of an inventory of barriers that includes multiple questions (as in the D-SMART), we focused on the consequences of barriers for patients, i.e., the degree to which barriers make it difficult to implement self-management. Self-management difficulty has been used as a way of measur-ing self-management performance [11]; this strategy recognizes that patients may implement self-management even though it is difficult, but the behavior is less likely to be sustained when it is difficult. Moreover, patients may be more willing to admit to having difficulty with self-management than to admit not implementing their pre-scribed regimen [12].
Self-efficacy has been viewed as a key construct in human behavior and was identified as another essential component in our measure of self-management [13,14]. Finally, in an effort to develop personalized weighting for the SMP-T2D measures, we included importance rat-ings for the five behavioral domains [15].
Following the identification of concepts from the exist-ing literature, we developed a focus group interview guide to assess the relevance of the identified concepts and to identify new concepts. Four focus groups were conducted with a total of twenty-four participants with type 2 diabetes. Participants had a diagnosis of diabetes ranging from 1.5 to 30 years, with an average of 11.2 years. Most participants (66.7%) had an A1c be-tween 7 and 11. Participants were taking either inject-able (n = 12) or oral (n = 12) diabetes medications. The specific medication regimens varied greatly among participants.
One of the authors (MM) developed an initial coding framework from the focus group transcripts that linked to the literature and existing knowledge about self man-agement. Next, two interviewers were trained to code concepts using this initial coding framework. After the first two transcripts were coded, ATLAS.ti software [16] was used to tag the assigned concept codes in each tran-script. Results were reviewed by the coding team, and revisions to the coding framework were made keeping the focus group data in mind. Saturation was reached after the third focus group, as no new concepts emerged.
Item generation and cognitive interviews
frequency of Medication Taking adherence (1 item), fre-quency of Eating Healthy (2 items), frefre-quency of Physical Activity (3 items), and consequences of Coping (2 items). Seven items measured the difficulty of performing the behaviors representing the five key AADE7 domains: Glucose Monitoring (1 item), Medication Taking (1 item), Eating Healthy (3 items), Physical Activity (1 item), and Coping (1 item). Two items measured more global constructs: difficulty with Managing Weight (1 item) and Confidence with Ability to Manage Diabetes (1 item).
The behavior measure for the concept of coping uses the same measurement logic as the D-SMART measure of coping [6], assessing the consequences of coping (i.e., amount of diabetes-related frustration and worry about future health) rather than coping behavior per se. Asses-sing coping behavior would require an inventory of ef-fective coping strategies that would be beyond the scope of a measure to be used in clinical trials. The Ease of Coping item specifically refers to “coping with frustra-tion and worry related to your diabetes.”
The “Ease of Managing Weight” was an outcome or
benefit not contained in the AADE7. The content sup-porting this item emerged during the qualitative phase of the project as highly relevant to patients. Since this concept is also identified in the ADA guidelines as an important aspect of diabetes self-management, it was included in the instrument.
During the development phase, an importance item (“How important is it for you right now to. . .”) was included for each of the five behaviors and ease of man-aging weight in order to assess the potential of deriving weights for each domain score.
Cognitive interviews [18] were conducted with 34 patients with type 2 diabetes to assess the comprehen-sion and interpretation of the draft instrument. The draft used in the validation studies incorporated revisions based on that process (see Appendix). Participants in the cognitive interviews had a diagnosis of diabetes ranging from 1 to 30 years, with an average of 10.7 years. Most participants (76.5%) had an A1c between 7 and 11. The specific medication regimens varied greatly among parti-cipants; 17 participants were using oral medications only, 16 participants were using injectable medications alone or in combination with oral medications, and one partici-pant was managing diabetes with diet and exercise.
Scoring
All SMP-T2D scores were transformed to a 0–100 scale, with equal increments between responses. Scoring was designed so that higher scores indicate better self-management (as a result, items rating “difficulty of. . .” are reverse scored and labeled as “ease of. . .”). Except for the Physical Activity behavior measure scores for domains that had more than a single item were
calculated as the mean of the available items. The meas-ure of Physical Activity behavior consists of 3 items, one each addressing light, moderate, and vigorous activity. Scoring followed the logic of the Rapid Assessment of Physical Activity (RAPA) [19], where respondents’scores are categorized into one of four levels of physical activ-ity: sedentary (0 = no days of vigorous or moderate ac-tivity, and less than 2 days of light activity); underactive, light activity (33.3 = no days of vigorous activity with 1– 2 days of moderate activity and/or 2 or more days of light activity); underactive, regular activity (66.7 = 1– 2 days of vigorous activity and/or 3–4 days of moderate activity); and active (100 = 3 or more days of vigorous activity and/or 5 or more days of moderate activity).
Participants and procedures for validation studies
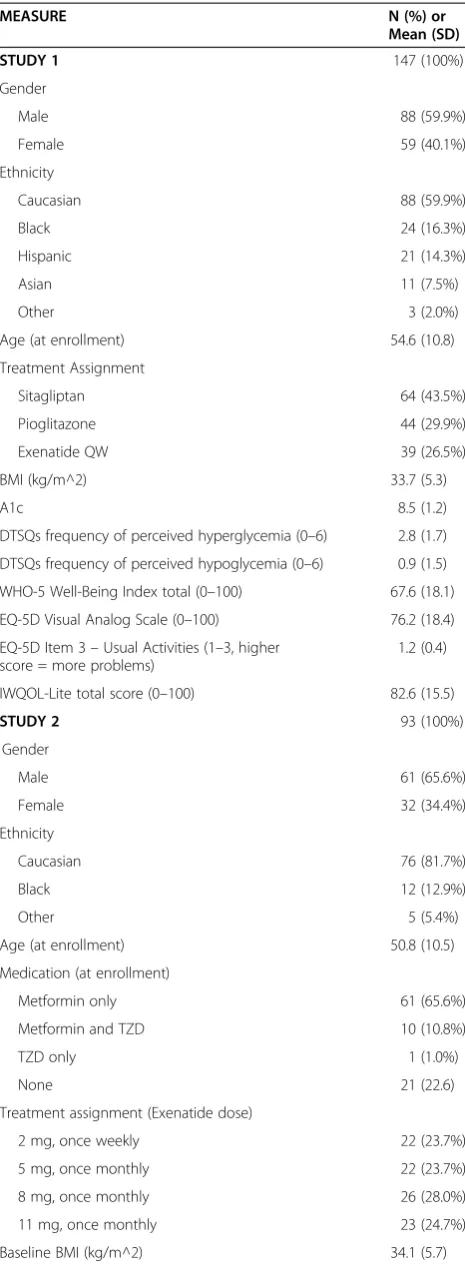
There were two validation studies; participant character-istics are reported in Table 1. In Study 1 the SMP-T2D was administered at the end of an ongoing clinical trial to evaluate its measurement properties. The parent trial was a randomized three-arm study designed to compare the effects of exenatide once weekly (QW) to sitagliptin and pioglitazone over 26-weeks [20,21]. Glucose moni-toring was not specified by protocol.
Participants were adults diagnosed with type 2 dia-betes and treated with metformin. A1c values at screen-ing could range between 6.5% and 10.5% with body mass index (BMI) ranging between 25 and 45 kg/m2. Partici-pants previously treated with other diabetes medications were excluded.
The Study 1 protocol was amended to include admin-istration of the SMP-T2D after some participants had already completed the 26-week controlled study; 147 of the 243 English-speaking participants who had not com-pleted the trial at 26 weeks were administered the SMP-T2D at week 26 (for cross-sectional validation) and week 27 (for reproducibility assessment). These 147 partici-pants comprise the study population for this study.
For Study 2 the parent trial was a randomized four-arm study designed to compare the effects of different doses of exenatide once weekly or once monthly [22]. Glucose monitoring was not specified by protocol. Parti-cipants were 93 adults diagnosed with type 2 diabetes, who either were not taking diabetes medication or were treated with metformin and/or thiazolidinedione. A1c values at screening could range between 7.1% and 11.0%, and body weight was stable for at least 3 months prior to screening.
Validation measures
the SMP-T2D retest in Study 1). These trials did not have parallel measures of the constructs assessed by the SMP-T2D (e.g., adherence, self-efficacy, barriers, etc.).
Clinical assessments in both studies included clinician-reported BMI and the biomarker A1c. In Study 1 five PRO construct validity instruments were administered.
EuroQoL-Five Dimensions (EQ-5D) [23]: the validation analyses used only the item measuring severity of pro-blems performing usual activities (which was treated as a set of ordered categories for analysis purposes) and the visual analog scale (VAS) measuring patients’ perceived health status, the former because it provides validation for physical activity domain and the latter because the VAS has greater sensitivity than the health utility index [24]. Impact of Weight on Quality of Life Questionnaire, Lite Version (IWQOL-Lite) [25]: the validation analyses used only the total score, ranging from 0 (low) to 100 (high).World Health Organization-Five Well-being Index (WHO-5) [26]: scores were standardized to a 0–100
range, with higher scores representing positive psycho-logical well-being.Diabetes Treatment Satisfaction Ques-tionnaire (Status Version, DTSQs) [27]: the validation analyses used only the items measuring perceived fre-quency of hypoglycemia and perceived frefre-quency of hyperglycemia. These DTSQs items were also used in Study 2.
All studies were approved by an Institutional Review Board and were conducted in accordance with ethical principles described in the Declaration of Helsinki.
Statistical analyses
All analyses were performed using the Statistical Package for the Social Sciences (SPSS), Release 11.5.0 [28].
Descriptive statistics
In addition to the mean and standard deviation for each SMP-T2D measure, the percentage of persons giving the minimum and maximum scores were used to determine floor and ceiling effects.
Table 1 Sample characteristics
MEASURE N (%) or
Mean (SD)
STUDY 1 147 (100%)
Gender
Male 88 (59.9%)
Female 59 (40.1%)
Ethnicity
Caucasian 88 (59.9%)
Black 24 (16.3%)
Hispanic 21 (14.3%)
Asian 11 (7.5%)
Other 3 (2.0%)
Age (at enrollment) 54.6 (10.8)
Treatment Assignment
Sitagliptan 64 (43.5%)
Pioglitazone 44 (29.9%)
Exenatide QW 39 (26.5%)
BMI (kg/m^2) 33.7 (5.3)
A1c 8.5 (1.2)
DTSQs frequency of perceived hyperglycemia (0–6) 2.8 (1.7)
DTSQs frequency of perceived hypoglycemia (0–6) 0.9 (1.5)
WHO-5 Well-Being Index total (0–100) 67.6 (18.1)
EQ-5D Visual Analog Scale (0–100) 76.2 (18.4)
EQ-5D Item 3–Usual Activities (1–3, higher score = more problems)
1.2 (0.4)
IWQOL-Lite total score (0–100) 82.6 (15.5)
STUDY 2 93 (100%)
Gender
Male 61 (65.6%)
Female 32 (34.4%)
Ethnicity
Caucasian 76 (81.7%)
Black 12 (12.9%)
Other 5 (5.4%)
Age (at enrollment) 50.8 (10.5)
Medication (at enrollment)
Metformin only 61 (65.6%)
Metformin and TZD 10 (10.8%)
TZD only 1 (1.0%)
None 21 (22.6)
Treatment assignment (Exenatide dose)
2 mg, once weekly 22 (23.7%)
5 mg, once monthly 22 (23.7%)
8 mg, once monthly 26 (28.0%)
11 mg, once monthly 23 (24.7%)
Baseline BMI (kg/m^2) 34.1 (5.7)
Table 1 Sample characteristics(Continued)
Baseline A1c 8.3 (1.1)
Baseline DTSQs perceived hyperglycemia 2.8 (1.9)
Baseline DTSQs perceived hypoglycemia 1.0 (1.3)
Change from baseline in BMI (kg/m^2) −0.4 (5.3)***
Change from baseline in A1c −1.2 (1.2)***
Change from baseline in DTSQs perceived hyperglycemia −1.1 (2.1)*** Change from baseline in DTSQs perceived hypoglycemia 0.2 (1.6)
Internal consistency reliability
For the measures that contained multiple items, Cronbach’s alpha [29] was used to assess the degree to which the set of items measured a single unidimensional latent construct. An alpha equal to or greater than 0.70 is defined as adequate internal consistency [30].
Test-retest reliability
The extent to which the SMP-T2D measures have stable scores over time in the absence of true change was assessed with two administrations of the SMP-T2D at a one-week interval where change was not expected. One test used the average Spearman-Brown coefficient; a co-efficient equal to or greater than 0.70 is defined as ad-equate test-retest reliability [30]. The t-test was used for the change in mean scores over time (represented in baseline standard deviation units to permit an assess-ment of effect size [31]); smaller change indicates greater reliability, and a difference of >0.5 standard deviation units indicates a minimum detectable difference [32].
Construct validity
Construct validity was assessed through correlations be-tween measures representing constructs that were hypothesized to be more strongly (convergent) or more weakly (discriminant) related according to a priori
expectations based on the theoretical relationships among constructs [33].
The first phase of validity analysis examined a correl-ation matrix of associcorrel-ations among the SMP-T2D mea-sures; this analysis was performed only for the Study 1 data because the Study 2 data was regarded as redun-dant. Measures for each of the five behaviors were pre-dicted to be more strongly associated with their corresponding measures of perceived ease than with other items that did not correspond with each other. Two more specific convergent/discriminant validity hypotheses were formulated: (1) Ease of Managing Weight will be more strongly associated with Ease of Eating Healthy and Ease of Physical Activity than with Ease of Medica-tion Taking Adherence and Ease of Glucose Monitoring, and the association with Ease of Coping would be inter-mediate; (2) Confidence with Ability to Manage Diabetes will be more strongly associated with Coping and Ease of Coping than with measures of behavior or perceived ease from other domains.
The second phase of validity analysis examined the associations between the SMP-T2D measures and the construct validity measures. All SMP-T2D measures were predicted to be positively associated with better scores on all construct validity measures. However, con-struct validity measures were predicted to be more strongly associated with lifestyle domains (Eating Healthy, Physical Activity and Coping) than with
medical domains (Medication Taking and Glucose Moni-toring); rationale– in a clinical trial setting, medication taking is constrained and the other factors are likely to have greater impact on outcomes, or to be affected by those outcomes. Moreover, construct validity measures were predicted to be more strongly associated with mea-sures of perceived ease of behavior than meamea-sures of be-havior frequency; rationale – ease of a behavior is a more sensitive indicator of the degree to which a behav-ior is performed and may be less subject to reporting bias due to social desirability (i.e., it is easier to admit to difficulty than non-adherence). Finally,construct validity measures were predicted to be more strongly associated with Coping measures, Confidence in Ability to Manage Diabetes and Ease of Managing Weight than with fre-quency and perceived ease of Medication Taking, Glucose Monitoring, Eating Healthy and Physical Activity; ration-ale – the former measures represent more global con-structs that incorporate multiple specific behavioral domains.
Ability to detect change
Ability of the instrument to detect change over time was assessed in Study 2. All Study 2 participants were chan-ging their medication and were included in the analyses. The first type of analysis assessed change in mean SMP-T2D scores over time. It was hypothesized that there would be improvement in the Eating Healthy and Coping measures, Ease of Managing Weight and Confidence in Ability to Manage Diabetes but not other SMP-T2D measures; rationale– the effects of exenatide are stron-gest for eating, weight and glycemic control [34] (the intervention did not target glucose monitoring or phys-ical activity, and patients switched from oral to injectable medication).
The second type of validity analysis assessed the asso-ciation between change in SMP-T2D scores and change in validation measures over the course of the study. Val-idity measures were predicted to be most strongly asso-ciated with the Coping measures, Confidence in Ability to Manage Diabetes and Ease of Managing Weight than with other measures; rationale – the former measures represent more global constructs that incorporate mul-tiple specific behavioral domains. BMI was predicted to be more strongly associated with dietary and physical ac-tivity measures than with measures of glucose monitoring and medication taking; rationale – weight is more dependent on caloric intake and expenditure than other self-management behaviors.
scores, controlling for the baseline value of the validity measure.
Results
The time needed to complete the SMP-T2D across patients ranged from 3 to 5 minutes. Readability analyses of the pre-final SMP-T2D were conducted in Microsoft WordW 2003 and showed a Flesch-Kincaid Grade Level score of 7.0.
Preliminary analysis of the six importance ratings in Study 1 showed all domains being equally “Very Important” and therefore these items were not examined further. These items were not included in Study 2.
Scaling
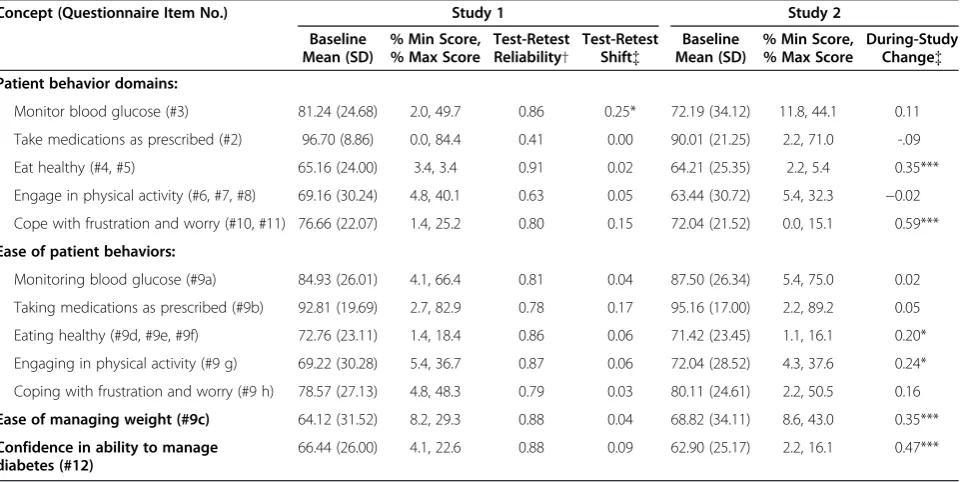
Means for SMP-T2D measures ranged between 62 and 97 across the two studies; only the Medication Taking fre-quency and ease measures had means above 85 (see Table 2). Floor effects were low, with a high of 11.8% having the minimum score for Glucose Monitoring behav-ior in Study 2 (interpolated median for both studies = 2.5%). Ceiling effects were more pronounced, with a high of 89.2% having the maximum score for Ease of Medica-tion Taking in Study 2 (interpolated median for non-medication domains in both studies = 33.0%).
Internal consistency
The SMP-T2D profile contains four multi-item mea-sures. Inter-item agreement for these measures was
assessed by alpha in Study 1 and Study 2. Alphas ranged from 0.71 to 0.87 (median = 0.80). (see Table 2).
Test-retest reliability
In Study 1, ten SMP-T2D measures had Spearman-Brown coefficients greater than 0.77 (see Table 2); reproducibility at 1 week ranged from 0.41 for Medication Taking behav-ior to 0.91 for Eating Healthy behavbehav-ior (interpolated me-dian = 0.83). Only one measure (Glucose Monitoring behavior) changed significantly across administrations; the effect size was 0.25 which is half the size of the minimum detectable difference [32].
Intercorrelations of SMP-T2D measures
Table 3 presents the associations within and between the domains of the SMP-T2D in Study 1. All convergent/ discriminant validity hypotheses internal to the instru-ment were confirmed. As expected, the corresponding ease and behavior measures had stronger associations than those that do not correspond; all corresponding measures but only 2 of 20 non-corresponding measures correlated at p < 0.001. Secondly, Ease of Managing Weight was more strongly associated with Ease of Eating Healthy and Ease of Physical Activity than with mea-sures of perceived ease from other domains. Finally, Confidence with Ability to Manage Diabetes was more strongly associated with consequences of Coping and Ease of Coping than with measures of behavior or per-ceived ease from other domains.
Table 2 SMP-T2D measurement model
Concept (Questionnaire Item No.) Study 1 Study 2
Baseline Mean (SD)
% Min Score, % Max Score
Test-Retest Reliability†
Test-Retest Shift{
Baseline Mean (SD)
% Min Score, % Max Score
During-Study Change{
Patient behavior domains:
Monitor blood glucose (#3) 81.24 (24.68) 2.0, 49.7 0.86 0.25* 72.19 (34.12) 11.8, 44.1 0.11
Take medications as prescribed (#2) 96.70 (8.86) 0.0, 84.4 0.41 0.00 90.01 (21.25) 2.2, 71.0 -.09
Eat healthy (#4, #5) 65.16 (24.00) 3.4, 3.4 0.91 0.02 64.21 (25.35) 2.2, 5.4 0.35***
Engage in physical activity (#6, #7, #8) 69.16 (30.24) 4.8, 40.1 0.63 0.05 63.44 (30.72) 5.4, 32.3 −0.02 Cope with frustration and worry (#10, #11) 76.66 (22.07) 1.4, 25.2 0.80 0.15 72.04 (21.52) 0.0, 15.1 0.59***
Ease of patient behaviors:
Monitoring blood glucose (#9a) 84.93 (26.01) 4.1, 66.4 0.81 0.04 87.50 (26.34) 5.4, 75.0 0.02
Taking medications as prescribed (#9b) 92.81 (19.69) 2.7, 82.9 0.78 0.17 95.16 (17.00) 2.2, 89.2 0.05
Eating healthy (#9d, #9e, #9f) 72.76 (23.11) 1.4, 18.4 0.86 0.06 71.42 (23.45) 1.1, 16.1 0.20*
Engaging in physical activity (#9 g) 69.22 (30.28) 5.4, 36.7 0.87 0.06 72.04 (28.52) 4.3, 37.6 0.24*
Coping with frustration and worry (#9 h) 78.57 (27.13) 4.8, 48.3 0.79 0.03 80.11 (24.61) 2.2, 50.5 0.16
Ease of managing weight (#9c) 64.12 (31.52) 8.2, 29.3 0.88 0.04 68.82 (34.11) 8.6, 43.0 0.35***
Confidence in ability to manage diabetes (#12)
66.44 (26.00) 4.1, 22.6 0.88 0.09 62.90 (25.17) 2.2, 16.1 0.47***
†Test-retest reliability measured by Spearman-Brown coefficient, 1-week reproducibility.
Convergent and discriminant validity
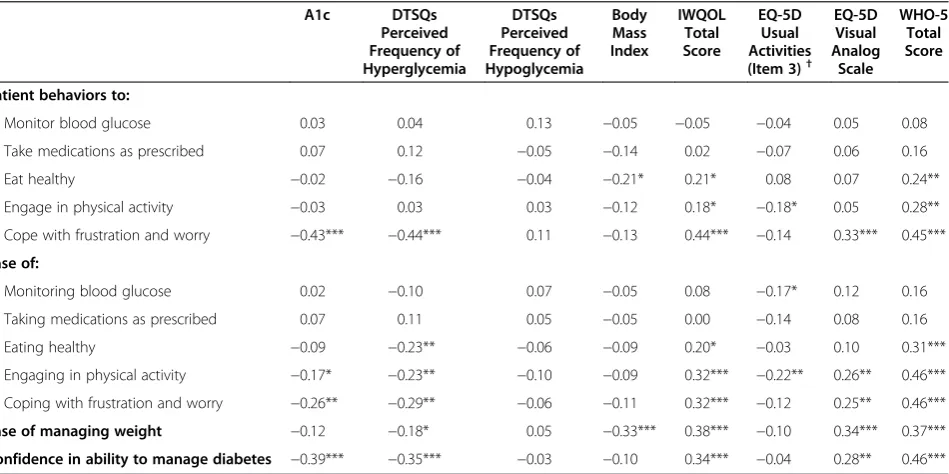
Table 4 presents the associations between baseline scores on the SMP-T2D measures and the construct val-idity measures in Study 1. All convergent/discriminant validity hypotheses were generally confirmed, although there were a few exceptions to each of the predicted pat-terns. Nine of twelve SMP-T2D measures were signifi-cantly associated with one or more validity measures and all significant associations were in the predicted direction.
As predicted, all construct validity measures were more strongly associated with measures from the lifestyle domains (frequency and perceived ease of Eating Healthy, Physical Activity and Coping) than with measures from the medical regimen domains (frequency and perceived ease of Medication Taking and Glucose Monitoring). And most construct validity measures were more strongly asso-ciated with frequency and Ease of Coping than with fre-quency and perceived ease of Eating Healthy and Physical Activity. Additionally, with few exceptions all validity Table 3 Correlations among SMP-T2D Measures in Study 1
Patient behaviors to: Ease of: Ease of
managing weight
Confidence in ability to manage
diabetes Monitoring
blood glucose
Taking medications as prescribed
Eating healthy
Engaging in physical
activity
Coping with frustration and worry
Monitor blood glucose 0.40*** 0.28** 0.06 0.03 0.09 0.09 0.09
Take medications as prescribed 0.24** 0.29*** 0.13 0.14 0.18* 0.19* 0.21*
Eat healthy 0.15 0.05 0.35*** 0.28** 0.20* 0.28** 0.28*
Engage in physical activity −0.02 0.08 0.05 0.40*** 0.11 0.03 0.10
Cope with frustration and worry 0.26** 0.13 0.36*** 0.34*** 0.69*** 0.34*** 0.63***
Ease of Managing Weight 0.18* 0.20* 0.57*** 0.45*** 0.40*** 1.00 0.36***
Confidence in ability to manage diabetes 0.27** 0.21* 0.35*** 0.38*** 0.63*** 0.36*** 1.00
* Correlation is significant at the 0.05 level (2-tailed). ** Correlation is significant at the 0.01 level (2-tailed). *** Correlation is significant at the 0.001 level (2-tailed).
Table 4 Validity correlation matrix from Study 1
A1c DTSQs
Perceived Frequency of Hyperglycemia
DTSQs Perceived Frequency of Hypoglycemia
Body Mass Index
IWQOL Total Score
EQ-5D Usual Activities (Item 3)†
EQ-5D Visual Analog
Scale
WHO-5 Total Score
Patient behaviors to:
Monitor blood glucose 0.03 0.04 0.13 −0.05 −0.05 −0.04 0.05 0.08
Take medications as prescribed 0.07 0.12 −0.05 −0.14 0.02 −0.07 0.06 0.16
Eat healthy −0.02 −0.16 −0.04 −0.21* 0.21* 0.08 0.07 0.24**
Engage in physical activity −0.03 0.03 0.03 −0.12 0.18* −0.18* 0.05 0.28**
Cope with frustration and worry −0.43*** −0.44*** 0.11 −0.13 0.44*** −0.14 0.33*** 0.45***
Ease of:
Monitoring blood glucose 0.02 −0.10 0.07 −0.05 0.08 −0.17* 0.12 0.16
Taking medications as prescribed 0.07 0.11 0.05 −0.05 0.00 −0.14 0.08 0.16
Eating healthy −0.09 −0.23** −0.06 −0.09 0.20* −0.03 0.10 0.31***
Engaging in physical activity −0.17* −0.23** −0.10 −0.09 0.32*** −0.22** 0.26** 0.46***
Coping with frustration and worry −0.26** −0.29** −0.06 −0.11 0.32*** −0.12 0.25** 0.46***
Ease of managing weight −0.12 −0.18* 0.05 −0.33*** 0.38*** −0.10 0.34*** 0.37***
Confidence in ability to manage diabetes −0.39*** −0.35*** −0.03 −0.10 0.34*** −0.04 0.28** 0.46*** Note: A1c, glycated hemoglobin; WHO-5, World Health Organization-Five Well-Being Index; EQ-5D, EuroQoL-Five Dimensions; DTSQs, Diabetes Treatment Satisfaction Questionnaire-Status Version; IWQOL, Impact Of Weight On Quality Of Life-Lite.
†EQ-5D item 3 (Usual Activities) used here is scored so that a higher score represents more severe problems. * Correlation is significant at the 0.05 level (2-tailed).
measures were more strongly associated with perceived ease of behavior than measures of behavior frequency. Fi-nally, most construct validity measures were more strongly associated with Confidence in Ability to Manage Diabetes and Ease of Managing Weight than with fre-quency and perceived ease of Medication Taking, Glucose Monitoring, Eating Healthy and Physical Activity.
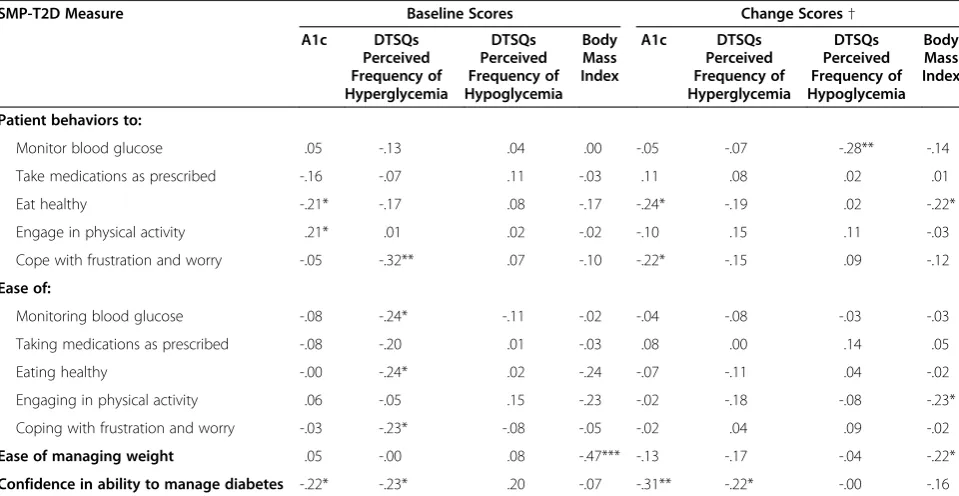
Eight SMP-T2D measures were significantly associated with one or more validity measures and all significant associations were in the predicted direction (see Table 5). For the four validity measures in common between Study 1 and 2, there was an 81% between-study con-cordance for statistical significance/non-significance of correlations with the SMP-T2D measures.
Ability to detect change
In Study 2 six of twelve SMP-T2D measures showed during-study improvement (see Table 2). As hypothe-sized, SMP-T2D measures relating to eating and weight, coping and confidence in managing diabetes exhibited statistically significant improvements (the only exception was Ease of Coping). Two measures (consequences of Coping behavior and Confidence in Managing Diabetes) had effect sizes near or above the 0.50 cut-off for a min-imal detectable difference [32].
In Study 2, improvements in six SMP-T2D measures were associated with improvement in a trial outcome;
none were associated with deterioration in an outcome (see Table 5).
Stepwise regression analysis of the change scores for each of the 4 validity measures assessed the independent relationships with change scores for the SMP-T2D mea-sures, controlling for the baseline value of the validity measure. Change in Confidence in Managing Diabetes (beta = −0.27, p < 0.01) and Eating Healthy behavior (beta =−0.20, p < 0.05) accounted for 11.5% of the vari-ance in change in A1c. Change in Physical Activity be-havior and Glucose Monitoring bebe-havior accounted for 11.2% of the variance in change of perceived frequency of hypoglycemia; these factors had offsetting effects, with increased physical activity associated with increased hypoglycemia (beta = 0.23, p < 0.05) and increased Glu-cose Monitoring associated with reduced hypoglycemia (beta = −0.29, p < 0.01). Change in Confidence in Man-aging Diabetes (beta =−0.16, p < 0.05) accounted for 5.2% of the variance in change of perceived frequency of hyper-glycemia. Change in Ease of Physical Activity (beta =
−0.23, p < 0.05) accounted for 2.5% of the variance in change in BMI.
Discussion
Development of the SMP-T2D incorporated self-management concepts that patients with type 2 diabetes expressed as important in their experience with diabetes
Table 5 Validity correlation matrix from Study 2
SMP-T2D Measure Baseline Scores Change Scores†
A1c DTSQs Perceived Frequency of Hyperglycemia
DTSQs Perceived Frequency of Hypoglycemia
Body Mass Index
A1c DTSQs Perceived Frequency of Hyperglycemia
DTSQs Perceived Frequency of Hypoglycemia
Body Mass Index
Patient behaviors to:
Monitor blood glucose .05 -.13 .04 .00 -.05 -.07 -.28** -.14
Take medications as prescribed -.16 -.07 .11 -.03 .11 .08 .02 .01
Eat healthy -.21* -.17 .08 -.17 -.24* -.19 .02 -.22*
Engage in physical activity .21* .01 .02 -.02 -.10 .15 .11 -.03
Cope with frustration and worry -.05 -.32** .07 -.10 -.22* -.15 .09 -.12
Ease of:
Monitoring blood glucose -.08 -.24* -.11 -.02 -.04 -.08 -.03 -.03
Taking medications as prescribed -.08 -.20 .01 -.03 .08 .00 .14 .05
Eating healthy -.00 -.24* .02 -.24 -.07 -.11 .04 -.02
Engaging in physical activity .06 -.05 .15 -.23 -.02 -.18 -.08 -.23*
Coping with frustration and worry -.03 -.23* -.08 -.05 -.02 .04 .09 -.02
Ease of managing weight .05 -.00 .08 -.47*** -.13 -.17 -.04 -.22*
Confidence in ability to manage diabetes -.22* -.23* .20 -.07 -.31** -.22* -.00 -.16
Note: A1c, glycated hemoglobin; DTSQs, Diabetes Treatment Satisfaction Questionnaire-Status Version. †Partial correlations controlling for baseline level of validity measure.
and its treatment. The specific items included in the SMP-T2D were generated using language as close as possible to that used by patients. Patients indicated a high level of understanding of the questionnaire items in cognitive interviews before the psychometric properties were assessed. This developmental process provides sup-port for the content validity of the SMP-T2D and justifi-cation for the conceptual framework.
The results of the validation studies provide prelimin-ary support for the reliability and validity of the SMP-T2D. Internal consistency for multiple-item measures was acceptable and test-retest reliability was adequate for all but two measures. The unexpected low test-retest reliability for the frequency of medication taking meas-ure (days missed of prescribed diabetes medications dur-ing the past week) could be explained by the lack variability due to the clinical trial treatment context. The majority of participants adhered to their medication regimen, allowing outliers to skew the reliability esti-mate. This item should be retained for further research within later phase studies in which patient medication taking behavior is not as tightly controlled.
The modest test-retest reliability of the measure of physical activity behavior is surprising as the measure of time-specific reliability (inter-item agreement) was good. This may be due to the fact that the composite measure uses thresholds rather than continuous increments of the component items so that small changes in activity could yield substantial changes in scores. It is likely that physical activity varies for most people in the short term (e.g., on a daily basis), and the measurement of physical activity using threshold activity levels requires a longer reference time period in order to stabilize short-term fluctuations in behavior.
Construct validity hypotheses were generally supported, with correlation patterns as expected, but with correla-tions no more than moderate in strength. The most inter-esting findings emerged from the correlations between SMP-T2D measures and the construct validation mea-sures. Validity measures were more strongly correlated with ease of performing self-management behaviors than with frequency of performing the same behaviors. This suggests that ease/difficulty is a more sensitive measure of self-management or that patients are more willing to admit to having difficulty with self-management than to admit not implementing their prescribed regimen. The one exception was for coping, but this may be because coping behavior was measured as the consequences of coping rather than the frequency of coping behavior.
The strongest findings regarding validity were obtained from the longitudinal analyses. Change in SMP-T2D measures was moderately associated with change in the validity measures, as predicted. In particular, multiple SMP-T2D measures predicted change in A1c and
perceived frequency of hypoglycemia. Perhaps the most interesting finding was that two SMP-T2D measures were related to change in hypoglycemia in opposite directions; increased physical activity increased hypoglycemia and increased glucose monitoring lowered hypoglycemia.
The importance rating items did not yield any clear evidence of any one domain being more important than another; rather, all domains were deemed very to ex-tremely important. Results may also reflect the selection of respondents into a clinical trial, as participants are likely to be those with a strong belief in the importance of treatment. Importance might be considered for fur-ther testing and inclusion in observational or non-clinical trials, as variations in patient beliefs about the importance of performing various regimen behaviors may be useful in informing clinical practice. Also, the measurement approach might be modified so that respondentsrank order the importance of behaviors ra-ther thanratethem in order to increase discrimination.
Study strengths and limitations
One of the strengths of the research reported here is that it involved multiple independent studies. Following FDA guidance, there was an initial study to obtain patient in-put about the measures to be included to represent the key domains, and cognitive debriefing provided patient input about item content/wording. Then an initial valid-ation study generated informvalid-ation about psychometrics and was used to select final items for inclusion in the ver-sion used to assess sensitivity to change and predictive validity.
Limitations of the research reported here include the fact that participants in clinical trials tend to differ from the larger patient population in a number of ways. More-over, neither of the validation studies was designed specif-ically for validation of the SMP-T2D (e.g., parallel measures of the SMP-T2D constructs were not used, re-ducing the size of validation correlations). A trial that attempted to change behavior in specific self-management domains (e.g., comparing usual care with an intervention designed to improve healthy eating or physical activity) might have provided a more rigorous test of the ability of the SMP-T2D to detect changes in behavior. Alternatively, a longitudinal observational study might have provided a better opportunity for testing the association between changes in SMP-T2D assessments of medication taking behavior and clinical outcomes.
(avoidance of hypoglycemia) [34,35]. Incorporating these dimensions into the SMP-T2D would broaden its applic-ability and could enhance its potential value as a re-search and clinical tool.
Conclusions and implications
The psychometric performance of the SMP-T2D in these trial-based analyses suggests that it could be an import-ant addition to the compendium of instruments used to assess diabetes self-management and its contribution to treatment outcomes. It was quickly completed by patients reading at a seventh grade level and its inclu-sion in the clinical trials had minimal impact on trial management.
The SMP-T2D was developed for use in clinical trials; although generalizability outside clinical trials has yet to be determined a potential strength of the instrument is that the SMP-T2D concepts are also relevant in observa-tional research. The SMP-T2D also might have potential as a discussion tool to improve communication between patients and clinicians in choosing and implementing treatment regimens.
Appendix 1
Content of the Self-Management Profile for Type 2 Diabetes(SMP-T2D)
1. How many days during the past week (last 7 days) did you miss taking your diabetes medications as prescribed? {0–7, reverse scored}
2. How many days during the past week (last 7 days) did you miss monitoring your blood sugar? {0–7, reverse scored}
3. How many days during the past week (last 7 days) did you eat foods not healthy for your diabetes? {0–7} 4. During the past week (last 7 days), how many days
did you eat more food than you were supposed to? {0–7, reverse scored}
5. How many days during the past week (last 7 days), did you do at least some light physical activity (such as walking, light gardening)? {0–7}
6. How many days during the past week (last 7 days), did you do at least 30 minutes of moderate physical activity (such as pushing a vacuum cleaner, riding a bicycle, playing golf )? {0–7}
7. How many days during the past week (last 7 days), did you do at least 20 minutes of vigorous physical activity (such as running or participating in strenuous sports)? {0–7}
8. During the past week, how much difficulty did you have with: {A great deal, A lot, Moderate, A little, No}
a. monitoring your blood sugar?
b. giving yourself your diabetes medications as your doctor instructed?
c. managing your weight? d. periods of uncontrolled eating? e. feeling hungry?
f. food cravings?
g. being physically active?
h. coping with frustration and worry related to your diabetes?
9. During the past week (last 7 days), how frustrated have you been with trying to manage your diabetes? {Not at all, Slightly, Moderately, Very, Extremely}
10. During the past week (last 7 days), how worried have you been about your future health because of your diabetes? {Not at all, Slightly,
Moderately, Very, Extremely}
11. Overall, how confident have you felt during the past week (last 7 days) about being able to manage your diabetes? {Not at all, Slightly, Moderately, Very, Extremely}
12. How important is it for you right now to: {Lot, Moderate, Little, No}
a. monitor your blood sugar?
b. take your diabetes medications as your doctor instructed?
c. manage your weight? d. manage your diet?
e. manage your physical activity?
f. manage frustration and worry related to your diabetes?
NOTE: Question 12 was not included in the version of the SMP-T2D used in Study 2.
Competing interests
This work was supported by Amylin Pharmaceuticals, Inc., San Diego, CA. DMB, MLM, MP and DLP have received funding from Amylin
Pharmaceuticals, Inc. JHB and AC are employees of Amylin Pharmaceuticals, Inc. DLP has received honoraria from Amylin Pharmaceuticals, Inc. for participating in the development of the instrument, analysis of the data and preparation of this manuscript. MP has received honoraria from Amylin Pharmaceuticals, Inc. for participating in the analysis of the data and preparation of this manuscript.
Authors’contributions
Acknowledgements
The authors thank Richard Rubin and William Polonsky for comments on previous versions of the SMP-T2D and this manuscript. Funding for this research and manuscript was provided by Amylin Pharmaceuticals, Inc.
Author details
1Department of Sociology, Loyola University Maryland, Baltimore, MD, USA. 2
Health Research Associates, Inc, Mountlake Terrace, WA, USA.3Amylin Pharmaceuticals, Inc, San Diego, CA, USA.4Seattle Quality of Life Group, Department of Health Services, University of Washington, Seattle, WA, USA.
Received: 9 February 2012 Accepted: 22 September 2012 Published: 5 October 2012
References
1. Funnell MM, Brown TL, Childs BP, Haas LB, Hosey GM, Jensen B, Maryniuk M, Peyrot M, Piette JD, Reader D, Siminerio LM, Weinger K, Weiss MA:National standards for diabetes self-management education.Diabetes Care2007,
30:1630–1637.
2. US Dept. of Health and Human Services Food and Drug Administration: Guidance for Industry - Patient-Reported Outcome Measures: Use in Medical Product Development to Support Labelling Claims.; 2009. http://www.fda.gov/ downloads/Drugs/GuidanceComplianceRegulatoryInformation/Guidances/ UCM193282.pdf.
3. Mulcahy K, Maryniuk M, Peeples M, Peyrot M, Tomky D, Weaver T, Yarborough P:Diabetes self-management education core outcomes measures: Technical review.Diabetes Educ2003,29:768–803. 4. Mulcahy K, Maryniuk M, Peeples M, Peyrot M, Tomky D, Weaver T,
Yarborough P:AADE position statement - standards for outcomes measurement of diabetes self-management education.Diabetes Educ 2003,29:804–816.
5. Tomky D, Cypress M, Dang D, Maryniuk M, Peyrot M, Mensing C:AADE position statement: AADE 7 self-care behaviors.Diabetes Educ2008,
34:445–449.
6. Peyrot M, Peeples M, Tomky D, Charron-Prochownic D, Weaver T:
Development of the American Association of Diabetes Educators’ Diabetes Self-Management Assessment Report Tool.Diabetes Educ2007,
33:818–826.
7. on behalf of the Diabetes Education Outcomes Project Team, Charron-Prochownik D, Zgibor JC, Peyrot M, Peeples M, McWilliams J, Koshinsky J, Noullet W, Siminerio LM:The Diabetes Self-Management Assessment Report Tool (D-SMART): Process evaluation and patient satisfaction.
Diabetes Educ2007,33:833–839.
8. on behalf of the Diabetes Education Outcomes Project Team, Zgibor JC, Peyrot M, Ruppert K, Noullet W, Siminerio LM, Peeples M, McWilliams J, Koshinsky J, DeJesus C, Emerson S, Charron-Prochownik D:Using the AADE outcomes system to identify patient behavior change goals and diabetes educator responses.Diabetes Educ2007,33:840–843.
9. Toobert DJ, Hampson SE, Glasgow RE:The Summary of Diabetes Self-care Activities Measure.Diabetes Care2000,23:943–950.
10. Glasgow RE, McCaul KD, Schafer LC:Barriers to regimen adherence among persons with insulin-dependent diabetes.J Behav Med1986,
9:65–77.
11. Heisler M, Smith DM, Hayward RA, Krein SL, Kerr EA:How well do patients' assessments of their diabetes self-management correlate with actual glycemic control and receipt of recommended diabetes services?
Diabetes Care2003,26:738–743.
12. Peyrot M, Rubin RR:Behavioral and psychosocial interventions in diabetes: A conceptual review.Diabetes Care2007,30:2433–2440. 13. Wallston KA, Rothman RL, Cherrington A:Psychometric properties of the
perceived diabetes self-management scale (PDSMS).J Behav Med2007,
30:395–401.
14. Anderson RM, Funnell MM, Fitzgerald JT, Marrenero DG:The Diabetes Empowerment Scale.Diabetes Care2000,23:739–743.
15. Trauer T, Mackinnon A:Why are we weighting? The role of importance ratings in quality of life measurement.Qual Life Res2001,10:579–585. 16. Muhr T:Atlas.ti computer aided text interpretation and theory building. User's
manual. Berlin: Scientific Software Development; 1994. 17. Jenkins CR, Dillman DA:Towards a theory of self-administered
questionnaire design. InSurvey measurement and process quality. Edited by
Lyberg LE, Biemer P, Collins M, DeLeeuw E, Dippo C, Schwarz N. New York: John Wiley and Sons; 1997:165–196.
18. Willis G:Cognitive Interviewing: A How-to guide. National Cancer Institute: Guides and reports for questionnaire design and testing; 1999. 19. Topolski TD, LoGerfo J, Patrick DL, Williams B, Walwick J, Patrick MB:The
Rapid Assessment of Physical Activity (RAPA) among older adults.Prev Chronic Dis2006,3:1–8.
20. DURATION-2 Study Group, Bergenstal RM, Wysham C, MacConell L, Malloy J, Walsh B, Yan P, Wilhelm K, Malone J, Porter LE:Efficacy and safety of exenatide once weekly versus sitagliptin or pioglitazone as an adjunct to metformin for treatment of type 2 diabetes (DURATION-2): a randomised trial.Lancet2010,376:431–439.
21. Best JH, Rubin RR, Peyrot M, Yan P, Malloy J, Garrison LP:Weight-related quality of life, health utility, psychological well-being, and satisfaction with exenatide once weekly compared to sitagliptin or pioglitazone after 26 weeks of treatment.Diabetes Care2011,34:314–319.
22. MacConell L, Malloy J, Huang W, Cirincione B, Shen L, Porter L:Safety and efficacy of once monthly exenatide administration over 20 weeks in patients with type 2 diabetes.Diabetologia2011,54(Supp 1):S38. 23. Kind P:The EuroQol instrument: an index of health-related quality of life.
InQuality of life and pharmacoeconomics in clinical trials. 2nd edition. Edited by Spilker B. Philadelphia: Lippincott-Raven Publishers; 1996:191–201. 24. Peyrot M, Rubin RR, Chen X, Frias JP:Associations between improved
glucose control and patient reported outcomes after initiation of insulin pump therapy in patients with type 2 diabetes mellitus.Diabetes Technol Ther2011,13:471–476.
25. Kolotkin RL, Crosby RD, Kosloski KD, Williams GR:Development of a brief measure to assess quality of life in obesity.Obes Res2001,9:102–111. 26. Bech P:Measuring the dimensions of psychological general well-being
by the WHO-5.QoL Newsletter2004,32:15–16.
27. Bradley C:Diabetes treatment satisfaction questionnaire (DTSQ). In Handbook of psychology and diabetes. A guide to psychological measurement in diabetes research and practice. Edited by Chur BC, Bradley C. Chur: Harwood Academic Publishers; 1994:111–132.
28. SPSS Inc:SPSS for Windows, Rel. 11.5.0. Chicago: SPSS Inc; 2002. 29. Cronbach LJ:Coefficient alpha and the internal structure of tests.
Psychometrika1951,16:297–334.
30. Nunnally JC, Bernstein IH:Psychometric theory. New York: McGraw-Hill; 1994. 31. Cohen J, Cohen P, West S, Aiken L:Applied multiple regression/correlation
analysis for the behavioral sciences. 3rd edition. Hillsdale: Lawrence Erlbaum Associates; 2003.
32. Norman GR, Sloan JA, Wyrwich KW:Interpretation of changes in health-related quality of life: the remarkable universality of half a standard deviation.Med Care2003,41:582–592.
33. Scientific Advisory Committee of the Medical Outcomes Trust:Assessing health status and quality-of-life instruments: attributes and review criteria.Qual Life Res2002,11:193–205.
34. Peyrot M, Rubin RR:How does treatment satisfaction work?: Modeling determinants of treatment satisfaction and preference.Diabetes Care 2009,32:1411–1417.
35. Peyrot M, Rubin R:Perceived medication benefits and their association with interest in using inhaled insulin in type 2 diabetes: A model of patients’cognitive framework.Patient Prefer Adherence2011,5:255–265.
doi:10.1186/1477-7525-10-125