O R I G I N A L P A P E R
Loss of Control as a Discriminating Factor Between
Different Latent Classes of Disordered Gambling
Severity
Richard J. E. James1•Claire O’Malley1,2•Richard J. Tunney1
Published online: 18 February 2016
ÓThe Author(s) 2016. This article is published with open access at Springerlink.com
Abstract Analyses of disordered gambling assessment data have indicated that com-monly used screens appear to measure latent categories. This stands in contrast to the oft-held assumption that problem gambling is at the extreme of a continuum. To explore this further, we report a series of latent class analyses of a number of prevalent problem gambling assessments (PGSI, SOGS, DSM-IV Pathological Gambling based assessments) in nationally representative British surveys between 1999 and 2012, analysing data from nearly fifty thousand individuals. The analyses converged on a three class model in which the classes differed by problem gambling severity. This identified an initial class of gamblers showing minimal problems, a additional class predominantly endorsing indica-tors of preoccupation and loss chasing, and a third endorsing a range of disordered gam-bling criteria. However, there was considerable evidence to suggest that classes of intermediate and high severity disordered gamblers differed systematically in their responses to items related to loss of control, and not simply on the most ‘difficult’ items. It appeared that these differences were similar between assessments. An important exception to this was one set of DSM-IV criteria based analyses using a specific cutoff, which was also used in an analysis that identified an increase in UK problem gambling prevalence between 2007 and 2010. The results suggest that disordered gambling has a mixed latent structure, and that present assessments of problem gambling appear to converge on a broadly similar construct.
Keywords Problem gamblingGambling prevalenceLatent class analysisAssessment
Electronic supplementary material The online version of this article (doi:10.1007/s10899-016-9592-z) contains supplementary material, which is available to authorized users.
& Richard J. Tunney
1 School of Psychology, University of Nottingham, University Park, Nottingham NG7 2RD, UK
2
Introduction
One of the debates in defining disordered gambling is whether disordered gamblers form the extreme of a continuum of severity, or whether there are qualitative differences between disordered and non-disordered gamblers. Studies of disordered gambling using taxometric analysis have identified a qualitatively distinct latent class of gamblers showing very high problem severity (James et al. 2014; Kincaid et al. 2013). Widely supported models of gambling disorder, such as the Pathways Model (Blaszczynski and Nower 2002), hypothesize the presence of latent classes amongst problem and pathological gamblers (Blaszczynski 2000). Other studies utilising latent class analysis (LCA) to determine the number of discrete subtypes have demonstrated mixed findings. LCA studies of pathological gambling have consistently found three or four subtypes of gambler. Some studies have concluded that there are quantitative and qualitative differences between latent classes (Nower et al.2013; Xian et al.2008), and others have emphasized that the ordering of the subtypes are evidence for a dimension (Carragher and McWilliams2011; McBride et al.2010). Although arguing that the evidence was stronger for a dimension of severity, these haven’t excluded the possibility of qualitative differences amongst gam-bling subtypes (McBride et al. 2010). The latent classes were similar across studies, comprising one group displaying no/minimal symptoms, a group showing moderate probability of symptom endorsement, and a group that exceeded the DSM cutoff for Pathological Gambling. Other analyses of prominent gambling assessments support a continuum of severity (Miller et al.2013; Strong and Kahler2007), but these use analytic methods that already assume a latent dimension is being measured. To examine this further, this report describes the findings of seventeen LCAs across five different surveys of the British population over a fifteen year period, using four assessments measuring problem and pathological gambling constructs.
Between 1999 and 2012, five nationally representative British and English surveys included assessments of disordered gambling. Three of these (the British Gambling Prevalence Survey series (BGPS)) (Sproston et al.2000; Wardle et al. 2007,2011) sur-veyed gambling behaviours, attitudes and disordered gambling prevalence in the UK, and were conducted by the National Centre for Social Research. The initial BGPS (Sproston et al.2000) assessed gambling in Britain following substantial changes in the gambling market (i.e. introduction of the National Lottery, scratchcards, internet gambling), and in anticipation of liberalized gambling legislation. The BGPS 2007 provided a baseline measurement of gambling in the UK prior to the implementation of the 2005 Gambling Act, and in light of changes since 1999. The BGPS 2010 intended to assess the impact of the Gambling Act introduced in September 2007. Measures of disordered gambling were included in three other surveys, commissioned by the Health and Social Care Information Centre or the Scottish Government; the Adult Psychiatric Morbidity Survey 2007 (APMS 2007) (McManus et al.2009; Wardle et al. 2012), the Health Survey for England 2012 (HSE 2012) (Craig and Mindell2013; Wardle and Seabury2013), and the Scottish Health Survey (SHS 2012) (Rutherford et al.2013a,b; Wardle2013).
following a decrease in the early to mid-1990s (Snowdon2013). Analysis of BGPS 2007 and 2010 data showed a significant increase in problem gambling between 2007 and 2010 (Wardle et al.2011) using a measurement derived from the DSM-IV Pathological Gam-bling criteria, albeit with strong caveats attached. Not least because the rate of disordered gambling is small, the observed increase prevalence amounts to less than twenty individuals.
The surveys included four assessments of disordered gambling. The first two were derived from the DSM-IV Pathological Gambling criteria (American Psychiatric Associ-ation2000). In four of the surveys participants were given an adaption of the ten criteria, eliciting endorsement of a four-point scale of frequency (Fisher 1996), subsequently dichotomized as present or absent. For the first seven criteria, indicators were scored as present if endorsed at the two highest levels of frequency. For the final three items, responses other than ‘never’ was scored as present (Sproston et al.2000). However, this differs from the logic of the DSM as individuals displaying disordered gambling beha-viours might not be categorised as showing a specific symptom. Other analyses of BGPS data (McBride et al.2010) have addressed this by re-dichotomizing the data on present/ absence, present defined as a score greater than 0. In the APMS, respondents were asked to respond yes/no if they engaged in each of the ten criteria at any point over the previous 12 months.
In addition, the Problem Gambling Severity Index (PGSI) was included in four surveys (BGPS 2007/2010 and HSE/SHS 2012). The PGSI is the predominant contemporary population assessment of problem gambling (Williams et al. 2012). It is assumed to measure a continuum of harm (Ferris and Wynne2001; Miller et al.2013), but has been demonstrated to measure latent categories (James et al. 2014; Kincaid et al. 2013). The PGSI is partly derived from the DSM-IV Pathological Gambling criteria and the South Oaks Gambling Screen (SOGS) (Stinchfield 2002; Svetieva and Walker2008), a patho-logical gambling assessment derived from the DSM-III criteria (Lesieur and Blume1987), and administered in the BGPS 1999. The once popular SOGS has declined in use because it has been found to produce inflated pathological gambling estimates (Sproston et al.2000; Stinchfield2002). The questionnaire content, focusing on the financial consequences of gambling, has been criticised as not comprehensively measuring a pathological gambling model (Stinchfield 2002). However, the SOGS is still frequently used as a screen in experimental research. While it has been argued that these assessments might converge on the same construct (Svetieva and Walker2008), this has not been directly tested. The PGSI and SOGS have not previously been analysed using LCA.
Methods
Sample
The five surveys sampled 48,777 respondents. However, respondents were excluded if data was missing, or did not complete an assessment as they were under 16 or hadn’t gambled in the previous year, leaving 27,219 participants (see Table1 for full details about the sample). The anonymised survey data for these analyses was downloaded from the UK Data Archive (National Centre for Social Research2008,2010,2011; National Centre for Social Research & University College London. Department of Epidemiology and Public Health2014; Scottish Centre for Social Research and NatCen Social Research & Survey Research Centre2015). The data for each of the surveys was collected by interviewers employed by NatCen. The interviewers were briefed by the study lead researchers prior to data collection. They were given training on the questionnaire content, and instructed on the administration of the project and fieldwork protocol (Sproston et al.2000; Wardle et al. 2011). After the sampling was carried out (see below), selected households were sent an advance letter informing them about the survey, and that they would be interviewed face to face for data collection (for the 2010 iteration the survey was administrated with computer assistance).
The BGPS 1999 (Sproston et al. 2000) was a nationally representative survey of the British general population aged 16 or older. The survey sampled 7680 respondents from a random sample of 7000 UK postcodes (response rate=65 %). The survey found that 72 % of the sample had gambled in the previous year. 5289 respondents, 95 % of past-year gamblers, fully completed at least one pathological gambling assessment (DSM-IV ordinal response, SOGS).
The BGPS 2007 (Wardle et al.2007) sampled 9003 respondents from a stratified sample of 10,114 addresses taken from the UK Postcode Address File, with the sample stratified by Government Office Region, socio-economic status and ethnicity. The response rate was 52 % and 68.4 % of the population gambled in the previous year. In total 5635 respon-dents, 91.4 % of past-year gamblers, fully completed a problem (PGSI) or pathological (DSM-IV ordinal) gambling assessment.
The APMS 2007 (McManus et al.2009; Wardle et al.2009) was the third in a series of surveys investigating psychiatric disorders, conducted by NatCen in collaboration with the University of Leicester, on behalf of HSCIC. This survey sampled 7403 respondents from a representative English sample (response rate of 57 %). Households were randomly selected from a stratified sample of English postcodes. One person was randomly selected from each household to complete the survey. The prevalence of past year gambling was 65.9 %, and a total of 3568 respondents (73 % of gamblers) fully completed the DSM-IV Patho-logical Gambling criteria based (yes/no) assessment included in this survey.
The BGPS 2010 (Wardle et al.2011) was a nationally representative sample of British households, conducted by NatCen on behalf of the Gambling Commission. A total of 7756 respondents completed the survey, with households being randomly sampled from a stratified sample (stratified by the same variables as the BGPS 2007) of 391 postcode sectors. The response rate was 47 %, 73 % gambled over the previous year, and 5706 respondents fully completed a problem (PGSI) or pathological (DSM-IV ordinal) gambling assessment.
data was drawn from a combined and reweighted sample based on a secondary analysis conducted by NatCen (Wardle et al.2014). In total 16,935 respondents (10,333 English, 6602 Scottish) completed the health surveys. In total 13,106 were asked about their recent gambling behaviour (8291 England, 4815 Scotland). 65 % had gambled in the previous 12 months. Of those, 7021 (4290 England, 2731 Scotland) fully completed a problem (PGSI) or pathological (DSM-IV ordinal) gambling assessment.
Measures
Gambling disorder was assessed via four methods: two DSM-IV Pathological Gambling based screens, PGSI and SOGS. The DSM measure included in the BGPS elicited each criterion on a 4-point scale of frequency. We conducted LCA on this data in three formats (ordinal data, dichotomised using BGPS approach, dichotomised based on present/absent). The assessments are reported in full in Table S1.
[image:5.439.47.393.71.368.2]All five surveys included a measure based on the DSM-IV Pathological Gambling criteria, which assesses the presence of ten symptoms, classified as present/absent based on past year prevalence. Respondents endorsing five or more symptoms were classified as a
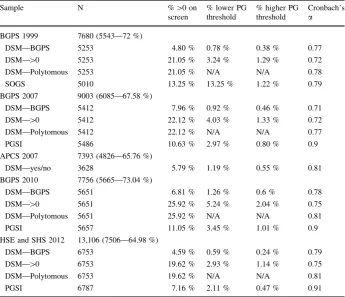
Table 1 Descriptive statistics for each of the problem gambling assessments, from each sample (weighted)
Sample N %[0 on
screen
% lower PG threshold
% higher PG threshold
Cronbach’s
a
BGPS 1999 7680 (5543—72 %)
DSM—BGPS 5253 4.80 % 0.78 % 0.38 % 0.77
DSM—[0 5253 21.05 % 3.24 % 1.29 % 0.72
DSM—Polytomous 5253 21.05 % N/A N/A 0.78
SOGS 5010 13.25 % 13.25 % 1.22 % 0.79
BGPS 2007 9003 (6085—67.58 %)
DSM—BGPS 5412 7.96 % 0.92 % 0.46 % 0.71
DSM—[0 5412 22.12 % 4.03 % 1.33 % 0.72
DSM—Polytomous 5412 22.12 % N/A N/A 0.77
PGSI 5486 10.63 % 2.97 % 0.80 % 0.9
APCS 2007 7393 (4826—65.76 %)
DSM—yes/no 3628 5.79 % 1.19 % 0.55 % 0.81
BGPS 2010 7756 (5665—73.04 %)
DSM—BGPS 5651 6.81 % 1.26 % 0.6 % 0.78
DSM—[0 5651 25.92 % 5.24 % 2.04 % 0.75
DSM—Polytomous 5651 25.92 % N/A N/A 0.81
PGSI 5657 11.05 % 3.45 % 1.01 % 0.9
HSE and SHS 2012 13,106 (7506—64.98 %)
DSM—BGPS 6753 4.59 % 0.59 % 0.24 % 0.79
DSM—[0 6753 19.62 % 2.93 % 1.14 % 0.75
DSM—Polytomous 6753 19.62 % N/A N/A 0.81
PGSI 6787 7.16 % 2.11 % 0.47 % 0.91
pathological gambler. The DSM-5 (American Psychiatric Association2013) uses a cutoff of four for Gambling Disorder. The BGPS reports use a cutoff of three to measure sub-clinical PG (Orford et al.2010). For four of the surveys (BGPS series, HSE/SHS 2012), a questionnaire designed by Fisher (1996), and validated prior to the administration of the BGPS 1999 (Sproston et al.2000) was used, with items probing each criteria elicited on a four point scale of frequency. In the APMS 2007, respondents were asked yes/no if they engaged in the behaviour covered by each criteria.
The PGSI (Ferris and Wynne 2001) is a nine-item assessment of problem gambling, designed to measure a continuum of gambling harm, elicited on a four-point scale of past-year frequency. The PGSI was administered in the BGPS 2007, 2010 and HSE/SHS 2012 surveys. The PGSI is a comparatively superior assessment of problem gambling (McMillen and Wenzel2006). The PGSI discriminates four levels of problem gambling severity; non problem gambler (0), low risk problem gambler (1–2), moderate risk problem gambler (3–7) and problem gambler (8?). However, the validity of the intermediate interpretive categories used in the measure has been questioned (Currie et al.2013), and the appropriate cutoff score to determine which individuals are of interest (Walker and Blaszczynski 2011). Several items in the PGSI are derived from the DSM-IV Pathological Gambling criteria or the SOGS.
The SOGS is a 16-item questionnaire derived from the DSM-III Pathological Gambling criteria (Stinchfield 2002). SOGS scores can range from 0 to 20,1 probing numerous problem and pathological gambling behaviours, including loss-chasing, guilt from gam-bling, lying to, receiving criticism from, and arguing with people close to the respondent about their gambling. Half of the SOGS items pertain to borrowing money, selling items or taking loans/credit out to fund gambling. A score of 0 is classified as non-pathological gambling, between 1 and 4 as having some problems with gambling, and 5 or more as a probable pathological gambler. The SOGS was adapted for the BGPS 1999 to measure past year, rather than lifetime, pathological gambling (Sproston et al.2000).
Analytic Procedure
LCA was conducted on each disordered gambling screen from each survey, on each case where a completed assessment was present. The indicators included for each analysis were the individual questions from each screen. The analysis was conducted using MPlus 6.1.3 (Muthe´n and Muthe´n1998–2011). One through six-class models were compared in each analysis. LCAs were adjusted for survey weight (which differed depending on the sam-ple),2 clustering and stratification.3 Interpretation of competing latent class models was conducted using multiple indices of fit. A number of different indices of fit can be used to determine which latent class model is appropriate, as there is no objective method for determining a latent class model to adopt. These include the Akaike Information Criterion (AIC) (Akaike1974), Bayesian Information Criterion (BIC) (Schwarz1978), Sample-Size Adjusted BIC (SSABIC) (Sclove1987), and adjusted likelihood ratio tests (LRT) (Lo et al. 2001). Lower information criteria indicate superior model fit. LRT’s test the likelihood that ak-class model is a better fit of the data compared to ak-1 class model, and reports a pvalue. If thepvalue is not significant, it is not possible to reject thek-1 class model
1
Item 16 has 11 sub-items. Items 1, 2, 3, 12, 16j and 16k aren’t counted towards the SOGS score. 2
Please see supplementary information for details on sampling. 3
(Muthe´n and Muthe´n1998–2011). Greatest weight was given to BIC, as previous studies have indicated its effectiveness at discriminating between latent class models (Nylund et al.2007). Some methods appear to be more efficacious than others, but these appear to interact with a number of factors, with sample size for example an important consideration in determining whether to place greater weight on BIC or AIC. A number of studies have supported the use of a bootstrap variant of the likelihood ratio test (Nylund et al.2007), but this test cannot be calculated for latent class models that account for complex sampling methods, such as the latent class models described in this report. The proportion of cases assigned to each latent class was determined based on the estimated model. In addition, the probability of endorsement for each level of each indicator for each latent class was calculated, and the posterior probability that each case assigned to a specified latent class. Local independence was initially tested by assessing the Chi square for the overall model. It has previously been suggested that this is the most appropriate test for violations of local independence (Asparouhov 2015). A significant result indicates residual depen-dence between indicators at the level of the latent class or classes. In these situations looking at the bivariate residuals is advised to direct where local independence should be relaxed.
Results
In the results that follow we report a number of observations. The first section gives an overview of the output of the LCAs, identifying the pattern of the similarities across analyses, and the profile of gamblers that fall into the different latent classes. The following section covers several indices of fit that may be used to justify selecting a specific latent class model. After this a high level overview of the level of consistency between different LCAs is reported. In light of these findings, consideration is then given to differences in demographic profiles and gambling behaviours, as research has tended to identify that the most severely disordered gamblers form different demographic profiles and engage in a range of addictive behaviours such as drinking and smoking. This is also informative to the literature concerning whether specific types of gambling game are linked with problematic behaviours. Finally, more detailed results are provided for each of the measurements used in the surveys covered in this analysis. For the DSM-IV based measure used in the gambling prevalence and health surveys, this contrasts between different methods of elicitation identified by the study authors and in the literature.
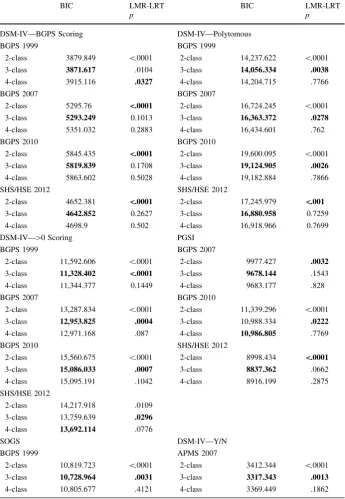
Table 2 Summary indices from latent class analyses
BIC LMR-LRT
p
BIC LMR-LRT
p
DSM-IV—BGPS Scoring DSM-IV—Polytomous
BGPS 1999 BGPS 1999
2-class 3879.849 \.0001 2-class 14,237.622 \.0001
3-class 3871.617 .0104 3-class 14,056.334 .0038
4-class 3915.116 .0327 4-class 14,204.715 .7766
BGPS 2007 BGPS 2007
2-class 5295.76 <.0001 2-class 16,724.245 \.0001
3-class 5293.249 0.1013 3-class 16,363.372 .0278
4-class 5351.032 0.2883 4-class 16,434.601 .762
BGPS 2010 BGPS 2010
2-class 5845.435 <.0001 2-class 19,600.095 \.0001
3-class 5819.839 0.1708 3-class 19,124.905 .0026
4-class 5863.602 0.5028 4-class 19,182.884 .7866
SHS/HSE 2012 SHS/HSE 2012
2-class 4652.381 <.0001 2-class 17,245.979 <.001
3-class 4642.852 0.2627 3-class 16,880.958 0.7259
4-class 4698.9 0.502 4-class 16,918.966 0.7699
DSM-IV—[0 Scoring PGSI
BGPS 1999 BGPS 2007
2-class 11,592.606 \.0001 2-class 9977.427 .0032
3-class 11,328.402 <.0001 3-class 9678.144 .1543
4-class 11,344.377 0.1449 4-class 9683.177 .828
BGPS 2007 BGPS 2010
2-class 13,287.834 \.0001 2-class 11,339.296 \.0001
3-class 12,953.825 .0004 3-class 10,988.334 .0222
4-class 12,971.168 .087 4-class 10,986.805 .7769
BGPS 2010 SHS/HSE 2012
2-class 15,560.675 \.0001 2-class 8998.434 <.0001
3-class 15,086.033 .0007 3-class 8837.362 .0662
4-class 15,095.191 .1042 4-class 8916.199 .2875
SHS/HSE 2012
2-class 14,217.918 .0109
3-class 13,759.639 .0296
4-class 13,692.114 .0776
SOGS DSM-IV—Y/N
BGPS 1999 APMS 2007
2-class 10,819.723 \.0001 2-class 3412.344 \.0001
3-class 10,728.964 .0031 3-class 3317.343 .0013
4-class 10,805.677 .4121 4-class 3369.449 .1862
Statistics highlighted in bold identify which model is the best fit of the data
Means are reported for ordinal measures using most likely latent class membership (Tables S14, S15). An examination of the score distributions for each class based on most likely class membership indicated very little overlap in scores, suggesting that problem gambling falls along a dimension of severity (Tables S16–S20). AIC indices indicated a minimum of six latent classes on each LCA, although this appears to be because AIC over fits latent class models with many cases (Nylund et al.2007). Classification accuracy was generally very high across measures, and did not appear to systematically differ between classes. In addition, information about demographic and game prevalence information for each latent class is reported in Tables S21 through S26.
Indices of Fit
Results from other indices of fit are reported below. An examination of AICs revealed that these tended to support a four class model for the DSM LCAs where individuals were dichotomised using the BGPS scoring scheme. Although similar to BIC and other indices, a four-class model was rejected as the third class was small (around thirty members) to begin with and the additional class further split this class. For the other LCAs (bar one
[image:9.439.90.351.56.347.2]exception) AIC supported six or more classes. These additional classes tended to split the second and third classes into smaller groups, leaving a class of a few hundred individuals (who overwhelmingly endorsed the preoccupation and loss-chasing items) and small classes with 30–40 members in each. In some cases (e.g. a number of the[0 DSM LCAs) this was readily interpretable. However in the majority of LCAs this was not the case; six-class solutions tended to produce a number of very small latent six-classes (\10 cases), and it appeared that these were largely spurious.
Classification accuracy was very high across the models, and was similar regardless of the number of classes specified. The entropy of the models changed very little between analyses, with a classification accuracy of approximately 0.9. Classification accuracy for the first class was slightly higher (around 0.95), and very similar for the second and third
[image:10.439.89.353.55.398.2](around 0.9). This difference is not surprising given that the first class in each LCA contained several thousand individuals that did not endorse any indicator.
Consistency Over Time
It should be noted there are important differences in sampling and elicitation between surveys. However, it is clear that bar one exception, LCAs of the same measure show notable consistency between survey years. Although we cannot definitively test this, and this should be taken with the caveat that these considerations are ultimately somewhat subjective, the estimated latent class models for assessments used on more than one occasion over the five surveys show notable similarity. Even in the latent classes with smaller sample sizes, these show the same pattern of responding. The one exception to this
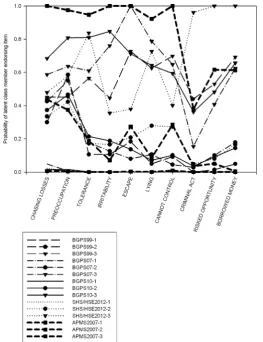
[image:11.439.88.352.55.396.2]is the ordinal DSM-IV measure using the BGPS cutting score, which had a very small, inconsistent third class. For other DSM and PGSI LCAs (Figs.3,4), these indicate similar latent class models across the different surveys.
Demographics and Gambling Behaviour
In the supplementary materials (Tables S21–S26) we report detailed descriptive statistics concerning demographic information and past-year prevalence on gambling between the latent classes. Comparisons between years are not considered because of market changes and different survey and item elicitation. Overall there are a number of cases (e.g. online gambling/betting, age of first gamble, scratchcard and slot machine play) where consid-erable differences between the first and second/third classes were observed, but not between the second and third classes. There were also a number of variables (e.g. smoking prevalence, wager amount/monthly spend, FOBT use) which graded alongside the severity of the classes. These paint a picture similar to the LCA indicators; some imply a continuum
[image:12.439.92.352.56.390.2]of severity, others show more marked differences between the second and third classes. There were some differences in gambling behaviour between assessments; in particular the PGSI and SOGS demonstrate higher prevalence of many gambling behaviours. This is likely because fewer individuals endorsed any of the indicators on these measures relative to the ordinal DSM measure. However, a consistent pattern between classes persists.
Adapted DSM-IV Pathological Gambling Criteria (BGPS Series): BGPS Scoring
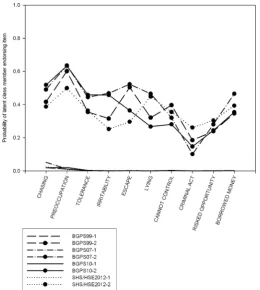
All four LCA’s indicated a three-class model (Table S2). However, fit indices only showed marginal differences between two and three-class models. The LRT’s supported a two-class model. Plotting the responses probabilities for two and three latent-two-class models revealed that two-class models (Fig.1) were more consistent than three-class models (Fig.2). The third class in three-class models varied considerably between samples, on some indicators differing by more than 80 %. However, in one instance there was evidence that local independence was violated; examination of the bivariate residuals suggested there was considerable residual covariance between indicators. Three-class models met this assumption. Consequently, although a three-class model was statistically a better fit of the data, the extra class did not show a consistent pattern of responding, likely due to the very low class size (n=28, 29, 33, 10). Furthermore, none of the response probabilities for class three exceeded 0.75, suggesting these were weak indicators. This was worse for two-class models, where the highest endorsement probability (item 2) was 0.59. In addition it appeared, as discussed below, that the latent class model from this scoring method differed from other DSM based assessments analysed.
Adapted DSM-IV Pathological Gambling Criteria (BGPS Series): Scores >0
BIC indices and LRTs supported a three-class solution (Table S3) in three analyses. For HSE 2012 data, indices supported a four-class solution, although LRTs supported a three-class model. This fourth three-class consisted of 10 cases in which respondents endorsed eight or more indicators. Comparisons with other cutoffs indicated this group comprised severe problem gamblers and gamblers likely to endorse many problem behaviours at low frequency.
this was not a necessary indicator of group membership in the manner the loss of control items appeared to be.
Adapted DSM-IV Pathological Gambling Criteria (BGPS Series): Polytomous
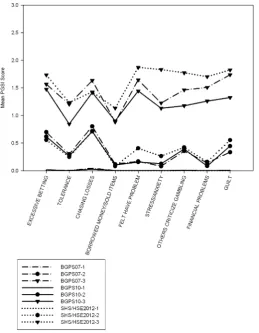
BIC indices supported a three-class model. Three of four LRT’s supported a three-class model as well. The LRT of the HSE 2012 data supported a two-class model. Comparing the response probabilities for each latent class revealed that the latent class models were very similar to those with the[0 cutoff used. Examination of the group means (Figure S1) again revealed a very similar pattern to the response probabilities for the[0 cutoff (Fig.3).
Adapted DSM-IV Pathological Gambling Criteria (APMS 2007): Yes/No
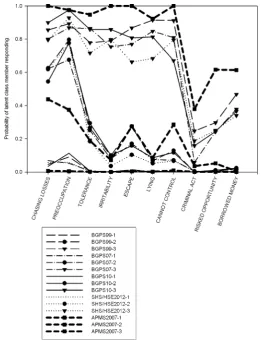
The LCA supported a three-class model. The proportion the sample assigned to each latent class resembled the BGPS cutoff in class size. This revealed a group of recreational gamblers with minimal probability of endorsing any criterion. The second group showed low endorsement of multiple PG symptoms and higher probability of endorsing preoc-cupation and loss-chasing indicators. The third group had a high probability of endorsing every indicator with the exception of committing criminal acts to fund gambling. Com-paring this LCA with other DSM measures (Figs.2,3) revealed that for the first seven criteria the data strongly resembled the three-class model found with the[0 cutoff, but for the remaining items, the pattern of symptom endorsement was more similar to the BGPS cutoffs. The intermediate class was consistent with both the[0 and BGPS cutoffs, as both demonstrated similar response patterns.
PGSI Analyses
Two analyses of the PGSI data supported a three-class model and the third marginally supported a four-class model. All of the LRT’s supported a three-class model. The first class had minimal probability of endorsing any indicator. The second class had a high probability of endorsing two items (1 – betting more than one could afford to lose, and 3 – loss-chasing), and a moderate probability (between 0.2 and 0.4) of endorsing three of the indicators (2 – needing to gamble with more money to get same feeling of excitement, 7 – others criticizing gambling, and 9 – felt guilty about gambling). The third had a high probability ([0.7) for all items. However, overall severity remained moderate; item means were between 1.4 and 1.6, i.e. between ‘sometimes’ and ‘most of the time’. Between the second and third classes, high severity items identified by IRT analyses (items 4,6,8) (Miller et al.2013), and three of the four items measuring loss of control (items 2,3,4,8) (Kincaid et al.2013) showed consid-erable separation between classes ([0.8 for class 3,\0.2 for class 2). However, as these items overlap, it is difficult to adjudge between loss of control or severity explanations between latent classes. Item scores were consistent between classes (Fig.4), and the dis-tribution of PGSI scores (Table S17) were similar, indicating that the third class strongly resembled the PGSI category of problem gambler (8?).
SOGS Analysis
probability of endorsing two items: excessive betting and criticism about gambling not dissimilar to the second class in the PGSI LCA. This group had a lower (\30 %) proba-bility of endorsing items querying borrowing household funds to gamble, feeling they might have a problem with gambling, loss-chasing and lying about winning. Comparing most likely class membership against SOGS scores closely resembled the interpretative categories of the SOGS (Table S18). However, there were very few strong indicators of latent class membership in the SOGS; item endorsement probability did not exceed 0.8 for any item across the three classes (Table S13), and the probability of endorsement exceeded 0.7 for only three: excessive gambling, guilt and other criticizing one’s gambling.
Discussion
Analyses of disordered gambling from five nationally representative surveys revealed evidence for a three-class latent structure. The latent structure of these analyses was similar between assessments. The subtypes showed minimal overlap on assessment score, but indicators related to loss of control displayed the greatest differences between the medium and high severity latent classes. Furthermore, with one exception, analyses on the same assessment across time showed notable consistency. These findings are consistent with previous LCAs of DSM data, and extend to two frequent used assessments. Despite these assessments ostensibly measuring different conceptualizations of disordered gambling, they appear to converge on a common structure.
The analysis identified a combination of quantitative and qualitative differences between latent classes. The analyses indicated that the latent classes were ordered along a dimension of severity, as the scores of latent class members showed very little overlap between one another (Tables S15–S19). However, the greatest differences were observed on items relating to loss of control, a central construct in addiction, where there were typically high probabilities of endorsement (c. 80 %) for the highest severity class, and low probabilities of endorsement (c. 15 %) for the intermediate severity group (Fig.3). This is potentially indicative of a difference in the type of symptoms different groups of gamblers endorsed rather than just the frequency, consistent with a qualitative distinction and is convergent with other latent structure analyses of disordered gambling data that identified categorical differences. This was the case with DSM and the SOGS items (where strong indicators were identified), but for PGSI loss of control and ‘difficult’ (i.e. high severity) items overlapped, meaning it wasn’t possible to discriminate between these competing explanations. It remains difficult to characterise disordered gamblers at the extreme end of a continuum, given the overall indicator distribution. Only in one instance did more than a quarter of individuals endorse at least one item. Even then, the indicators were very substantially skewed (James et al. 2014). If it can be plausibly claimed that problem gamblers form the extreme of a continuum, then a more sensitive measurement would be highly beneficial.
slightly lower severity than the one identified by taxometric analysis. The LCA’s found that the highest severity category used in the PGSI (8?) was closely calibrated to the lowest score at which cases were assigned to the third latent class. None of the analyses indicated that the original (1–2/3–7) or modified (1–3/4–7) intermediate sub-categories formed distinct latent classes. Previous studies failed to find differences for the original categories (Currie et al.2013). However, this might be due to the low number of non-zero responses on the PGSI. It might be useful to combine these data to test whether the presence of intermediate categories might be detected with a larger dataset.
Previous taxonomies of disordered gambling have identified the presence of three categories of gamblers across the general population: Shaffer, Hall, and Vander Bilt (1999) for instance outline a standardisation of terminology for, identifying three levels of dis-ordered gambling. Level one gamblers consist of recreational or non-gamblers, level two gamblers display subclinical difficulties with gambling, and level three gamblers meet clinical criteria for Gambling Disorder or Pathological Gambling. The findings of these analyses appear to strongly support such a demarcation, both in the number of groupings identified and the types of behaviours members of the identified latent classes are likely to endorse.
These results inform a wider debate concerning the reclassification of Gambling Disorder in the DSM-5. The manual makes three major alterations from the conceptuali-sation of Pathological Gambling in the DSM-IV; one criterion was removed (engaging in criminal acts to fund gambling), the clinical cutoff was reduced from five criteria to four, and it implemented a more graded approach to classifying disordered gamblers, distin-guishing between low, moderate and high severity. These findings suggest that moderate and severely disordered gamblers form a distinct latent class from other disordered and (non-clinical) problem gamblers. In addition, the results demonstrate that the removal of the illegal acts criterion ought to make very little difference of the ability of the criteria to distinguish between different levels of gambling problems, in line with the rationale for removing this criterion. However, concerns have been raised that although removing this item is beneficial for prevalence research as the item shows minimal incremental validity, this might shape clinical practices in a manner that might be counterproductive (Bowden-Jones2013). There are two other criteria that behave in a similar manner across studies, but more importantly between the moderate and high severity gamblers there are other items that discriminate these groups more comprehensively.
Analysis of the SOGS data indicated that this assessment measures a similar latent structure to the other screens in this report. It appears that gamblers in the second/inter-mediate latent class endorse relatively similar items across measurements as well. The scores for latent class members closely resembled the three subtypes for the SOGS. Although of declining importance in population assessment (Williams et al. 2012), this finding remains of interest as the SOGS is widely used in experimental research.
levels of disordered gambling prevalence (Table1). It might be of benefit to pool these data to compare class membership between samples in a similar manner to the BGPS analysis (Wardle et al.2011).
An important caveat is that while these findings identify a common latent structure in measurements of problem gambling, it is not possible to claim this generalises to other jurisdictions. As the analysis was restricted to British gamblers, these results may not translate to other countries where different restrictions on gambling or other circumstances prevail. However, there is some cause for optimism in this regard. Studies in the USA and South Africa have found commensurate results under different conditions; in the USA, LCA of NESARC data based off a structured interview revealed a similar pattern of results, and taxometric analysis of South African data identified a distinct latent class (albeit with much higher prevalence than UK/USA) in PGSI data.
To conclude, seventeen LCAs of disordered gambling assessment data revealed a consistent three-class structure in which gamblers differed in severity, and that clusters of disordered gambling indicators (loss-chasing/preoccupation, loss of control) characterised class membership. This final group appeared to show qualitative differences from the other latent classes on the basis that items measuring a loss of control showed the greatest differences between the latent classes. Our analyses of these large-scale surveys suggest that research on the transition from recreational to disordered gambling should focus on the factors that make individuals susceptible to loss of control. These may be internal to the individual, such as impulsivity; external to the individual, such as the schedules of rein-forcement of the gambling games, or an interaction between the two.
Acknowledgments The authors would like to thank Eamonn Ferguson for helpful comments on the analytic procedures. This work was supported by the Economic and Social Research Council (ES/J500100/ 1) and the Engineering and Physical Sciences Research Council (EP/G037574/1).
Open Access This article is distributed under the terms of the Creative Commons Attribution 4.0 Inter-national License (http://creativecommons.org/licenses/by/4.0/), which permits unrestricted use, distribution, and reproduction in any medium, provided you give appropriate credit to the original author(s) and the source, provide a link to the Creative Commons license, and indicate if changes were made.
References
Akaike, H. (1974). A new look at the statistical model identification.IEEE Transactions on Automatic Control, 19(6), 716–723.
American Psychiatric Association. (2000). Diagnostic and statistical manual of mental disorders, text revision (DSM-IV-TR). Washington, DC: American Psychiatric Association.
American Psychiatric Association. (2013).Diagnostic and statistical manual of mental disorders, (DSM-5Ò). Washington, DC: American Psychiatric Publishing.
Asparouhov, T. (2015).Local independence assumption (MPlus User Forum). Retrieved September 11, 2015, fromhttp://www.statmodel.com/discussion/messages/13/3895.html.
Blaszczynski, A. (2000). Pathways to pathological gambling: Identifying typologies.Journal of Gambling Issues, 1. Retrieved fromhttp://jgi.camh.net/doi/abs/10.4309/jgi.2000.1.1. doi:10.4309/jgi.2000.1.1. Blaszczynski, A., & Nower, L. (2002). A pathways model of problem and pathological gambling.Addiction,
97(5), 487–499.
Carragher, N., & McWilliams, L. A. (2011). A latent class analysis of DSM-IV criteria for pathological gambling: Results from the National Epidemiologic Survey on alcohol and related conditions. Psy-chiatry Research, 187(1), 185–192.
Craig, R., & Mindell, J. (2013).Health survey for England, Volume 1: Health, social care and lifestyles. Leeds: The Health and Social Care Information Centre.
Currie, S. R., Hodgins, D. C., & Casey, D. M. (2013). Validity of the problem gambling severity index interpretive categories.Journal of Gambling Studies, 29(2), 311–327.
Ferris, J., & Wynne, H. (2001).The Canadian problem gambling index. Ottawa, ON: Canadian Centre on Substance Abuse.
Fisher, S. E. (1996).Gambling and problem gambling among casino patrons.Report to the British Casino Industry Consortium. Plymouth, UK.
James, R. J. E., O’Malley, C., & Tunney, R. J. (2014). On the latent structure of problem gambling: A taxometric analysis.Addiction, 109(10), 1707–1717.
Kincaid, H., Daniels, R., Dellis, A., Hofmeyr, A., Rousseau, J., Sharp, C., & Ross, D. (2013). A taxometric analysis of problem gambling data from a South African national urban sample.Journal of Gambling Studies, 29(3), 377–392.
Lesieur, H., & Blume, S. (1987). The South Oaks Gambling Screen (SOGS): A new instrument for the identification of pathological gamblers.The American Journal of Psychiatry, 144(9), 1184–1188. Lo, Y., Mendell, N. R., & Rubin, D. B. (2001). Testing the number of components in a normal mixture.
Biometrika, 88(3), 767–778. doi:10.1093/biomet/88.3.767.
McBride, O., Adamson, G., & Shevlin, M. (2010). A latent class analysis of DSM-IV pathological gambling criteria in a nationally representative British sample.Psychiatry Research, 178(2), 401–407. McManus, S., Meltzer, H., Brugha, T., Bebbington, P., & Jenkins, R. (2009).Adult psychiatric morbidity in
England, 2007: Results of a household survey. Leeds: The NHS Information Centre for Health and Social Care.
McMillen, J., & Wenzel, M. (2006). Measuring problem gambling: Assessment of three prevalence screens.
International Gambling Studies, 6(2), 147–174. doi:10.1080/14459790600927845.
Miller, N. V., Currie, S. R., Hodgins, D. C., & Casey, D. (2013). Validation of the problem gambling severity index using confirmatory factor analysis and rasch modelling. International Journal of Methods in Psychiatric Research, 22(3), 245–255.
Muthe´n, B. O., & Muthe´n, L. K. (1998–2011).Mplus user’s guide(6th edn). Los Angeles, CA: Muthe´n & Muthe´n.
National Centre for Social Research. (2008).British Gambling Prevalence Survey, 2007 [computer file]. From Colchester, Essex: UK Data Archive [distributor], May 2008. doi:10.5255/UKDA-SN-5836-1. National Centre for Social Research. (2010).British Gambling Prevalence Survey, 1999 [computer file].
From Colchester, Essex: UK Data Archive [distributor], December 2010. doi: 10.5255/UKDA-SN-6639-1.
National Centre for Social Research. (2011).British Gambling Prevalence Survey, 2010 [computer file]. From Colchester, Essex: UK Data Archive [distributor], August 2011. doi:10.5255/UKDA-SN-6843-1. National Centre for Social Research, & University College London. Department of Epidemiology and Public Health. (2014).Health Survey for England, 2012 [computer file]. From Colchester, Essex: UK Data Archive [distributor], August 2011. doi:10.5255/UKDA-SN-7480-1.
Nower, L., Martins, S. S., Lin, K. H., & Blanco, C. (2013). Subtypes of disordered gamblers: Results from the National Epidemiologic Survey on alcohol and related conditions.Addiction, 108(4), 789–798. Nylund, K. L., Asparouhov, T., & Muthe´n, B. O. (2007). Deciding on the number of classes in latent class
analysis and growth mixture modeling: A Monte Carlo simulation study.Structural Equation Model-ing, 14(4), 535–569.
Orford, J. (2010).An unsafe bet? The dangerous rise of gambling and the debate we should be having. Chichester: Wiley.
Orford, J., Wardle, H., Griffiths, M., Sproston, K., & Erens, B. (2010). PGSI and DSM-IV in the 2007 British Gambling Prevalence Survey: Reliability, item response, factor structure and inter-scale agreement.International Gambling Studies, 10(1), 31–44.
Rutherford, L., Hinchliffe, S., & Sharp, C. (2013a).The Scottish Health Survey, 2012 edition, volume 1: Main report. Edinburgh: The Scottish Government.
Rutherford, L., Hinchliffe, S., & Sharp, C. (2013b).The Scottish Health Survey, 2012 edition, volume 2: Technical report. Edinburgh: The Scottish Government.
Schwarz, G. (1978). Estimating the dimension of a model.The Annals of Statistics, 6(2), 461–464. Sclove, S. L. (1987). Application of model-selection criteria to some problems in multivariate analysis.
Scottish Centre for Social Research and NatCen Social Research, & Survey Research Centre. (2015).
Gambling in England and Scotland, 2012: Combined Data from the Health Survey for England and the Scottish Health Survey [computer file]. From Colchester, Essex: UK Data Archive [distributor], February 2015. doi:10.5255/UKDA-SN-7631-1.
Shaffer, H. J., Hall, M. N., & Vander Bilt, J. (1999). Estimating the prevalence of disordered gambling behavior in the United States and Canada: A research synthesis.American Journal of Public Health, 89(9), 1369–1376.
Snowdon, C. (2013).The crack cocaine of gambling? Gambling machines in the UK.IEA Current Con-troversies Paper No. 41. Retrieved from http://www.iea.org.uk/sites/default/files/publications/files/ Gambling%20machines_for%20web.pdf.
Sproston, K., Erens, B., & Orford, J. (2000). Gambling behaviour in Britain: Results from the British gambling prevalence survey. London: National Centre for Social Research.
Stinchfield, R. (2002). Reliability, validity, and classification accuracy of the South Oaks Gambling Screen (SOGS).Addictive Behaviors, 27(1), 1–19.
Strong, D. R., & Kahler, C. W. (2007). Evaluation of the continuum of gambling problems using the DSM-IV.Addiction, 102(5), 713–721.
Svetieva, E., & Walker, M. (2008). Inconsistency between concept and measurement: The Canadian Problem Gambling Index (CPGI).Journal of Gambling Issues, 157–173. Retrieved from http://jgi. camh.net/doi/abs/10.4309/jgi.2008.22.2. doi:10.4309/jgi.2008.22.2.
Walker, M., & Blaszczynski, A. (2011). Clinical assessment of problem gamblers identified using the Canadian Problem Gambling Index. Adelaide: Independent Gambling Authority.
Wardle, H. (2013). Gambling behaviour. In L. Rutherford, S. Hinchliffe, & C. Sharp (Eds.),The Scottish Health Survey, 2012 edition, volume 1: Main report (pp. 241–287). Edinburgh: The Scottish Government.
Wardle, H., D’Souza, J., & Farrell, M. (2009). Gambling behaviour. In S. McManus, H. Meltzer, T. Brugha, P. Bebbington, & R. Jenkins (Eds.),Adult psychiatric morbidity in England, 2007 results of a household survey(pp. 199–214). Leeds: NHS Information Centre for Health and Social Care. Wardle, H., Moody, A., Spence, S., Orford, J., Volberg, R., Jotangia, D., & Dobbie, F. (2011).British
Gambling Prevalence Survey 2010. London: The Stationery Office.
Wardle, H., & Seabury, C. (2013). Gambling behaviour. In R. Craig & J. Mindell (Eds.),Health survey for England 2012, Volume 1: Health, social care and lifestyles. Leeds: The Health and Social Care Information Centre.
Wardle, H., Seabury, C., Ahmed, H., Payne, C., Bryon, C., Corbett, J., & Sutton, R. (2014).Gambling behaviour in England & Scotland: Findings from the health survey for England 2012 and Scottish Health Survey 2012. London: The Gambling Commission.
Wardle, H., Sproston, K., Orford, J., Erens, B., Griffiths, M., Constantine, R., & Pigott, S. (2007).British Gambling Prevalence Survey 2007. London: The Stationery Office.
Williams, R. J., Volberg, R. A., & Stevens, R. M. (2012).The population prevalence of problem gambling: Methodological influences, standardized rates, jurisdictional differences, and worldwide trends. Ontario Problem Gambling Research Centre.