R E S E A R C H A R T I C L E
Open Access
Optimizing gentamicin conventional and
extended interval dosing in neonates using
Monte Carlo simulation
–
a retrospective
study
Monique Bergenwall
1,8†, Sandra A. N. Walker
1,2,3,4*†, Marion Elligsen
1, Dolores C. Iaboni
5, Carla Findlater
5,
Winnie Seto
2,6and Eugene Ng
5,7Abstract
Background:Although aminoglycosides are routinely used in neonates, controversy exists regarding empiric dosing regimens. The objectives were to determine gentamicin pharmacokinetics in neonates, and develop initial mg/kg dosing recommendations that optimized target peak and trough concentration attainment for conventional and extended-interval dosing (EID) regimens.
Methods:Patient demographics and steady-state gentamicin concentration data were retrospectively collected
for 60 neonates with no renal impairment admitted to a level III neonatal intensive care unit. Mean pharmacokinetics were calculated and multiple linear regression was performed to determine significant covariates of clearance (L/h) and volume of distribution (L). Classification and regression tree (CART) analysis identified breakpoints for significant covariates. Monte Carlo Simulation (MCS) was used to determine optimal dosing recommendations for each CART-identified sub-group.
Results:Gentamicin clearance and volume of distribution were significantly associated with weight at gentamicin initiation. CART-identified breakpoints for weight at gentamicin initiation were:≤850 g, 851-1200 g, and > 1200 g. MCS identified that a conventional dose of gentamicin 3.5 mg/kg given every 48 h or an EID of 8-9 mg/kg administered every 72 h in neonates weighing≤850 g, and every 24 and 48 h, respectively, in neonates weighing 851-1200 g, provided the best probability of attaining conventional (peak: 5-10 mg/L and trough:≤2 mg/L) and EID targets (peak:12-20 mg/L, trough:≤0.5 mg/L). Insufficient sample size in the > 1200 g neonatal group precluded further investigation of this weight category.
Conclusions:This study provides initial gentamicin dosing recommendations that optimize target attainment for conventional and EID regimens in neonates weighing≤1200 g. Prospective validation and empiric dose optimization for neonates > 1200 g is needed.
Keywords:Neonate, Gentamicin, Pharmacokinetics, Traditional dosing, extended-interval dosing, Monte Carlo simulation
© The Author(s). 2019Open Access This article is distributed under the terms of the Creative Commons Attribution 4.0 International License (http://creativecommons.org/licenses/by/4.0/), which permits unrestricted use, distribution, and reproduction in any medium, provided you give appropriate credit to the original author(s) and the source, provide a link to the Creative Commons license, and indicate if changes were made. The Creative Commons Public Domain Dedication waiver (http://creativecommons.org/publicdomain/zero/1.0/) applies to the data made available in this article, unless otherwise stated. * Correspondence:[email protected]
†Monique Bergenwall and Sandra A. N. Walker contributed equally to this
work. 1
Department of Pharmacy, Sunnybrook Health Sciences Centre, 2075 Bayview Avenue, E-302, Toronto, ON M4N 3M5, Canada
2Leslie L. Dan Faculty of Pharmacy, University of Toronto, Toronto, ON, Canada
Background
Although aminoglycosides are routinely used in neo-nates, controversy exists regarding recommended em-piric dosing to optimize target attainment with either conventional dosing (peak: 5-10 mg/L and troughs ≤2 mg/L) or extended-interval dosing (higher peak and un-detectable trough) [1, 2]. In adult and older pediatric populations, EID regimens targeting peak concentra-tions of ≥20 mg/L are routinely recommended based on data suggesting that aminoglycoside activity is opti-mized with peak: minimum inhibitory concentration (MIC) ratios of 8–10:1 [3–5]. For these patient popula-tions, EID has consistently demonstrated equal efficacy, and equal or reduced toxicity versus conventional dos-ing [1,6–10].
While data exist to support the use of EID in neonates [6, 11–26], consensus is lacking regarding optimal EID
target concentrations that optimize efficacy and
minimize toxicity in this patient population. Peak con-centrations investigated in neonates vary from 4 to 20 mg/L [15–26], and typically remain below 12 mg/L, with no clear rationale. Furthermore, infants born at a gesta-tional age (GA)≤28 weeks, along with those with a birth weight (BW) of ≤1500 g, are underrepresented in EID studies. These infants constitute approximately 20% of all neonates admitted to Canadian neonatal intensive care units (NICUs), and 50% of those admitted to Level III NICUs [27]. Since aminoglycoside pharmacokinetic (PK) parameters in neonates may be influenced by weight [15, 18–20, 28, 29], gestational age [15, 28, 29] and postnatal age [19, 28, 29], further research is re-quired in this unique population in order to optimize target attainment and thereby, maximize the probability of efficacy of the antibiotic while minimizing the risk of nephrotoxicity.
The objectives of this study were to determine the pharmacokinetics of gentamicin in neonates with no clinical evidence of renal impairment in a Level III NICU, identify significant covariates of gentamicin PK parameters in neonates, and develop practical ini-tial dosing recommendations with the highest prob-ability of attaining target peak and trough serum concentrations currently accepted in clinical practice for both conventional dosing (trough < 2 mg/L and peak 5–10) and EID (trough < 0.5 mg/L and peak 8-20 mg/L, 12-20 mg/L, 15-20 mg/L and > 20 mg/L) of gentamicin.
Methods
This retrospective study was conducted in the level III NICU at Sunnybrook Health Sciences Centre (SHSC) in Toronto, Ontario, Canada. SHSC is a 1325-bed tertiary care teaching hospital, with 48 NICU beds [30].
Patient eligibility
Neonates admitted to the NICU from March 12th, 2010-November 26th, 2013 who were prescribed gen-tamicin to treat a documented or presumed infection and received > 48 h of gentamicin were identified from a hospital electronic database [31]. Patients with at least one set of steady state gentamicin serum con-centrations (trough and peak concon-centrations obtained at the earliest before and after the third dose of a given dosing regimen, respectively) with documenta-tion of gentamicin administradocumenta-tion and serum sampling times were included.
Neonates were excluded if they developed acute renal failure (urine output < 1 mL/kg/hr. or serum creatinine [sCr] > 100μmol/L) before or during gentamicin therapy, had an increase in sCr > 25% from baseline during treat-ment, or had a calculated gentamicin half-life > two standard deviations (SDs) from the mean half-life ob-served in the study population following data analysis, without the availability of an additional set of serum concentrations to confirm the accuracy of this calculated half-life.
Gentamicin dosing and sampling procedure
At the time of this study, neonatal SHSC conventional gentamicin dosing recommendations aimed to target a peak and trough serum concentration of 5–10 mg/L and≤2 mg/L, respectively. (Appendix 1).
Gentamicin pharmacokinetics
The PK profile of gentamicin in neonates has been previously described using one [14, 15, 17–19, 21,
gentamicin initiation; weight closest to gentamicin ini-tiation; and weight within 24 h of gentamicin levels.
Microbiological cultures
Data for all positive bacterial isolates along with the cul-ture source were extracted from the hospital electronic data base and patient charts.
Statistical analysis
Descriptive statistics were used for patient character-istics and microbiological results (number, percent, mean, SD and range). Since PK parameters display a lognormal distribution, the geometric mean, 95% con-fidence interval (CI) and range were reported for ke, t1/2, Vd, and Cl.
The data consisted of 60 neonates, of which only 4 had a second set of data with gentamicin levels. This sample size, along with the limited number of re-peated measures, was insufficient to run a robust hierarchical model. To circumvent this problem, only data from the first set of gentamicin levels were in-cluded for the analyses. Clinical parameters that would have been known prior to the initiation of gentamicin, were not calculated using other parame-ters input into the regression analysis and were pa-rameters with values available for > 80% of the gentamicin levels (GA at birth; CGA at gentamicin initiation; PNA at gentamicin initiation; gender; BW; weight at gentamicin initiation; Apgar score at one and 5 min of age; blood urea nitrogen [BUN] closest to gentamicin initiation, sCr closest to gentamicin initiation, 24 h urine output [ml/hr], and albumin closest to gentamicin initiation; use of concomitant nephrotoxins [indomethacin, ibuprofen, furosemide, amphotericin B, vancomycin]; and small-for-gesta-tional age [SGA; i.e neonates with a birth weight below the 10th percentile for neonates of the same GA] status) were input in the regression analysis. Variables that were significant (p< 0.05) with bivari-ate analysis and had a tolerance statistic of ≥0.4 when assessed for multicollinearity were included in a multivariable linear regression (MLR) model to identify those that remained significant using a
p< 0.05. Analyses were run using SAS Version 9.4 (SAS Institute, Cary, NC, USA).
A Classification and Regression Tree (CART) ana-lysis (CART1 Professional Extended Edition, Salford Systems, San Diego, California) was used to identify whether practical breakpoints existed for statistically significant MLR-identified covariates of gentamicin Cl (L/h) and Vd (L). The initial CART analyses in-put all statistically significant variables identified in the MLR analyses for Vd (L) and/or Cl (L/h). CART
analyses for Cl and Vd were pruned to the simplest tree, utilizing forced splits to identify clinically prac-tical breakpoints, with the lowest relative error. Forced splits were selected as practical rounded breakpoints derived from the CART identified break-point and which had equal or lower relative error than the CART identified breakpoint. The optimal CART model was that which allowed for the fewest sub-groups and had the lowest relative error. CART-identified breakpoints for covariates of gentamicin Vd and/or Cl were used to create patient sub-groups. Mean pharmacokinetic data were calculated for each identified sub-group and the sub-groups were compared to verify the existence of a signifi-cant difference in pharmacokinetic parameters (ke [h−1], Vd [L/kg], and Cl [L/h/kg]) to confirm the validity of the CART-identified breakpoints. An
ana-lysis of variance (ANOVA) with Tukey-Kramer
Multiple Comparisons Test for data that passed the test for normality or a Kruskal-Wallis Test with Dunn’s Multiple Comparison Test for data that did not pass the test for normality (if > 2 sub-groups were identified) or unpaired t-test (if 2 sub-groups were identified) were used to compare the sub-groups (GraphPad InStat version 3.05, 32-bit for Win95/NT; GraphPad Software Inc., La Jolla, Cali-fornia) for differences in pharmacokinetic parameters with a p< 0.05 considered statistically significant.
Mean PK data of each sub-group were used to ex-plore initial dosing recommendations using first order PK equations for a suggested dose and interval based on inputs for the desired peak and trough concentrations with an infusion time of 1 h. The ex-ploratory gentamicin dose and intervals were subse-quently evaluated using Monte Carlo simulation (Oracle Crystal Ball, version 11.1.2.4.000, 32-bit for Windows, Redwood City, California) (MCS). The mean and SDs for ke, Vd, and weight for each deter-mined patient subgroup were input with one million iterations to determine the probability of attaining target steady state peak gentamicin concentrations of 5–10 mg/L, 8–12 mg/L, 8–15 mg/L, 8–20 mg/L, 12– 20 mg/L, 15–20 mg/L and > 20 mg/L, as well as target
trough concentrations of ≤2 mg/L and≤0.5 mg/L
mean of any sub-group weight category. As part of each MCS, an assessment of the probability of attaining a Peak:MIC ratio of ≥8 was completed. The MIC was assumed to have a normal distribution truncated at a minimum of 0.5 mg/L and maximum of 8 mg/L (Clinical and Laboratory Standards Insti-tute breakpoint for intermediate susceptibility of Enterobactereaceae to gentamicin [32]) with a mean MIC90 of 2 mg/L and SD of 1 mg/L, resembling the
current MIC distribution for E coli in Canadian
pediatric patients [33].
Results Demographics
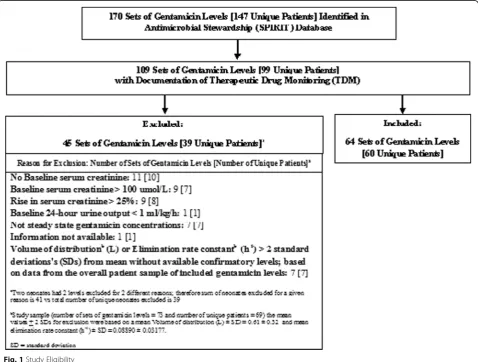
Of a total of 99 patients for whom there was docu-mentation of therapeutic drug monitoring (TDM), 60 patients were eligible for study inclusion to complete the pharmacokinetic analysis (Fig. 1 and Table 1). Patients with a rise in sCr of > 25% during
gentamicin therapy were excluded and represent pa-tients who developed nephrotoxicity while on
genta-micin (8/99 patients (8%)); recognizing that
nephrotoxicity may have been multifactorial and no assumptions can be made about causation associated with gentamicin in this retrospective study (Fig. 1).
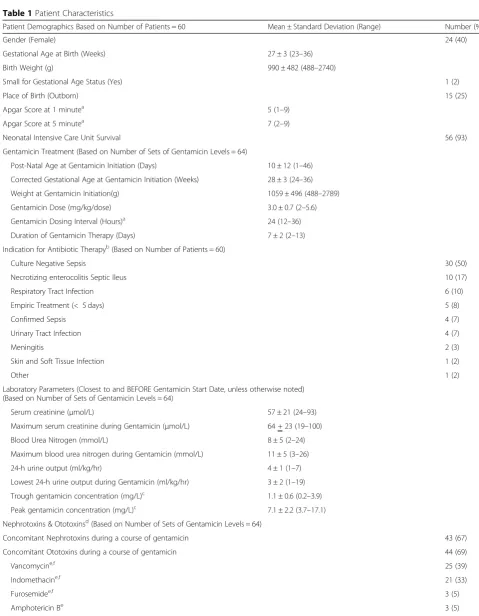
Forty-five of the 60 neonates (75%) included in
this study were born at ≤28 weeks gestation. The
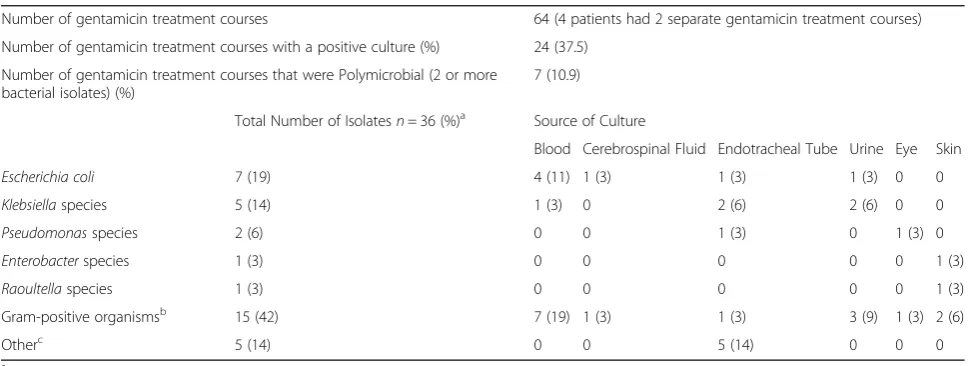
mean (± standard deviation (SD), range) GA of neo-nates at birth and CGA at gentamicin initiation were 27 (± 3, 23–36) weeks and 28 (± 3, 24–36) weeks, respectively. Thirty-nine patients (65%) had a BW of < 1000 g (defined as extremely low BW [34]) and 55 patients (92%) had a BW of < 1500 g (defined as very low BW [34]). In this cohort, gentamicin was most commonly used for the treatment of culture negative sepsis (30/60; 50%). Forty-four percent (16/36) of all bacterial isolates were gram-negative bacteria (GNB),
most commonly Escherichia coli (7/36; 19%) and
Klebsiella spp (5/36; 14%) (Table 2).
Table 1Patient Characteristics
Patient Demographics Based on Number of Patients = 60 Mean ± Standard Deviation (Range) Number (%)
Gender (Female) 24 (40)
Gestational Age at Birth (Weeks) 27 ± 3 (23–36)
Birth Weight (g) 990 ± 482 (488–2740)
Small for Gestational Age Status (Yes) 1 (2)
Place of Birth (Outborn) 15 (25)
Apgar Score at 1 minutea 5 (1–9)
Apgar Score at 5 minutea 7 (2–9)
Neonatal Intensive Care Unit Survival 56 (93)
Gentamicin Treatment (Based on Number of Sets of Gentamicin Levels = 64)
Post-Natal Age at Gentamicin Initiation (Days) 10 ± 12 (1–46) Corrected Gestational Age at Gentamicin Initiation (Weeks) 28 ± 3 (24–36) Weight at Gentamicin Initiation(g) 1059 ± 496 (488–2789)
Gentamicin Dose (mg/kg/dose) 3.0 ± 0.7 (2–5.6)
Gentamicin Dosing Interval (Hours)a 24 (12–36) Duration of Gentamicin Therapy (Days) 7 ± 2 (2–13) Indication for Antibiotic Therapyb(Based on Number of Patients = 60)
Culture Negative Sepsis 30 (50)
Necrotizing enterocolitis Septic Ileus 10 (17)
Respiratory Tract Infection 6 (10)
Empiric Treatment (< 5 days) 5 (8)
Confirmed Sepsis 4 (7)
Urinary Tract Infection 4 (7)
Meningitis 2 (3)
Skin and Soft Tissue Infection 1 (2)
Other 1 (2)
Laboratory Parameters (Closest to and BEFORE Gentamicin Start Date, unless otherwise noted) (Based on Number of Sets of Gentamicin Levels = 64)
Serum creatinine (μmol/L) 57 ± 21 (24–93)
Maximum serum creatinine during Gentamicin (μmol/L) 64 + 23 (19–100)
Blood Urea Nitrogen (mmol/L) 8 ± 5 (2–24)
Maximum blood urea nitrogen during Gentamicin (mmol/L) 11 ± 5 (3–26)
24-h urine output (ml/kg/hr) 4 ± 1 (1–7)
Lowest 24-h urine output during Gentamicin (ml/kg/hr) 3 ± 2 (1–19) Trough gentamicin concentration (mg/L)c 1.1 ± 0.6 (0.2–3.9) Peak gentamicin concentration (mg/L)c 7.1 ± 2.2 (3.7–17.1) Nephrotoxins & Ototoxinsd(Based on Number of Sets of Gentamicin Levels = 64)
Concomitant Nephrotoxins during a course of gentamicin 43 (67)
Concomitant Ototoxins during a course of gentamicin 44 (69)
Vancomycine,f 25 (39)
Indomethacine,f 21 (33)
Furosemidee,f 3 (5)
Bivariate and multivariable analyses
Significant predictors (p< 0.05) of gentamicin Vd (L) and Cl (L/h) from the bivariate screen and multivari-able model are detailed in Tmultivari-able 3. The only covariate that remained significant following MLR for Vd (L) was weight at gentamicin initiation (P< 0.0001). Co-variates that remained significant following MLR for
Cl (L/h) were PNA at gentamicin initiation (p=
0.0001), gender (p= 0.0447), and weight at gentamicin initiation (p< 0.0001).
CART analysis
The optimal CART analyses for Vd(L) and Cl(L/h) produced breakpoints based on the patients’ weight at gentamicin initiation, with a forced split at ≤850 g, > 850 g – 1200 g, and > 1200 g. These breakpoints provided the simplest trees with the lowest relative
error (Relative Error for Vd tree = 0.347; Relative Error for Cl tree = 0.344). CART identified trees and breakpoints for other parameters in the MLR regres-sion equations (PNA and gender) did not exist.
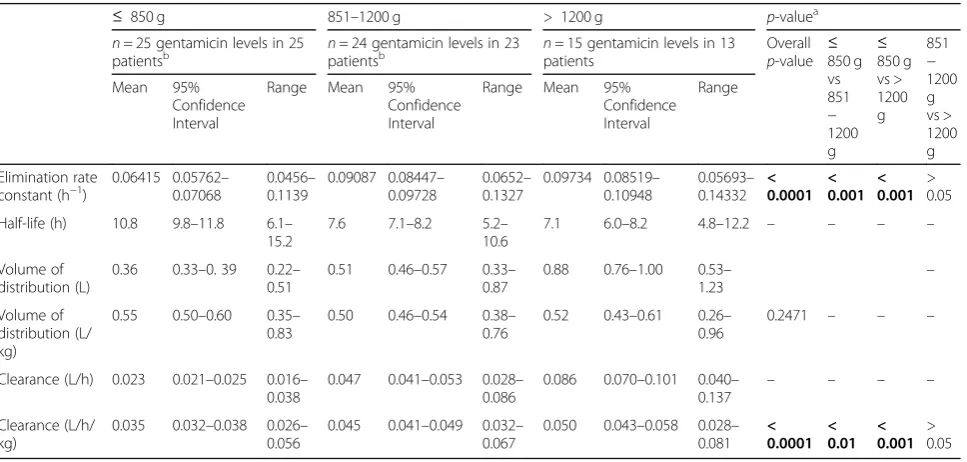
The mean ke and Cl (L/h/kg) for neonates ≤850 g were significantly different from the other weight breakpoints (Table4). Mean pharmacokinetic parameters for neonates weighing 851 - 1200 g versus > 1200 g were not statistically different (p> 0.05) (Table 4). The small number of participants (n= 13, with 15 gentamicin levels), limited weight range (1210-2789 g; mean 1744 g) and wide confidence intervals of the mean calculated pharmacokinetic parameters in the > 1200 g weight sub-group caused concern regarding the robustness of any dosing recommendations de-rived for this weight sub-category. As a result, the > 1200 g weight sub-category of neonates was excluded from further analyses. The significant difference in Table 1Patient Characteristics(Continued)
Patient Demographics Based on Number of Patients = 60 Mean ± Standard Deviation (Range) Number (%)
Ibuprofene,f 1 (2)
Erythromycinf 2 (3)
Prior course of Gentamicin 30 (47)
a
Median reported since apgar scores are ordinal data and standard dosing gentamicin intervals were used (e.g. every 12, 24, or 36 h), therefore, gentamicin dosing interval data are ordinal
b
Three patients with 2 sets of gentamicin levels had a different diagnosis for each set of gentamicin levels. Therefore, the sum (%) of total indications is greater than 60 (100%) (i.e. 63 (105%))
c
Extrapolated concentration using first order pharmacokinetics
d
Each course of gentamicin may have had greater than one nephrotoxin or ototoxin, therefore, sum of individual nephrotoxins and ototoxins is greater than the total number of courses of gentamicin with a concomitant nephrotoxin or ototoxin
e
Nephrotoxin
f
Ototoxin
Table 2Bacterial Isolates Cultured at Time of Gentamicin Initiation
Number of gentamicin treatment courses 64 (4 patients had 2 separate gentamicin treatment courses)
Number of gentamicin treatment courses with a positive culture (%) 24 (37.5)
Number of gentamicin treatment courses that were Polymicrobial (2 or more bacterial isolates) (%)
7 (10.9)
Total Number of Isolatesn= 36 (%)a Source of Culture
Blood Cerebrospinal Fluid Endotracheal Tube Urine Eye Skin
Escherichia coli 7 (19) 4 (11) 1 (3) 1 (3) 1 (3) 0 0
Klebsiellaspecies 5 (14) 1 (3) 0 2 (6) 2 (6) 0 0
Pseudomonasspecies 2 (6) 0 0 1 (3) 0 1 (3) 0
Enterobacterspecies 1 (3) 0 0 0 0 0 1 (3)
Raoultellaspecies 1 (3) 0 0 0 0 0 1 (3)
Gram-positive organismsb 15 (42) 7 (19) 1 (3) 1 (3) 3 (9) 1 (3) 2 (6)
Otherc 5 (14) 0 0 5 (14) 0 0 0
a
All percentages are determined from total isolates (n= 36)
b
Total of 15 g positive organisms include coagulase-negativeStaphylococcus(12);Enterococcusspecies (1);Staphylococcus aureus(1) Group BStreptococcus(1)
c
both ke and Cl (L/h/kg) between the ≤850 g and
851-1200 g sub-groups (Table 4), and absence of
CART identified trees and breakpoints for the other MLR equation covariates (PNA and gender) supports the use of the simple weight range breakpoints of ≤850 g and 851-1200 g as the sub-groups for prac-tical and convenient empiric gentamicin dosing cal-culations in neonates.
Monte Carlo simulation
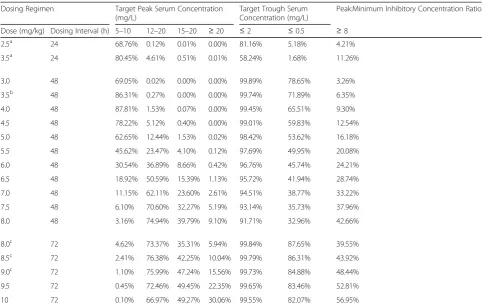
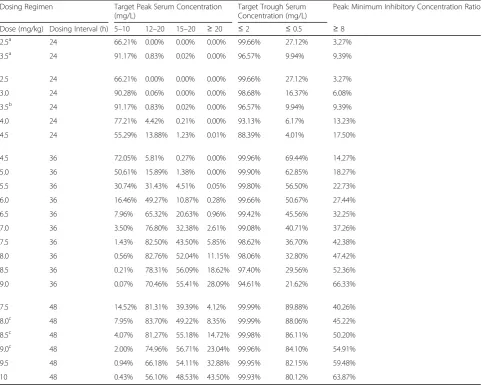
MCS of weight-based dosing regimens were per-formed for neonates weighing ≤850 g (Table 5) and those weighing between 851 and 1200 g (Table 6).
The MCS-identified optimal practical dosing regimens for conventional peaks (5–10 mg/L) and troughs (≤ 2 mg/L) were: 3.5 mg/kg given iv q48h in neonates
weighing ≤850 g (probability of target peak and
trough attainment of 86 and 100%, respectively) and q24h in neonates weighing 851 – 1200 g (probability of target peak and trough attainment of 91 and 97%, respectively). The MCS-identified optimal practical dosing regimens to produce higher peak concentra-tions of 12–20 mg/L and undetectable trough concen-trations (≤ 0.5 mg/L) were: 8-9 mg/kg dose given iv q72h in neonates weighing ≤850 g (probability of target peak and trough attainment of > 73 and > 85%, respectively) and given q48h in neonates between 851
Table 3Bivariate and Multivariable Analysis
Parametera Clearance (L/h) Volume of Distribution (L)
Bivariatep-value Multivariable p-value
Bivariatep-value Multivariablep-value
Post-natal age (Days) at gentamicin initiation < 0.0001 0.0001 0.0037 0.0563
Gender 0.0311 0.0447 0.0667 –
Weight at gentamicin initiation (g) < 0.0001 < 0.0001 < 0.0001 < 0.0001
Blood urea nitrogen at baseline (mmol/L) < 0.0001 0.5855 < 0.0001 0.6643
Serum creatinine at baseline (μmol/L) < 0.0001 0.0569 0.0011 0.4553
Concomitant nephrotoxins 0.0154 0.9332 0.0279 0.8204
a
Baseline values needed to be reported within 14 days prior to the initiation of gentamicin; if unavailable, first value taken during course of gentamicin was used as a surrogate
Bold data indicates statistically significantp-values for a given parameter with either bivariate or multivariable analysis
Table 4Mean pharmacokinetic parameters
≤ 850 g 851–1200 g > 1200 g p-valuea
n= 25 gentamicin levels in 25
patientsb npatients= 24 gentamicin levels in 23b npatients= 15 gentamicin levels in 13 Overall
p-value ≤850 g vs 851 − 1200 g ≤ 850 g vs > 1200 g 851 − 1200 g vs > 1200 g Mean 95% Confidence Interval
Range Mean 95% Confidence Interval
Range Mean 95% Confidence Interval
Range
Elimination rate constant (h−1)
0.06415 0.05762– 0.07068
0.0456– 0.1139
0.09087 0.08447– 0.09728
0.0652– 0.1327
0.09734 0.08519– 0.10948 0.05693– 0.14332 < 0.0001 < 0.001 < 0.001 > 0.05
Half-life (h) 10.8 9.8–11.8 6.1– 15.2
7.6 7.1–8.2 5.2– 10.6
7.1 6.0–8.2 4.8–12.2 – – – –
Volume of distribution (L)
0.36 0.33–0. 39 0.22– 0.51
0.51 0.46–0.57 0.33– 0.87
0.88 0.76–1.00 0.53– 1.23
–
Volume of distribution (L/ kg)
0.55 0.50–0.60 0.35– 0.83
0.50 0.46–0.54 0.38– 0.76
0.52 0.43–0.61 0.26– 0.96
0.2471 – – –
Clearance (L/h) 0.023 0.021–0.025 0.016– 0.038
0.047 0.041–0.053 0.028– 0.086
0.086 0.070–0.101 0.040–
0.137 – – – –
Clearance (L/h/ kg)
0.035 0.032–0.038 0.026– 0.056
0.045 0.041–0.049 0.032– 0.067
0.050 0.043–0.058 0.028– 0.081 < 0.0001 < 0.01 < 0.001 > 0.05
Multiple Comparison Test for data that did not pass the test for normality
a
ANOVA with Tukey-Kramer Multiple Comparisons Test for data that passed the test for normality or a Kruskal-Wallis Test with Dunn’s Multiple Comparison Test for data that did not pass the test for normality
b
One patient contributed 1 set of gentamicin levels to weight categories≤850 g and 851-1200 g
and 1200 g (probability of target peak and trough at-tainment of > 75 and > 84%, respectively).
Discussion
This retrospective pharmacokinetic study evaluated hospitalized neonates with normal renal function, and a median CGA at gentamicin initiation of < 28 weeks. Seventy-five percent of those included were born at ≤ 28 weeks gestation and 92% had a BW of < 1500 g. Gentamicin Cl (L/h) and Vd (L) were significantly as-sociated with weight at gentamicin initiation (≤ 850 g, 851-1200 g, and > 1200 g). Since no significant differ-ence in pharmacokinetics existed for neonates weigh-ing > 1200 g versus 851-1200 g, due to inadequate sample size in the largest weight category, we did not explore the > 1200 g sub-group further. No CART identified trees with breakpoints for the other MLR equation covariates (PNA and gender) existed. Based on the absence of CART identified trees and break-points for PNA and gender and the identification of a significant difference in both ke and Cl (L/h/kg) be-tween the ≤850 g and 851-1200 g sub-groups, the use of the simple weight range breakpoints of ≤850 g and
851-1200 g as the sub-groups for practical and
convenient empiric gentamicin dosing calculations in neonates is rational. Dosing of 3.5 mg/kg/dose admin-istered every 48 h for neonates weighing ≤850 g, and every 24 h for neonates weighing 851-1200 g provided the best probability of attaining conventional targets (peak:5-10 mg/L, trough:≤2 mg/L). Dosing of 8-9 mg/ kg/dose administered every 72 h in neonates weighing ≤850 g and every 48 h in neonates weighing 851-1200 g provided the best probability of attaining EID tar-gets (peak:12-20 mg/L, trough:≤0.5 mg/L).
The strengths of our study include the determin-ation of gentamicin pharmacokinetics in a large sam-ple of premature and low-birth weight neonates for whom data are currently lacking; the identification of significant covariates for Vd and Cl with determin-ation of practical weight breakpoints; the utilizdetermin-ation of MCS with 1 million iterations to develop simple initial gentamicin dosing nomograms for both con-ventional and EID for low-birth weight neonates with an excellent probability of target peak and trough at-tainment; and the provision of tables itemizing prob-abilities of target attainment (including Peak:MIC
Table 5Monte Carlo Simulation Results for Neonates Weighing≤850 g
Dosing Regimen Target Peak Serum Concentration (mg/L)
Target Trough Serum Concentration (mg/L)
Peak:Minimum Inhibitory Concentration Ratio
Dose (mg/kg) Dosing Interval (h) 5–10 12–20 15–20 ≥20 ≤2 ≤0.5 ≥8
2.5a 24 68.76% 0.12% 0.01% 0.00% 81.16% 5.18% 4.21%
3.5a 24 80.45% 4.61% 0.51% 0.01% 58.24% 1.68% 11.26%
3.0 48 69.05% 0.02% 0.00% 0.00% 99.89% 78.65% 3.26%
3.5b 48 86.31% 0.27% 0.00% 0.00% 99.74% 71.89% 6.35%
4.0 48 87.81% 1.53% 0.07% 0.00% 99.45% 65.51% 9.30%
4.5 48 78.22% 5.12% 0.40% 0.00% 99.01% 59.83% 12.54%
5.0 48 62.65% 12.44% 1.53% 0.02% 98.42% 53.62% 16.18%
5.5 48 45.62% 23.47% 4.10% 0.12% 97.69% 49.95% 20.08%
6.0 48 30.54% 36.89% 8.66% 0.42% 96.76% 45.74% 24.21%
6.5 48 18.92% 50.59% 15.39% 1.13% 95.72% 41.94% 28.74%
7.0 48 11.15% 62.11% 23.60% 2.61% 94.51% 38.77% 33.22%
7.5 48 6.10% 70.60% 32.27% 5.19% 93.14% 35.73% 37.96%
8.0 48 3.16% 74.94% 39.79% 9.10% 91.71% 32.96% 42.66%
8.0c 72 4.62% 73.37% 35.31% 5.94% 99.84% 87.65% 39.55%
8.5c 72 2.41% 76.38% 42.25% 10.04% 99.79% 86.31% 43.92%
9.0c 72 1.10% 75.99% 47.24% 15.56% 99.73% 84.88% 48.44%
9.5 72 0.45% 72.46% 49.45% 22.35% 99.65% 83.46% 52.81%
10 72 0.10% 66.97% 49.27% 30.06% 99.55% 82.07% 56.95%
a
Dosing regimens recommended at Sunnybrook at time of study:≤27 weeks corrected gestational age (CGA): 2.5 mg/kg q24h; 28–32 weeks CGA: 3.5 mg/kg q24h; 33–34 wks CGA: 4.5 mg/kg q24h
b
Recommended dosing to target gentamicin concentrations: Peak 5-10 mg/L and Trough < 2 mg/L
c
ratio) for a range of potential dosing options enabling institutional selection of initial dosing guidelines based on their GNB susceptibility patterns and de-sired target serum concentrations. In addition, our rigorous study design which limited the inclusion of gentamicin levels to those with a confirmed time for dose administration and serum sampling increases the validity of our results.
The weaknesses of our study include its retrospective design and associated risk of unrecognized confounders; the inability to generalize our results to neonates > 1200 g and SGA infants; and the risk of incomplete gentami-cin distribution at time of sampling for peak
concentra-tions. However, since our mean pharmacokinetic
parameters were comparable to those reported in other studies [15], our sampling practice is unlikely to have af-fected the validity of our results.
Similar to other pharmacokinetic studies, our
multivariable analysis indicated that the Vd of gentamicin in neonates is associated with body weight [15,18–20,28,29]. Pharmacokinetic studies have identified that extracellular fluid volume correlates closely with bodyweight [35].
Our multivariable analysis indicated that gentamicin clearance in neonates is associated with PNA, as well as bodyweight, and gender. The correlation between PNA and gentamicin elimination has been previously reported in the literature [19, 28, 29], and is ex-plained by the maturation of renal function in neo-nates. Since glomerulogenesis proceeds until 32–34 weeks gestation, preterm neonates are expected to have a reduced rate of glomerular filtration compared to their mature counterparts [36]. In the first 48–72 h of life there is a marked increase in glomerular filtra-tion rate of full term newborns to rates of 8–20 ml/
Table 6Monte Carlo Simulation Results for Neonates Weighing Between 851 and 1200 g
Dosing Regimen Target Peak Serum Concentration (mg/L)
Target Trough Serum Concentration (mg/L)
Peak: Minimum Inhibitory Concentration Ratio
Dose (mg/kg) Dosing Interval (h) 5–10 12–20 15–20 ≥20 ≤2 ≤0.5 ≥8
2.5a 24 66.21% 0.00% 0.00% 0.00% 99.66% 27.12% 3.27%
3.5a 24 91.17% 0.83% 0.02% 0.00% 96.57% 9.94% 9.39%
2.5 24 66.21% 0.00% 0.00% 0.00% 99.66% 27.12% 3.27%
3.0 24 90.28% 0.06% 0.00% 0.00% 98.68% 16.37% 6.08%
3.5b 24 91.17% 0.83% 0.02% 0.00% 96.57% 9.94% 9.39%
4.0 24 77.21% 4.42% 0.21% 0.00% 93.13% 6.17% 13.23%
4.5 24 55.29% 13.88% 1.23% 0.01% 88.39% 4.01% 17.50%
4.5 36 72.05% 5.81% 0.27% 0.00% 99.96% 69.44% 14.27%
5.0 36 50.61% 15.89% 1.38% 0.00% 99.90% 62.85% 18.27%
5.5 36 30.74% 31.43% 4.51% 0.05% 99.80% 56.50% 22.73%
6.0 36 16.46% 49.27% 10.87% 0.28% 99.66% 50.67% 27.44%
6.5 36 7.96% 65.32% 20.63% 0.96% 99.42% 45.56% 32.25%
7.0 36 3.50% 76.80% 32.38% 2.61% 99.08% 40.71% 37.26%
7.5 36 1.43% 82.50% 43.50% 5.85% 98.62% 36.70% 42.38%
8.0 36 0.56% 82.76% 52.04% 11.15% 98.06% 32.80% 47.42%
8.5 36 0.21% 78.31% 56.09% 18.62% 97.40% 29.56% 52.36%
9.0 36 0.07% 70.46% 55.41% 28.09% 94.61% 21.62% 66.33%
7.5 48 14.52% 81.31% 39.39% 4.12% 99.99% 89.88% 40.26%
8.0c 48 7.95% 83.70% 49.22% 8.35% 99.99% 88.06% 45.22%
8.5c 48 4.07% 81.27% 55.18% 14.72% 99.98% 86.11% 50.20%
9.0c 48 2.00% 74.96% 56.71% 23.04% 99.96% 84.10% 54.91%
9.5 48 0.94% 66.18% 54.11% 32.88% 99.95% 82.15% 59.48%
10 48 0.43% 56.10% 48.53% 43.50% 99.93% 80.12% 63.87%
a
Dosing regimens recommended at Sunnybrook at time of study:≤27 weeks corrected gestational age (CGA): 2.5 mg/kg q24h; 28–32 weeks CGA: 3.5 mg/kg q24h; 33–34 wks CGA: 4.5 mg/kg q24h
b
Recommended dosing to target gentamicin concentrations: Peak 5-10 mg/L and Trough < 2 mg/L
c
min, compared with increases in preterm neonates of only 2–3 ml/min [35, 37]. The half-life of elimination of gentamicin is therefore expected to decrease with increasing PNA because it is renally eliminated [37], as evidenced in our study. In addition, bodyweight likely serves as a surrogate marker for physiological maturity. Therefore, it is expected that the half-life of elimination of gentamicin decreases as body weight increases. This relationship was demonstrated in our study, as well as in previously published literature [15, 18–20, 29].
CART analysis confirmed breakpoints for weight at gentamicin initiation for both Vd and Cl and demon-strated that neonates had altered Vd (L) and Cl (L/h) based on these weight breakpoints. This allowed the use of the CART derived weight breakpoints (≤850 g and 851-1200 g) to divide our data into homogenous patient sub-groups for practical empiric gentamicin dosing recommendations and provides a new and convenient nomogram for gentamicin dosing (either conventional or EID) with a MCS demonstrated high probability of target attainment. The mean gentami-cin Vd (0.55 L/kg and 0.50 L/kg for neonates
weigh-ing ≤850 g and 851-1200 g, respectively) and Cl
(0.035 L/h/kg and 0.045 L/h/kg, for neonates weighing ≤850 g and 851-1200 g, respectively) identified in this study are comparable to those reported in a study of infants born at less than 28 weeks gestation (Vd = 0.50 L/kg and Cl = 0.032 L/h/kg) [15].
Our study confirms previous reports [2, 27, 38] that GNB, particularly E coli, are emerging as the leading cause of systemic infections in neonates. Re-cent microbiological reports of E coli isolates from Canadian pediatric patients report a mean MIC90 of 2 mg/L for gentamicin [33]. Therefore, to meet the PK/PD target of a peak: MIC ratio between 8 and 10, peak gentamicin concentrations should range from 16 to 20 mg/L. A single published study ap-proximates these recommendations by targeting a peak concentration of 15–20 mg/L in neonates [19]. In this study, initial doses of 10 mg/kg administered at 36 h intervals were used in term newborns and 12 mg/kg doses administered every 48 h were used in premature neonates (GA 31–38 weeks) [19]. Our MCS derived initial EID recommendations for genta-micin of 8-9 mg/kg/dose administered every 72 h in neonates weighing ≤850 g and every 48 h in neonates weighing 851-1200 g has > 73% probability of attain-ing a peak between 12 and 20 mg/L and > 84% prob-ability of attaining a trough of ≤0.5 mg/L. Our work is further supported by results from a recent study concluding that a prolonged dosing interval for gen-tamicin ranging from 36 to 72 h was appropriate for neonates weighing less than 1000 g [25]. However,
our results provide a new easy to use gentamicin dosing nomogram for both conventional and EID gentamicin with a MCS demonstrated high probabil-ity of target attainment, which has not previously been completed for neonates. In all cases the weight based initial dosing recommendations derived in our study provided a better probability of target attain-ment than the CGA-based gentamicin dosing regi-mens used at our institution at the time of this study conduct. In 2014 our centre changed its genta-micin dosing practice to adopt the weight based nomogram developed in this study; where EID is now predominantly used for NICU babies. We have received positive feedback about the simplicity, safety and efficacy of the nomogram from our NICU physi-cians and pharmacists. Plans are underway to evalu-ate the safety, efficacy and health care personnel workload of the weight based nomograms for con-ventional and EID using a pragmatic study design.
Although the study by Lanao et al [19] was pub-lished in 2004, higher peak concentration targets have not been routinely adopted by clinicians. Therefore, we chose to report the probabilities of achieving a range of peak gentamicin concentrations with various dosing regimens because GNB MICs, along with de-sired target peak concentrations, may vary among hospitals. Our MCS dosing tables may assist clinicians in choosing a gentamicin dosing regimen that would be optimal based on their institutional MIC patterns for relevant GNB, such as E. coli.
Conclusions
Appendix 2
First Order Pharmacokinetic Equations:
1. k¼‐ðln Cobs:min‐ln Cobs:maxÞ
tmintmax ;t1=2¼0:693=k
2. Cext:max¼Cobs:max
e‐ktmax
3. Cext:min¼Cext:maxx e‐kðt‐t0Þ
4. V¼ Dose x½1‐e‐kt
0
kt0 ½Cext:max‐Cext:minx e‐kt0
5. Suggested Dosing Interval:
t¼‐1=k ln C
des:minssþt0
Cdes:maxss
Round to 4, 6, 8, 12, 16, 18, 24 etc.
6. Suggested Maintenance Dose:
Dose¼kVCdes:maxssx 1‐e
‐kt x t0
1‐e‐kt0
7. Predicted Peak
Cpred:maxss¼
Dose x 1 ‐e‐kt0
t0kV x 1ð ‐e‐ktÞ
8. Predicted Trough
Cpred:minss¼Cpred:maxss e‐k tð Þ‐t0
Key:
k= elimination rate constant (h-1) ; t1/2= half-life (h)
Cobs.min& Cobs.max= observed minimum and maximum concentrations
tmin & tmax = time post infusion (in hours) of observed minimum and maximum concentrations Cext.min& Cext.max= extrapolated or actual minimum and maximum concentrations
V=volume of distribution (L); t = dosing interval in hours ; t' = infusion time in hours
Cdes.minss& Cdes.maxss= desired minimum and maximum concentrations at steady state
Cpred.minss& Cpred.maxss= predicted minimum and maximum concentrations at steady state
Abbreviations
ANOVA:Analysis of variance; BUN: Blood urea nitrogen; BW: Birth weight; CART: Classification and regression tree; CGA: Corrected gestational age; CI: Confidence interval; Cl: Clearance; EID: Extended-interval dosing; GA: Gestational age; GNB: Gram negative bacteria; ke: Elimination rate constant; MCS: Monte Carlo Simulation; MIC: Minimum inhibitory
concentration; MLR: Multiple linear regression; NICU: Neonatal intensive care unit; PK: Pharmacokinetic; PNA: Post-natal age; sCr: Serum creatinine; SD: Standard deviation; SGA: Small for gestational age; SHSC: Sunnybrook Health Sciences Centre; t1/2: Half-life; TDM: Therapeutic drug monitoring;
Vd: Volume of distribution
Acknowledgements
Dr. Alex Kiss, Research Design and Biostatistics, Sunnybrook Health Sciences Centre for his assistance with the statistical analysis.
Authors’contributions
SW conceived the project idea, was the project supervisor and is the senior investigator. SW, MB, ME, DI, CF, WS and EN contributed to the design of the study and manuscript development. SW, MB and ME were responsible for development of the data collection tool. MB, and ME completed the data collection. SW along with MB analyzed the results. All authors read and approved the final manuscript.
Funding
This research received no specific grant from any funding agency in the public, commercial or not-for-profit sectors.
Availability of data and materials
The datasets used and/or analysed during the current study are available from the corresponding author on reasonable request.
Ethics approval and consent to participate
This study was approved by the Sunnybrook Health Sciences Centre (SHSC) Research Ethics Board on February 3, 2014 (Project Identification Number 038–2014), and was conducted in accordance with the Declaration of Helsinki and national and institutional standards.
Appendix 1
Table 7 Sunnybrook Health Sciences Centre’s Dosing Recommendations for Gentamicin in Neonates at Time of Study (2013)
Corrected Gestational Age [Weeks] Dose [mg/kg] Dosing Interval [Hours] Administration Technique Serum Concentration Sampling
< 28 2.5 24 1 h infusion Immediately following end of infusion
28–32 3.5 24 1 h infusion Immediately following end of infusion
33–34 4 24 1 h infusion Immediately following end of infusion
35–36 2 12 Intravenous bolus 30 min following bolus
Consent for publication Not applicable.
Competing interests
The authors declare that they have no competing interests.
Author details
1Department of Pharmacy, Sunnybrook Health Sciences Centre, 2075 Bayview Avenue, E-302, Toronto, ON M4N 3M5, Canada.2Leslie L. Dan Faculty of Pharmacy, University of Toronto, Toronto, ON, Canada.3Division of Infectious Diseases, Sunnybrook Health Sciences Centre, Toronto, ON, Canada.4Sunnybrook Health Sciences Centre Research Institute, Toronto, ON, Canada.5Women and Babies Program, Sunnybrook Health Sciences Centre, Toronto, ON, Canada.6Department of Pharmacy, Hospital for Sick Children, Toronto, ON, Canada.7Department of Paediatrics, University of Toronto, Toronto, ON, Canada.8Present Address: Grandview Medical Centre Family Health Team, 167 Hespeler Rd, Cambridge, ON N1R 3H7, Canada.
Received: 16 April 2019 Accepted: 19 August 2019
References
1. Contopoulos-Ioannidis DG, Giotis ND, Baliatsa DV, Ioannidis JP. Extended -interval aminoglycoside administration for children: a meta-analysis. Pediatrics. 2004;114(1):e111–8.https://doi.org/10.1542/peds.114.1.e111. 2. Touw DJ, Westerman EM, Sprij AJ. Therapeutic drug monitoring of
aminoglycosides in neonates. Clin Pharmacokinet. 2009;48(2):71–88.https:// doi.org/10.2165/0003088-200948020-00001.
3. Moore RD, Lietman PS, Smith CR. Clinical response to aminoglycoside therapy: importance of the ratio of peak concentration to minimal inhibitory concentration. J Infect Dis. 1987;155(1):93–9.https://doi.org/10.1 093/infdis/155.1.93.
4. Begg EJ, Peddie BA, Chambers ST, Boswell DR. Comparison of gentamicin dosing regimens using an in-vitro model. J Antimicrob Chemother. 1992; 29(4):427–33.https://doi.org/10.1093/jac/29.4.427.
5. Nicolau DP, Freeman CD, Belliveau PP, Nightingale CH, Ross JW, Quintiliani R. Experience with a once-daily aminoglycoside program administered to 2,184 adult patients. Antimicrob Agents Chemother. 1995;39(3):650–5.
https://doi.org/10.1128/AAC.39.3.650.
6. Miron D. Once daily dosing of gentamicin in infants and children. Pediatr Infect Dis J. 2001;20(12):1169–73.
7. Bailey TC, Little JR, Littenberg B, Reichley RM, Claiborne DW. A meta-analysis of extended-interval dosing versus multiple daily dosing of
aminoglycosides. Clin Infect Dis. 1997;24:786–95.https://doi.org/10.1093/ clinids/24.5.786.
8. Ali MZ, Goetz MB. A meta-analysis of the relative efficacy and toxicity of single daily dosing versus multiple daily dosing of aminoglycosides. Clin Infect Dis. 1997;24:796–809.https://doi.org/10.1093/clinids/24.5.796. 9. Munckhof WJ, Grayson ML, Turnidge JD. A meta-analysis of studies on the
safety and efficacy of aminoglycosides given either once daily or as divided doses. J Antimicrob Chemother. 1996;37:645–63.https://doi.org/10.1093/ jac/37.4.645.
10. Barza M, Ioannidis JP, Cappelleri JC, Lau J. Single or multiple daily doses of aminoglycosides: a meta-analysis. BMJ. 1996;312:338–45.https://doi.org/1 0.1136/bmj.312.7027.338.
11. Nestaas E, Bangstad HJ, Sandvik L, Wathne KO. Aminoglycoside extended interval dosing in neonates is safe and effective: a meta-analysis. Arch Dis Child Fetal Neonatal Ed. 2005;90(4):F294–300.https://doi.org/10.1136/adc.2 004.056317.
12. Rao SC, Srinivasjois R, Moon K. One dose per day compared to multiple doses per day of gentamicin for treatment of suspected or proven sepsis in neonates. Cochrane Database Syst Rev. 2016;12:CD005091.https://doi.org/1 0.1002/14651858.CD005091.pub4.
13. Skopnik H, Heimann G. Once daily aminoglycoside dosing in full term neonates. Pediatr Infect Dis J. 1995;14(1):71–2.
14. Hayani KC, Hatzopoulos FK, Frank AL, Thummala MR, Hantsch MJ, Schatz BM, John EG, Vidyasagar D. Pharmacokinetics of once-daily dosing of gentamicin in neonates. J Pediatr. 1997;131(1):76–80.https://doi.org/10.1 016/S0022-3476(97)70127-6.
15. DiCenzo R, Forrest A, Slish JC, Cole C, Guillet R. A gentamicin pharmacokinetic population model and once-daily dosing algorithm for
neonates. Pharmacotherapy. 2003;23(5):585–91.https://doi.org/10.1592/ phco.23.5.585.32196.
16. Thingvoll ES, Guillet R, Caserta M, Dicenzo R. Observational trial of a 48-hour gentamicin dosing regimen derived from Monte Carlo simulations in infants born at less than 28 weeks' gestation. J Pediatr. 2008;153(4):530–4.https:// doi.org/10.1016/j.jpeds.2008.04.060.
17. Lundergan FS, Glasscock GF, Kim EH, Cohen RS. Once-daily gentamicin dosing in newborn infants. Pediatrics. 1999;103(6):1228–34.
18. Stickland MD, Kirkpatrick CM, Begg EJ, Duffull SB, Oddie SJ, Darlow BA. An extended interval dosing method for gentamicin in neonates. J Antimicrob Chemother. 2001;48(6):887–93.https://doi.org/10.1093/ jac/48.6.887.
19. Lanao JM, Calvo MV, Mesa JA, Martin-Suarez A, Carbajosa MT, Miguelez F, Dominguez-Gil A. Pharmacokinetic basis for the use of extended interval dosage regimens of gentamicin in neonates. J Antimicrob Chemother. 2004;54(1):193–8.https://doi.org/10.1093/jac/dkh261.
20. García B, Barcia E, Pérez F, Molina IT. Population pharmacokinetics of gentamicin in premature newborns. J Antimicrob Chemother. 2006;58(2): 372–9.https://doi.org/10.1093/jac/dkl244.
21. Vervelde ML, Rademaker CM, Krediet TG, Fleer A, van Asten P, van Dijk A. Population pharmacokinetics of gentamicin in preterm neonates: evaluation of a once-daily dosage regimen. Ther Drug Monit. 1999;21(5):514–9. 22. Begg EJ, Vella-Brincat JW, Robertshawe B, McMurtrie MJ, Kirkpatrick CM,
Darlow B. Eight years' experience of an extended-interval dosing protocol for gentamicin in neonates. J Antimicrob Chemother. 2009;63(5):1043–9.
https://doi.org/10.1093/jac/dkp073.
23. Hansen A, Forbes P, Arnold A, O'Rourke E. Once-daily gentamicin dosing for the preterm and the term newborn: proposal for a simple regimen that achieves target levels. J Perinatol. 2003;23(8):635–9.https://doi.org/10.1038/sj.jp.7210996. 24. Hoff DS, Wilcox RA, Tollefson LM, Lipnik PG, Commers AR, Liu M.
Pharmacokinetic outcomes of a simplified, weight-based, extended interval gentamicin dosing protocol in critically ill neonates. Pharmacotherapy. 2009; 29(11):1297–305.https://doi.org/10.1592/phco.29.11.1297.
25. Valitalo PAJ, van den Anker JN, Allegaert K, de Cock RFW, de Hoog M, Simons SHP, Mouton JW, Knibbe CAJ. Novel model-based dosing guidelines for gentamicin and tobramycin in preterm and term neonates. J Antimicrob Chemother. 2015;70(7):2074–7.https://doi.org/10.1093/jac/dkv052. 26. Alshaikh B, Dersch-Mills D, Taylor R, Akierman AR, Yusuf K. Extended interval
dosing of gentamicin in premature neonates≤28-week gestation. Acta Paediatr. 2012;101:1134–9.
27. Shah P, Lee S, Yoon E, Param Y, Members of the Annual Report Review Committee. Canadian Neonatal Network (CNN). The Canadian Neonatal Network Annual Report 2012. Available at:http://www.
canadianneonatalnetwork.org/Portal. Accessed 25 May 2018.
28. Nielsen EI, Sandström M, Honoré PH, Ewald U, Friberg LE. Developmental pharmacokinetics of gentamicin in preterm and term neonates: population modelling of a prospective study. Clin Pharmacokinet. 2009;48(4):253–63.
https://doi.org/10.2165/00003088-200948040-00003.
29. Fuchs A, Guidi M, Giannoni E, Werner D, Buclin T, Widmer N, Csajka C. Population pharmacokinetic study of gentamicin in a large cohort of premature and term neonates. Br J Clin Pharmacol. 2014;78(5):1090–101.
https://doi.org/10.1111/bcp.12444.
30. Sunnybrook Health Sciences Centre. About Sunnybrook - Facts and Figures. Available at:https://sunnybrook.ca/content/?page=statistics. Accessed 16 May 2018.
31. Elligsen M, Walker SAN, Simor A, Daneman N. Prospective audit and feedback of antimicrobial stewardship in critical care: program implementation, experience, and challenges. Can J Hosp Pharm. 2012;65(1):31–6. 32. CLSI. Performance standards for antimicrobial susceptibility testing; 25th
informational supplement. CLSI document M100-S25. Wayne: Clinical and laboratory Standards Institute; 2015.
33. Adam HJ, Baxter MR, Davidson RJ, Rubinstein E, Fanella S, Karlowsky JA, Lagace-Wiens PRS, Hoban DJ, Zhanel GG. Comparison of pathogens and their antimicrobial resistance patterns in pediatric, adult and elderly patients in Canadian hospitals. J Antimicrob Chemother. 2013;68(Suppl 1):i31–7.
https://doi.org/10.1093/jac/dkt024.
34. World Health Organization. International statistical classification of diseases and related health problems, tenth revision, 2nd ed. World Health Organization; 2004.
interface (part I). Clin Pharmacokinet. 1988;14:189–216.https://doi.org/1 0.2165/00003088-198814040-00001.
36. Schmidt IM, Chellakooty M, Boisen KA, Damgaard IN, Mau Kai C, Olgaard K, Main KM. Impaired kidney growth in low-birth-weight children: distinct effects of maturity and weight for gestational age. Kidney Int. 2005;68(2): 731–40.https://doi.org/10.1111/j.1523-1755.2005.00451.x.
37. Besunder JB, Reed MD, Blumer JL. Principles of drug biodisposition in the neonate. A critical evaluation of the pharmacokinetic-pharmacodynamic interface (part II). Clin Pharmacokinet. 1988;14:261–86.https://doi.org/1 0.2165/00003088-198814040-00001.
38. Stoll BJ, Hansen N, Fanaroff AA, Wright LL, Carlo WA, Ehrenkranz RA, Lemons JA, Donovan EF, Stark AR, Tyson JE, Oh W, Bauer CR, Korones SB, Shankaran S, Laptook AR, Stevenson DK, Papile L, Poole WK. Changes in pathogens causing early-onset sepsis in very-low-birth-weight infants. N Engl J Med. 2002;347(4):240–7.https://doi.org/10.1056/NEJMoa012657.
Publisher’s Note