7049
Factors Affecting Market Capitalization: A
Practical Study Ase 1978-2019
Mohammad Abdel Mohsen Al-Afeef
Abstract: This study aimed to investigate the most factors that affect market capitalization. The study was applied to all companies listed on Amman Stock Exchange (ASE) for the period (1978-2019), as a case study. Secondary data were collected from (ASE), and the analytical method was followed by using the multiple regression models through a statistical program (SPSS). The result shows that there is a statistically significant effect of (No. of Transactions, Turnover Ratio, EPS, Dividend Yield Ratio, P/BV, P/E) as independent factors on the market capitalization as a dependent factor, the explanatory power of the model was (Adjusted R Square = 87%), which means that (87%) of the changes in Market Capitalization are due to the independent factors used in this study, and (13%) of the changes due to other factors. In addition, the sub hypotheses of the study were tested to find the effect of factors individually on the market capitalization. The results shows that there is a statistically significant effect for each of (No. of Transactions, EPS, Dividend Yield Ratio, P / E), on the market capitalization, as well as there is no statistically significant effect for each of the factors (Turnover Ratio, P/BV) on the market capitalization. The results of this study need to be adopted to help analysts and investors make informed investment decisions because this study used more factors than previous studies for a long period of time and for all companies listed on the ASE.
Keywords: ASE, Analysis, Finance, Financial Ratios, Market Capitalization.
—————————— ——————————
1.
INTRODUCTION
Theorists in the field of financial management found that the goal of profit maximization is one of the factors of success in the short term as it is an important indicator from the standpoint of creditors and a tool to measure the efficiency of management in the operational and financial aspects (Al-Afeef, 2017). However, profit is insufficient to express the elements of business continuity from the perspective of shareholders. Hence, the strategic objective of financial management, which is to maximize the wealth of owners by maximizing the prices of the company's shares in the stock exchange has become greater than the profit target because it represents the results of financial and operational decisions in investment, and ensuring economic prosperity and desired social value. (Weston & brigham, 1993, p16), (Naimi, &
Tamimi, 2009).
For the owners and investors’ satisfaction, and to demonstrate the strength of companies in the market, management has been interested in conducting important financial analyzes by resorting to a number of financial indicators whose results reveal the form of strategic performance of the company's management. The high values of these indicators in the market mean that the management of the company has strengths in the strategic position. While the decline and deterioration in the values of these indicators indicate poor performance and this is an important input to financial analysis in the evaluation of strategic performance, the strengths indicate positive characteristics and advantages, and also give a performance advantage that supports their strengths, (Zubaidi, 2004).
2.
THEORY
AND
HYPOTHESIS
Theoretical framework: According to the above, the financial analyst has a set of important ratios called valuation ratios or re-investment ratio or market ratios. The importance of these ratios emerges from its form, which links the market value of the common stock with its expected future returns and its book value. The researcher believes that there are a number of factors, including market indicators, which can have a direct impact on market capitalization, which is an important criterion for all exchange traders to help predict future stock price trends. Shares that are constantly growing in their market value more attractive to investors because it is an indicator of the healthy performance of businesses and achieve high returns, (Naimi, 2009). The study of securities prices’ movement is important in the world of finance and investment, and monitoring the level or the movement of stock prices is imperative. Therefore, Investment in the market stoke exchange requires the investor to be familiar with the various information likely to affect the price of the securities, the availability of such information and analysis in a timely reflected in the price of the securities. Amman Stock Exchange
(ASE), reflects the reality of the economic situation of the State and the situation of the listed companies. So since the last century due to the great development that took place in the ASE, and because of the large fluctuations in the prices of the stocks, especially during the past two decades, many researchers have tried to describe the factors behind the changes in the prices of securities. They tried to study and explain that because they believe that it is important in predicting the movement of stock prices. ASE faces economic volatility and is surrounded by political disputes, lack of transparency, social conditions, accounting standards, and investor safety, all of which exposed Jordan to external economic fluctuations. Statistics show that ASE has developed rapidly in terms of size and value, (Abdul-Khaliq, 2013). Trading value increased rapidly from only 302.8 JD million in 1991 to 20318.0 JD million in 2008, but decreased to 2,319 JD million in 2018, indicating the volatile economic growth in Jordan, (ASE, 2019).
There is a lot of scientific debate and studies about the factors that may affect the market value of companies, the results were different according to the nature of the study, the variables and the study society. Here are studies that have
been reviewed by the researcher; study of Ligocka & Stavarek (2019) aims at examining the impact of some financial ratios,
macroeconomic and microeconomic factors on the stock price
————————————————
7050
movement of a group of food companies in the European market, the result showed an impact of the EPS on the market value of the stock.
In addition to this, Bratamanggala (2018) uses the secondary data of the Indonesian stock exchange to find the effect of EPS, P/BV, and ROA on the stock market price. The results showed that there is a significant impact of P/BV, EPS on the stock market price. Hasan (2018) examines the impact of dividends and oil prices on the movement of shares prices for 40 companies listed on the Saudi stock market. The results of the study showed the impact of these two factors on the movement of stocks prices. Warrad (2017) examines the impact of EPS, DPS, BV, P/E, P/BV, and the dividend yield ratio on the Jordanian banking sector. The study shows an effect of EPS, P/E, P/BV. Additionally, (Bhargava, 2016) Conducted a study that showed the relationship between macroeconomic variables and the stocks market value. One of the most important results of this study is a negative correlation between oil prices and stock prices, a positive correlation between inflation and share prices. (Qaisi (2016) aims to find the effect of a combination of factors on the market value of insurance companies in the ASE. The study proved that there is an impact on the return on assets, age of the company, size of the company, the ratio of debt to market value, and Property. Moreover, Abdus Salam (2015) conducted a study to test the impact of some factors on the shares market value in Bangladesh. The study showed that in the industry sector, market performance, company performance, investor decision, financial considerations, and EPS, are the most important factors that affect shares prices is EPS. Emamgholipour (2013) examines the impact of EPS, BV, P/BV, for 80 companies listed on Tehran Stock Exchange. The study proved that there is an impact of all the factors mentioned on the shares market prices. Sharif (2015) examines the impact of ROA, BV, EPS, DPS and the dividend yield ratio, and company's size on the shares prices of listed companies in the Bahrain stock exchange, where the study found the impact of BV, DPS and the dividend yield, EPS, Company size.
2.1.
VARIABLES
There is nothing to prevent financial managers from using information that is not in the financial statements of their companies. They believe that it is useful to look at the ratios that combine accounting information represented by financial statements and market information represented by stock prices or market capitalization. The market value is of particular interest to many parties, especially shareholders and potential investors in stocks who are interested in knowing the impact of the company's performance on the expected returns on their investments. In addition to this, the main study factors addressed by the researcher were the following:
Market Capitalization: Market value is one of the most important indicators pointing to the health of companies, and an important indicator for measuring the efficiency and development of markets (Juaijati & Rafiaa, 2007). It is also important for managers, in raising the level of market value of shares because it is a strategic goal aspired by them and the reason for increasing the wealth of owners and increase the size of the company. The market value can be calculated as: (Investopedia, 2019). (Khrawish, el al, 2010).
( ) ( )
Source: Prepared by the researcher based on data in
Amman Stock Exchange 2019.
No. of Transactions: The number of contracts concluded reflect the number of transactions bought and sold that took place on the shares traded in the stock exchange, and this indicator is important for technical analysts as it is the driving force behind the movement of prices, and a mirror of the extent of dealers' appetite for buying and selling and the abundance of trading, trading volume is affected by many macro and microeconomic factors (Mishal, 2015). The measurement of this variable based on the number of contracts or deals (buy and sell), which was made on shares traded on the stock exchange during the study period.
Turnover Ratio: The turnover rate is primarily aimed at measuring the degree of liquidity of shares or financial markets in general. It can be calculated by the value of shares traded for the company divided by the market value of all its shares during the same period, or by the number of shares traded during the period divided by the number of shares subscribed during the same period. The researcher was adopted on the following mathematical equation to calculate the value of this variable during the study period: (Arab Monetary Fund, 2014).
( ) Earnings per share (EPS): ‘Earnings per share’ is a very important measure of the company's profitability. In fact, in the whole subject of fundamental analysis, EPS is the only criterion that isolates net income to see what shareholders gain by investing in the company. The ever-growing earnings per share indicates EPS growth and the company creates value for investors. It represents the payable amount of profit per share by the company as well as the payable amount of profit to the shareholder, Earnings per share can be calculated using the following formula: (Islam, el al, 2014).
.
2,000.00 4,000.00 6,000.00 8,000.00 10,000.00 12,000.00 14,000.00 16,000.00 18,000.00 20,000.00 22,000.00 24,000.00 26,000.00 28,000.00 30,000.00
197819811984198719901993199619992002200520082011201420172020
Market Capitalization
(MJD)
7051
( )
Dividend Yield Ratio: It is simply the expected dividend as a percentage of the stock market price, Dividend yield ratios of this study are defined as follows :(Haddad, 2015).
( )
Price to Book Value (P/BV): The price to book value of the company represents an important indicator that provides useful information about the performance of companies. (Haddad 2015) says companies that have a high return on assets and equity have a relatively higher market value than their book value compared with companies that have low returns. The underlined importance of this percentage is due to the book value set out on the basis of the historical cost and price, which is an indicator for the current value. Hence, P/B ratio measures the current property value to costs. The market value to book value can be found by using the following equation: (Marangu & Jagongo, 2014).
( ) P/E Ratio: This concept reflects the relationship between share price and its earnings. This ratio is important because the investor can calculate the period required to recover his investment in the company's shares and the extent of the ability of the earnings to cover the per-share price. The high percentage reflects the positive trend of financial markets and the quality and stability of the company (Warrad, 2017). P/E ratio reflects how the market estimates the company's expected future earnings and risks. When investors expect growth in future dividends to be distributed by the company, they are willing to pay a higher share price, which increases the ratio, and vice versa. Therefore, the management of the company prefers to have a high price-to-earnings ratio because this is an indication of high profits, lower risks, or both for the investors, (Haddad, 2015).
Financial analysts classify shares with a high P/E ratio as Growth Stock, generally, companies that are expected to have higher growth in the future profit will have higher P/E, and this explains why shares with a high proportion of P/E called Growth Stock. The low P/E ratio stock called Value Stocks, due to the price of those stocks is "Cheap" in comparing to their current profit. This means that these shares could be a good investment opportunity as it is inexpensive (Amman Stock Exchange, 2019).
2.2.
HYPOTHESIS
The researcher formulated the hypotheses of the study in one main hypothesis and six sub-hypotheses, as follows:
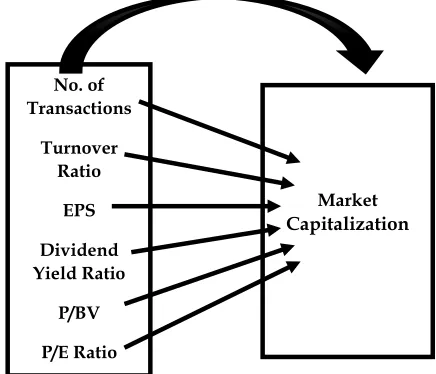
Main hypothesis: H01: There is no statistically significant effect of (No. of Transactions, turnover Ratio, EPS, dividend yield ratio, P/BV, P/E Ratio) on the market capitalization in ASE.
Sub-hypotheses:
H01: There is no statistically significant effect of No. of Transactions on the market capitalization in ASE.
H02: There is no statistically significant effect of turnover Ratio on the market capitalization in ASE.
H03: There is no statistically significant effect of EPS on the market capitalization in ASE.
H04: There is no statistically significant effect of dividend yield ratio on the market capitalization in ASE.
H05: There is no statistically significant effect of P/BV on the market capitalization in ASE.
H06: There is no statistically significant effect of P/E Ratio on the market capitalization in ASE.
Source: Researcher, 2019.
Mathematical framework: Based on the problem of the study, the researcher uses the mathematical model (multiple linear regression model) represented in equation (7), to test the hypotheses of the study related to detect the impact of the factors selected in this study on the market value and its application in (ASE), this model is one of the best models for this The purpose is as follows:(Bratamanggala, 2018).
( )
Where:
Y = Market Capitalization X1 = No. of Transactions X2 = Turnover Ratio
X3 = Earnings per share (EPS) X4 = Dividend Yield Ratio X5 = Price/Book Value (P/BV) X6 = P/E Ratio (times) a = Constant
β1 – β6 = Regression coefficients e = Error term.
3.
RESEARCH
METHODOLOGY:
The researcher used the descriptive and analytical approach based on the multiple regression model as an important model in testing the effect of independent factors on the dependent factor in the study model. The statistical program (SPSS) was used to achieve this goal.
Market Capitalization No. of
Transactions
Turnover Ratio
EPS
Dividend Yield Ratio
P/BV
P/E Ratio
7052
The data used in the analysis are financial and market data for all listed companies, secondary data for all sectors and companies during the period (1978-2018), the researcher also relied on previous literature on the subject.
4.
STATISTICAL
ANALYSIS:
Before starting the hypotheses test, the researcher calculated the correlation between the independent variables and made sure that there is no strong relationship between them, so the analysis process was continued.
Table 1. Model Summary. R R Square Adjusted
R Square F Sig. .
944a . 890 . 871 46.050 0.000b a. Market Capitalization
b: Predictors: (Constant), No. of Transactions, Turnover Ratio, EPS, Dividend Yield Ratio, P/BV,P/E.
The main Null Hypothesis: There is no statistically significant effect of (No. of Transactions, turnover Ratio, earnings per share, dividend yield ratio, price to book value,P/E Ratio) on the market capitalization in ASE.
Table (1) shows that there is a statistically significant effect of all independent factors, (No. of Transactions, turnover Ratio, earnings per share, dividend yield ratio, price to book value,P/E Ratio) on the market value of the listed companies in the ASE during the research period, This means that the main Null hypothesis is rejected.
The table also shows the explanatory power of the model through Adjusted R Square which is (87%), This means that (87%) of the changes in Stock Market Capitalization are due to the independent factors used in the study model, and 13% of the changes due to other factors.
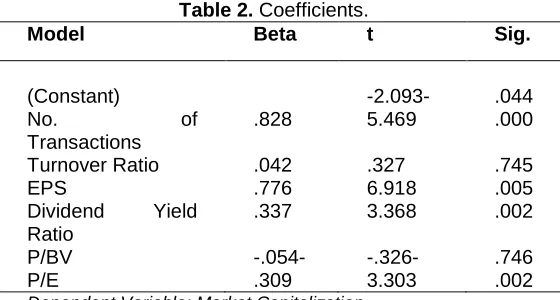
Table 2. Coefficients.
Model Beta t Sig.
(Constant) -2.093- .044 No. of
Transactions
.828 5.469 .000
Turnover Ratio .042 .327 .745
EPS .776 6.918 .005
Dividend Yield Ratio
.337 3.368 .002
P/BV -.054- -.326- .746
P/E .309 3.303 .002
Dependent Variable: Market Capitalization
Table (2) showed the results of the T- test which shows that there is an effect of the independent variables individual on the dependent variable (sup hypothesis test).
The 1st Null Hypothesis: There is no statistically significant effect of No. of Transactions on the market capitalization in ASE.
The results showed a statistically significant impact of the No. of transactions on the market capitalization, where the calculated value of T (5.469) and the level of significance (0.000) which is less than the value (α = 0.05). This means that the Null hypothesis is rejected.
The researcher also calculated the ETA square to estimate the practical significance by the follows:
( )
Under Cohen's standard, this result is interpreted as having a large significant effect.
The 2nd Null Hypothesis: There is no statistically significant effect of turnover Ratio on the market capitalization in ASE. The result shows that no statistically significant impact of the Turnover Ratio on the Stock Market Capitalization, where the calculated value of T (.327) and a level of significance (.745) which is more than the value (α = 0.05), this means that the Null hypothesis is accepted.
The 3rd Null Hypothesis: There is no statistically significant effect of EPS on the market capitalization in ASE.
The result shows a statistically significant impact of the EPS on the Market Capitalization, where the calculated value of T (6.918) and a level of significance (.005) which is less than the value (α = 0.05), this means that the Null hypothesis is rejected.
( )
Under Cohen's standard, this result is interpreted as having a large significant effect.
The 4th Null Hypothesis: There is no statistically significant effect of dividend yield ratio on the market capitalization in ASE.
The result shows a statistically significant impact of the Dividend Yield Ratio on the Stock Market Capitalization, where the calculated value of T (3.368) and a level of significance (.002) which is less than the value (α = 0.05), this means that the Null hypothesis is rejected.
( )
Under Cohen's standard, this result is interpreted as having a large significant effect.
The 5th Null Hypothesis: There is no statistically significant effect of P/BV value on the market capitalization in ASE. The result shows no statistically significant impact of the P/BV on the Stock Market Capitalization, where the calculated value of T (-.326-) and a level of significance (.746) which is more than the value (α = 0.05). This means that the Null hypothesis is accepted.
The 6th Null Hypothesis: There is no statistically significant effect of P/E Ratio on the market capitalization in ASE.
The result shows no statistically a statistically significant impact of the P/E Ratio on the Stock Market Capitalization, where the calculated value of T (3.303) and a level of significance (.002) which is less than the value (α = 0.05), this means that the Null hypothesis is rejected.
7053
Under Cohen's standard, this result is interpreted as having a large significant effect.
5.
CONCLUSION:
The study aimed at identifying the most important factors that affect the market capitalization by finding a model that helps to explain the extent of this impact. In addition to this, the study aimed at providing some results and recommendations that would be useful to investors in the ASE, and improve the levels of trading.
The researcher applied the study on the ASE during the period 1978-2019 through the use of multiple regression models. The researcher provided that the model was successful through the result of the main hypothesis which shows that there is a statistically significant effect of (No. of Transactions, Turnover Ratio, EPS, Dividend Yield Ratio, P / BV, P / E) as independent factors on the market capitalization as a dependent factor for the listed companies in the ASE. The explanatory power of the model through Adjusted R Square which is (87%), This means that (87%) of the changes in Stock Market Capitalization are due to the independent factors used in the study model, and 13% of the changes due to other factors.
In addition, the sub hypotheses of the study were tested to find the effect of factors individually on the market capitalization. The results showed that there is a statistically significant effect for each of (No. of Transactions, EPS, Dividend Yield Ratio, P / E) on the market capitalization, as well as there is no statistically significant effect for each of the factors (Turnover Ratio, P / BV) on the market capitalization.
The results of this study agreed with some of the previous studies and differed with others. The difference may be due to the difference in the characteristics and nature of the financial markets, the different nature of the sample of companies and the sector to which they belong, or perhaps the different time periods for those studies from the current study.
The researcher recommend that the results of this study need to be adopted to help analysts and investors make informed investment decisions, as well as recommend future researchers to make comparative studies in the same subject for groups of financial markets to reach the results that can work to improve the trading in those markets.
6.
REFERENCES:
[1] Abdul-Khaliq, Sh., 2013, "The Impact of Stock Market Liquidity on Economic Growth in Jordan", European Journal of Business and Management www.iiste.org, 5(30), 154- 158.
[2] Abdus Salam, M., Islam, Sh., & Hasan, M., 2015, "Factors Affecting the Stock Price Movement: A Case Study on Dhaka Stock Exchange", Developing Country Studies, 5 (16), 83 -94.
[3] Al-Afeef, M, 2017, "The Impact of Economic Value Added & Return on Investment on the Changes in Stock Market’s Value (Analytical Study: ASE: 2006-2015)" International Journal of Business and Management, 12(10), P132-142.
[4] Allahawiah, S., Al Amro, S., 2012, " Factors affecting Stock Market Prices in Amman Stock Exchange: A Survey Study", European Journal of Business and Management, 4 (8), 236-245.
[5] Alzubidi, H., 2004, "Financial Analyses" Al Warraq Publishing, 2nd edition, 2011, Amman Jordan.
[6] Amman Stock Exchange, 2019,
http://www.ase.com.jo/en/print/pdf/node/7208
[7] Arab Monetary Fund, 2014, Arab Financial Markets Database, Fourth Quarter, Arab Monetary Fund, UAE.
[8] Bhargava, A., Zhargava, A., & Jain, S., 2016, "Factors Affecting Stock
Prices in India: A Time Series Analysis", Journal of Economics and Finance, 7(4), 68- 71.
[9] Bratamanggala, R., 2018 "The Factors Affecting Board Stock Price of Lq45 Stock Exchange 2012-2016: Case of Indonesia", European Research Studies Journal, 1, 115 – 124.
[10] Emamgholipour, M., Pouraghajan, A., Tabari, N., Haghparast, M., &, Shirsavar, A., 2013, "The Effects of Performance Evaluation Market Ratios on the Stock Return: Evidence from the Tehran Stock Exchange", International Research Journal of Applied and Basic Sciences, 4 (3), 696-703.
[11] Hadad, F., 2015, "Corporate Finance" Al-Hamed Publishing,2nd edition, Amman, Jordan.
[12] Hasan, M. & In’airat, S., 2018, "The effect of internal and external factors on stock market prices - evidence from Saudi Arabia", The Business and Management Review, 9 (3), 413-423
[13]Investigation on Jordanian Banks", International Journal of Business and Social Science,8,(3), 67-74.
[14] Investopedia,
https://www.investopedia.com/terms/m/marketcapgdp.asp, 2019 [15] Islam, R, Khan, T., Choudhury, T. & Adnan, A., 2014, "How Earning
Per Share (EPS) Affects on Share Price and Firm Value" European Journal of Business and Management, 6 (17), 97-108.
[16] Juaijati, A.& Rafiaa, 2007, "The Effect of Monetary Policy on Market Value of Stocks and Bonds Analytical Study for a Sample of Arab Gulf Countries", Journal of Tanmiyat Al- Rafidain, 29, 88, 2007, 135-151.
[17] Khrawish, H. Zakaria, W & Jaradat, M., 2010, "The relationships between stock market capitalization rate and interest rate: Evidence from Jordan, 2010", Prague Development Center - Business and Economic Horizons, 2 (2), 60-66.
[18] Marangu, K., Jagongo, A., 2014, "Value Ratio and Financial Statement Variables, An Empirical Study of Companies Quoted At Nairobi Securities Exchange", Global Journal of Commerce & Management Perspective, 3(6), 50-56.
[19] Marie Ligocká, M., & Stavárek, D., 2019, "The relationship between financial Ratios and the Stock Prices of Selected European food companies listed on stock exchanges ", ACTA UNIVERSITATIS AGRICULTURAE ET SILVICULTURAE MENDELIANAE BRUNENSIS, 67 (28), 299- 307.
[20] Mishal, Y., Bakleh, S., & Aldeki, R., 2015, "The Impact of Volatilities Stock Return on Trading Volume in Financial Markets: An Empirical Study in Damascus Stock Exchange", Tishreen University Journal for Research and Scientific Studies -Economic and Legal Sciences Series, 37(4), 434-447.
[21] Naimi,A., & TAmimi, A., 2009, " Aavanced Financial Management" Al Yazouri Scientific Publishing, 1st edition, Amman, Jordan.
[22] Qaisi, F., Tahtamouni, A, & AL-Qudah, M., 2016, "Factors Affecting the Market Stock Price - The Case of the Insurance Companies Listed in Amman Stock Exchange", International Journal of Business and Social Science, 7 (10), 81-90.
[23] Sharif, T.,Purohit, H., Pillai, R., 2015, "Analysis of Factors Affecting Share Prices: The Case of Bahrain Stock Exchange", International Journal of Economics and Finance, 7 (3),207-216.
[24] Warrad, L., 2017 "The Effect of Market Valuation Measures on Stock Price: An Empirical