R E S E A R C H
Open Access
Prognostic factor analysis for breast cancer
using gene expression profiles
Soobok Joe and Hojung Nam
*From
The ACM Ninth International Workshop on Data and Text Mining in Biomedical Informatics
Melbourne, Australia 23 October 2015
Abstract
Background:The survival of patients with breast cancer is highly sporadic, from a few months to more than 15 years. In recent studies, the gene expression profiling of tumors has been used as a promising means of predicting prognosis factors.
Methods:In this study, we used gene expression datasets of tumors to identify prognostic factors in breast cancer. We conducted log-rank tests and used unsupervised clustering methods to find reciprocally expressed gene sets associated with worse survival rates. Prognosis prediction scores were determined as the ratio of gene expressions.
Results:As a result, four prognosis prediction gene set modules were constructed. The four prognostic gene sets predicted worse survival rates in three independent gene expression data sets. In addition, we found that cancer patient with poor prognosis, i.e., triple-negative cancer, HER2-enriched,TP53mutated and high-graded patients had higher prognosis prediction scores than those with other types of breast cancer.
Conclusions:In conclusion, based on a gene expression analysis, we suggest that our well-defined scoring method of the prediction of survival outcome may be useful for developing prognostic factors in breast cancer.
Background
Breast cancer is one of the most common cancer types in women. In 2015, an estimated 234,190 new cases will be diagnosed, and 40,730 deaths from breast cancer will occur [1]. Prognosis and therapy selection for those with breast cancer are usually affected by clinical and path-ology features based on conventional histpath-ology and im-munohistochemistry findings [2]. In general cases, the menopausal status of the patient, the stage of the dis-ease, the grade of the primary tumor, the estrogen (ER) and progesterone receptor (PR) status, and the level of human epidermal growth factor type 2 receptor (HER2) expression have been used for prognosis predictions. More recently, various uses of molecular profiling in breast cancer also includes ER and PR status testing,
HER2/neu receptor status testing, and gene profile test-ing with, for example, MammaPrint [3] or Ocnotype DX [4, 5].
With regard to clinical intervention, it is critical to iden-tify which patients are at risk of developing a more fatal type of breast cancer. Well-known prognostic factors such as ER and HER2 can be used to predict which patients face higher levels of risk. However, in addition to these traditional makers, there are still novel prognostic factors which are required for predictions of survival for patients with ill-defined breast cancer types. Triple-negative breast cancer is one of the subtypes currently having no such prognostic factors and no targeted drug therapies. Re-cently, several gene signatures have been identified to pre-dict prognostic outcomes. Tang et al. found that a decreased level of BECEN1 gene expression in human breast cancer is associated with poor prognosis [6]. The CENPA gene was a significantly independent prognostic marker for patients with ER-positive breast cancer [7]. * Correspondence:[email protected]
School of Electrical Engineering and Computer Science, Gwangju Institute of Science and Technology, 123 Cheomdangwagi-ro, Buk-gu, Gwangju, Republic of Korea
More recently, AI-Ejeh et al. identified eight genes (MAPT, MYB, MELK, MCM10, CENPA, EXO1, TTKand KIF2C) associated with poor survival in breast cancer pa-tients through biological evidence pertaining to TNBC, metastases, and patient survival [8]. In the latest studies, Liu et al. identified and validated five genes (CDK1, DLGAP5, MELK, NUSAP1, and RRM2), the expression levels of which were strongly associated with shorten sur-vival time [9]. Although these significant genes were iden-tified, still remains a need for a more comprehensive and exhaustive analysis to find novel prognostic factors.
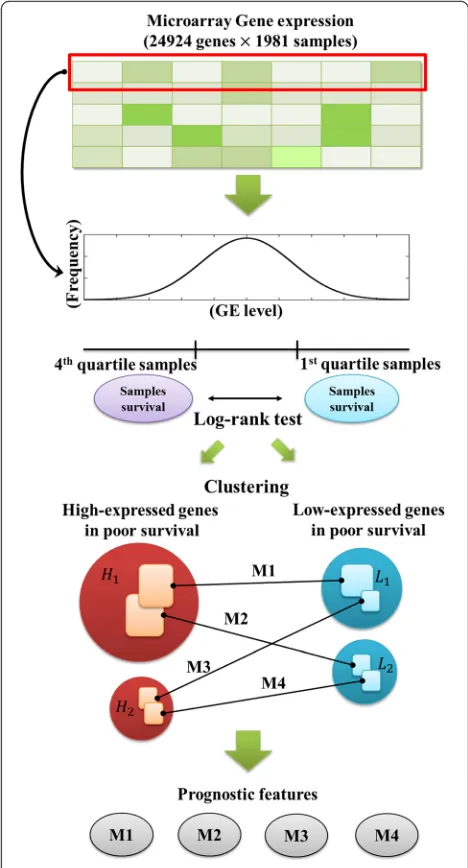
In this study, to identify prognostic factors based on gene expressions, we undertook a statistical gene expres-sion data analysis using 1981 breast tumor expresexpres-sion profiles. All of the genes were used individually in our analysis. The expression of each gene was identified as high or low with regard to poor survival, and we clus-tered genes using an unsupervised method. Finally, we found four matched gene sets along with four modules identified through each gene set which could be used as prognostic markers (Fig. 1). Our results showed that four gene set modules were significantly associated with the worst survival rates; they were strongly associated with a higher tumor grade,TP53mutation, ER-negative, HER2-enriched or basal-like subtypes, as well as triple-negative breast cancer.
Method
Gene expression profiles
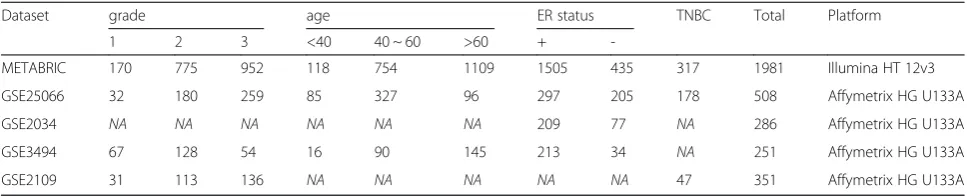
We obtained four independent publicly available breast cancer datasets for survival analysis. One is the Molecular Taxonomy of Breast Cancer International Consortium (METABRIC) in the United Kingdom and Canada [10]. These data were accessed through Synapse (synapse.sage-base.org, Synapse ID: syn1688369). The other three data-sets were collected from the Gene Expression Omnibus (GSE25066 [11], GSE2034 [12], GSE3494 [13]). The METABRIC data set is used for training, and three GSE datasets (GSE25066, GSE2034, and GSE3494) are used for validation. To investigate genes related to triple-negative cancer, we used three breast cancer gene expression data-sets: METABRIC, GSE2109 [14] and GSE25066. In the METABRIC dataset, normalized expression levels of a total of 54,675 probes were measured in 1981 breast tumor samples. Data were transformed to a compatible 24,924-gene format by selecting the median values of each probe expression. In the three independent GEO datasets, the normalized expression levels of 22,283 probes were measured in 508, 286, and 251 breast tumor samples. These data were also transformed to a 13,433-gene ex-pression format by selecting the median value of each probe expression. Table 1 indicates used five microarray datasets in this study.
Prognostic factor gene set selection
A total of 24,924 genes in METABRIC dataset were used in this research. To identify high/low expressed genes based on patient’s poor survival, we implemented a log-rank test and used an expression fold-change between patients who separated to first quartile and forth quartile corresponding to each gene expression level. This process was implemented by each gene. Hazard ratio was calculated between first and forth quartile patient
groups and adjusted p-value cutoff was determined as 0.001. Therefore, if hazard ratio is greater than one with proper threshold and patients’ expression fold-change (first/fourth) is greater than 2, we selected the gene as a high-expressed gene in poor survival. Similarly, if hazard ratio is less than one with properp-value cutoff and an expression fold-change (fourth/first) is less than 0.5, we selected the gene as a low-expressed gene in poor sur-vival (Additional file 1: Figure S1). In the log-rank test of every 24,924 gene, we found 413 highly expressed genes associated with poor survival and 411 low-expressed genes associated with poor survival.
Identification of four prognostic modules
To construct the list of candidate genes for predicting patient’s outcome, we initially used over 20,000 genes and we selected a list of prognostic candidate genes by using a survival log-rank test. However, since too many number of genes showed significance in the log-rank test, we proposed an algorithm for minimizing and clus-tering genes according to their significance and co-expressed pattern. For clustering the two previously defined gene sets, we used the maximal clique algorithm [15] with Pearson correlation coefficient scores. Among the 413 high-expressed genes, we connected genes if two genes had a Pearson correlation coefficient which exceeded 0.4. We then determined the maximal clique in the 413 genes, after which we eliminated these genes and found the next maximal clique. Similarly, for the 411 low-expressed genes associated with poor survival, we also clustered genes with a minimum Pearson correl-ation coefficient of 0.4. To avoid the cluster which has too small number of genes, we used only two major clusters. Here, we used clusters for high/low expression gene sets which have over 15 independent genes. After clustering, we obtained two high-expressed gene groups associated with poor survival and two low-expressed gene groups. The connections between the high- and the low-expressed genes were also identified with a Pearson correlation coefficient of -0.4 through the maximal bi-clique generation algorithm [16]. Finally, there were four
matched gene sets which are strongly connected to each other, as represented by high correlation values from the gene expression data. Each gene set has high-expressed and low-expressed genes associated with poor survival. Thus, we identified four prognosis prediction scores as the ratio between the median of the high-expressed gene level to the low-expressed gene level in the four matched gene sets. We defined the module 1 score as the ratio of the 26 high-expressed genes associated with poor survival to the 17 low-expressed genes associated with poor sur-vival. Similarly, Modules 2, 3 and 4 scores were respect-ively defined as the ratios between the eight, nine, and four high-expressed genes associated with poor survival to the 10, nine, and eight low-expressed genes associated with poor survival. Because we used the maximal clique algorithm to cluster each gene set, there was a strong cor-relation between the expression levels of each high-expressed gene and low-high-expressed gene associated with poor survival (Pearson’s r> 0.4). Between high-expressed genes and low-expressed genes, the maximum Pearson correlation coefficient was found to be -0.4.
Survival analysis
We analyzed three sets of detailed clinical data from each of the studies used. These were GSE2034, GSE25066, and GSE3494. We used the Disease-Free Survival (DFS) clin-ical information in GSE2034 and GSE25066, and the Dis-tant Recurrence Free Survival (DRFS) in GSE3494. In a Kaplan Meier survival plots, the median of a measured module’s score was used to dichotomize the data, allowing stratification into high and low groups within each of the three individual datasets.
Genes associated with triple negative breast cancer To investigate genes related to triple negative breast cancer (TNBC), after comparing the three independ-ent expression profiles, we selected 230 up-regulated genes and 237 down-regulated genes in TNBC (Cut off p-value < 0.05, FDR < 0.05, from t-test, log fold change < 0.5) from METABRIC, GSE2109 and GSE25066 datasets.
Table 1The dataset used in this study
Dataset grade age ER status TNBC Total Platform
1 2 3 <40 40 ~ 60 >60 +
-METABRIC 170 775 952 118 754 1109 1505 435 317 1981 Illumina HT 12v3
GSE25066 32 180 259 85 327 96 297 205 178 508 Affymetrix HG U133A
GSE2034 NA NA NA NA NA NA 209 77 NA 286 Affymetrix HG U133A
GSE3494 67 128 54 16 90 145 213 34 NA 251 Affymetrix HG U133A
GSE2109 31 113 136 NA NA NA NA NA 47 351 Affymetrix HG U133A
Results
Worse survival with four modules
Patients whose tumors had the highest score among the four modules had the worst prognosis. To validate each score, we used the three datasets of GSE2034, GSE25066, and GSE3494. We selected four matched gene sets from METABRIC data set which consist of about 20,000 genes on Illumina HT 12v3 platform. However, in the test data-sets, the expression profiles consist of about 12,000 genes on Affymetrix HG U133A platform. Therefore, all genes obtained from METABRIC were not matched in test data-sets. In module 1, among 44 METABRIC genes, 37 genes were used for validation. In module 2, module3 and mod-ule 4, we used 11, 27 and 8 matched genes among 17, 36, 14 METABRIC genes, respectively. According to Kaplan Meier survival plots of the three independent sets, high-scoring patients had poor survival rates in the scores of all of the modules. In the GSE2034, GSE25066 and GSE3494 datasets with module 1, patients dichotomized by the prog-nosis prediction score from 23 high-expressed and 14 low-expressed gene expressions were associated with the worst survival prognosis (Fig. 2a-f). Patients whose tumors had high scores on module 1 had the worst prognosis (P= 0.0036, P< 0.0001, and P< 0.0001, respectively). With modules 2, 3, and 4, similarly, patients whose tumors had high scores had the worst prognosis. In GSE2034, patients whose tumors had high module 1, 2 and 3 scores had the worst. In GSE3494, patients whose tumors had high
module 1, 2 and 3 score had the worst prognosis. Only the cases of GSE2034 and GSE3494 with module 4 were not significantly different (Additional file 1: Table S1). We also investigated a lot of possible cases of prediction for dif-ferently matched gene set according to manifold threshold. The significance of those results was repre-sented in Additional file 1: Table S1.
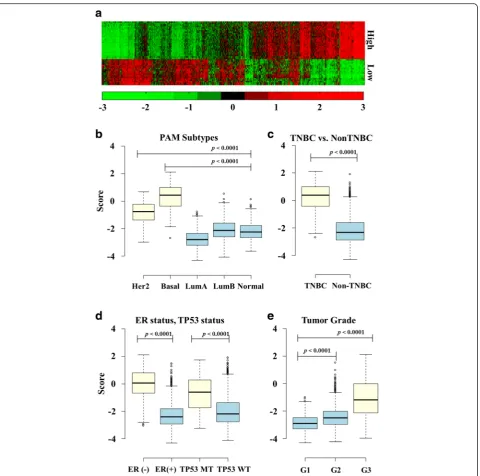
Prognostic factor gene set in module 1
Among the four modules in this research, the module 1 signature strongly represented a high hazard ratio with significant p-values (Fig 2a-c). Figure 3a shows the ex-pression pattern of the 28 and 17 prognostic factor genes. The 28 genes in the upper part of the figure rep-resent high-expressed genes associated with poor sur-vival, and these genes are co-expressed relative to each other (Pearson’sr> 0.4). The 17 genes in the lower part of the figure represent low-expressed genes associated with poor survival; these genes are also strongly co-expressed relative to each other (Pearson’s r> 0.4). In METABRIC, when gene expressions were compared across different tumor types without dichotomization, the module 1 gene score was significantly higher in the HER2-enriched group with the basal-like type (Fig. 3b). Similarly, the triple-negative breast cancer type, ER-negative, and theTP53 mutation type had higher scores than the other breast cancer types (Fig. 3c and d). The significance levels of the genes used in module 1 were
also confirmed using BreastMark [17], which identifies putative prognostic biomarkers. BreastMark gave hazard ratios which were statistically significant for 41 out of 44 genes including previously defined prognostic genes (Table 2, Additional file 1: Table S2). In 26 high-expressed genes in module 1, 16 genes are previously de-fined as prognostic genes, and among 17 low-expressed genes, 8 genes are previously defined as prognostic genes
(Additional file 1: Table S2). 26 genes out of module 1 were differentially expressed genes (DEGs) in TNBC and non-TNBC (19 upregulated genes and 11 down-regulated genes in TNBC) (Table 2).
Discussion
The discovery of prognostic factors is crucial work in breast cancer biomarker research. In this study, using a Fig. 3Expression of high/low-expressed genes in poor survival and Boxplots of prognostic score according to breast cancer characteristics.aThe
expression levels of the genes used in module 1. The 26 genes in the upper part of the figure represent high-expressed genes associated with poor survival; and the 17 genes in the lower part represent row-expressed genes associated with poor survival.bBoxplot showing the distribution of module 1 scores in the METABRIC dataset according to PAM50 subtypes.cBoxplot showing the distribution of module 1 scores according to TNBC and Non TNBC.
Table 2The gene list used for module 1
Gene Description METABRIC BreastMark[17]
HR p-value HR p-value
High-expressed genes CHEK1a,b checkpoint kinase 1 2.16 8.1E-11 1.32 3.9E-06
FOXM1b forkhead box M1 2.58 4.4E-16 1.58 5.5E-13
CCNA2a,b cyclin A2 2.53 5.8E-15 1.47 3.0E-09
CDC20a,b cell division cycle 20 2.50 9.6E-15 1.54 5.8E-13
TTKa,b TTK protein kinase 2.28 1.5E-12 1.50 1.2E-11
CENPAa,b centromere protein A 2.56 4.4E-16 1.54 6.6E-13
KIF2Ca,b kinesin family member 2C 2.49 5.6E-15 1.64 2.2E-16
BUB1a BUB1, mitotic checkpoint serine/threonine kinase 2.50 2.1E-14 1.61 2.2E-15
MCM6 minichromosome maintenance complex component 6 2.09 3.5E-10 1.56 8.8E-14
LMNB2b lamin B2 2.17 3.2E-11 1.38 2.6E-07
CDC45b cell division cycle 45 2.53 2.6E-14 1.50 4.3E-12
ANLNa anillin actin binding protein 2.27 6.1E-12 1.48 1.1E-07
MCM10b minichromosome maintenance 10 replication initiation factor 2.30 1.5E-12 1.62 9.8E-14
CDCA8a,b cell division cycle associated 8 2.28 1.0E-12 1.55 3.8E-13
MELKb maternal embryonic leucine zipper kinase 2.56 3.6E-15 1.60 0
CCNB2a cyclin B2 2.79 0 1.72 0
CEP55a,b centrosomal protein 55 kDa 2.55 9.1E-15 1.56 1.8E-13
DLGAP5a,b discs, large (Drosophila) homolog-associated protein 5 2.16 3.8E-10 1.46 3.6E-10
HJURPb Holliday junction recognition protein 2.79 0 1.61 2.3E-15
CDCA5a cell division cycle associated 5 2.76 0 1.29 1.3E-03
TRIP13a,b thyroid hormone receptor interactor 13 2.18 5.0E-11 1.44 6.6E-09
GTSE1a,b G2 and S-phase expressed 1 2.54 1.7E-14 1.35 5.5E-07
CDCA3a,b cell division cycle associated 3 2.29 5.3E-12 1.48 8.3E-10
PRR11 proline rich 11 2.09 1.3E-10 1.18 2.6E-06
FAM83Da family with sequence similarity 83 member D 2.66 2.2E-16 1.45 2.6E-06
GTPBP4b GTP binding protein 4 1.73 1.6E-06 1.36 4.2E-07
Low-expressed genes ESR1b estrogen receptor 1 0.54 2.6E-08 0.84 2.1E-02
GATA3b GATA binding protein 3 0.57 4.0E-07 0.92 1.6E-01
LRIG1 leucine-rich repeats and immunoglobulin-like domains 1 0.49 3.0E-10 0.65 1.4E-12
RABEP1b rabaptin, RAB GTPase binding effector protein 1 0.57 5.4E-07 0.75 2.3E-06
CIRBPb cold inducible RNA binding protein 0.44 1.1E-12 0.70 3.9E-09
EVLb Enah/Vasp-like 0.55 1.1E-07 0.78 1.0E-04
WDR19 WD repeat domain 19 0.52 1.5E-08 0.77 4.5E-05
SCUBE2b signal peptide, CUB domain, EGF-like 2 0.55 1.7E-07 0.75 1.1E-04
KIF13Bb kinesin family member 13B 0.55 3.8E-07 0.64 2.1E-11
TBC1D9b TBC1 domain family member 9 0.55 1.2E-07 0.82 9.5E-04
ANKRA2b ankyrin repeat family A member 2 0.55 6.2E-08 0.93 2.3E-01
DYNLRB2 dynein, light chain, roadblock-type 2 0.49 1.3E-09 0.93 3.9E-01
NME5b NME/NM23 family member 5 0.44 3.8E-12 0.77 4.6E-05
large-scale transcriptomic dataset, we found that four types of prognostic gene sets are strongly related with poor patient outcomes. We used each of the four gene set expressions to evaluate three independent breast tu-mors and found that scores based on gene expression gave generally consistent predictions of outcomes. When comparing tumor characteristics and scores, tumors with high scores were more likely to have TP53 muta-tions, to be HER2-enriched or to have basal-like intrinsic subtypes, triple-negative status, and worse survival rates.
The twenty six genes and 17 genes used in module 1 were strongly co-expressed in METABRIC dataset, and the ratio of the expression levels of the two DEG groups were used as a prognostic marker in this research. Among these high-expressed genes associated with poor survival of patients, many were associated with genes in-volved in the cell cycle process [18], including several well-defined genes as prognostic factor. Recently, Abdel-Fatah et al. showed that highCHEK1expression level is linked to poor prognosis in breast cancer and aggressive breast cancer [19].HJURPwas also recently identified as an independent biomarker of cancer outcome in luminal A patients [20]. Breast cancer progression can include theFOXM1-CDCA8signature which assists as a promis-ing therapeutic target and potential prognostic factor [21]. In addition, Kwok et al. showed that the knock-down ofFOXM1with thiostrepton in micelle nanoparti-cles reduced tumor growth rates and increased apoptosis [22]. Thus, they showed that FOXM1 is one of the pri-mary cellular targets of thiostrepton in breast cancer cells. Karra et al. discovered that high CDC20 and securin immunoexpression are correlated with unusually poor outcomes of breast cancer patients [23].BUB1has important roles in the proliferation or progression of breast cancer, and the nuclearBUB1 immunohistochem-ical status is considered to be an influential prognostic factor in human breast cancer patients [24]. Liu et al. identified and validated five hub genes (CDK1,DLGAP5, MELK, NUSAP1, and RRM2), the expression levels of which were strongly associated with poor survival. Highly expressedMELKrevealed poor survival in luminal A/B molecular subtypes of breast cancer [9]. Furthermore, among low-expressed genes associated with poor survival, several well-defined genes were found to be prognostic factor. The role of GATA3 in breast cancer as a tumor suppressor has been established. Interestingly, theGATA3
down-regulation is required for the progestin-induced up-regulation of cyclin A2(CCNA2) and for progestin-induced in vivo and in vitro breast cancer cell growth [25]. Thompsons et al. presented low expression ofLRIG1is a prognostic factor for breast cancer patients [26]. Cheng et al. showed patients with negative SCUBE2 protein-expression tumors had worse prognosis than those with positiveSCUBE2protein-expression tumors in breast can-cer [27]. The latest studies suggested the deregulation of NME5, DNALI1 in malignant breast cancer [28]. In addition, 30 genes out of 44 module 1 genes were DEGs in TNBC and non-TNBC (19 upregulated genes and 11 down-regulated genes in TNBC). Thus, we confirmed that the DEGs of classical poor prognosis breast cancer type were also related to our results.
Conclusions
In conclusion, our finding presents the score of progno-sis prediction modules that are strongly associated with shortened survival times in breast cancer, and the score of the module is consistently high in aggressive breast cancer types such as TNBC and ER-negative and HER2-enriched types. In addition, we found that this score is associated with the tumor grade in breast cancer. Thus, we suggest the inclusion of these enriched genes as ag-gressive cancer markers; 26 co-expressed and 17 genes can be used as new prognostic markers, and we expect that these investigations can be adapted to research on target therapies for ill-defined breast cancer types.
Ethics approval and consent to participate
Research ethics approval was obtained from the Gwangju Institute of Science & Technology. The METABRIC study protocol was also approved by the ethics committees in previous study [10]. All datasets which were used in this study were composed of anonymized patient information.
Consent for publication
Not applicable.
Availability of data and materials
The Molecular Taxonomy of Breast Cancer International Consortium (METABRIC) datasets supporting the conclu-sions of this article are available in the Synapse repository (https://www.synapse.org/#, Synapse ID: syn1688369). The other four datasets are also available in the Gene Table 2The gene list used for module 1(Continued)
CASC1b cancer susceptibility candidate 1 0.44 1.8E-12 0.79 1.0E-04
BBOF1 basal body orientation factor 1 0.46 2.1E-11 0.78 7.5E-05
RUNDC1 RUN domain containing 1 0.55 1.0E-07 0.75 3.0E-04
High expressed genes: high-expressed gene group associated with poor survival, Low expressed genes: low-expressed gene group associated with poor survival,a
Expression Omnibus (http://www.ncbi.nlm.nih.gov/geo/, GSE25066, GSE2034, GSE3494, GSE2109).
Additional file
Additional file 1:Figure S1.Selection of prognostic candidate-genes based on log-rank test.Table S1.The prediction of patients’outcome based on log-rank test according to varied correlation thresholds.Table S2.The gene list of module 1 including previously defined prognostic factor. (DOCX 179 kb)
Competing interests
The authors declare that they have no competing interests.
Authors’contributions
SJ conducted the analysis and drafted the manuscript. HN designed and coordinated the study. Both authors read and approved the final manuscript.
Acknowledgements
This research was supported by a grant of the Korea Health Technology R&D Project through the Korea Health Industry Development Institute (KHIDI), funded by the Ministry of Health & Welfare, Republic of Korea (grant number: HR14C0005), a grant from the“Systems Biology Infrastructure Establishment Grant”provided by the Gwangju Institute of Science & Technology in 2015, a grant from the Bio-Synergy Research Project (NRF-2014M3A9C4066449) of the Ministry of Science, ICT and Future Planning through the National Research Foundation, and by a grant from the GIST Research Institute(GRI) in 2016.
Declarations
Publication costs for this article were sourced from a grant of the Korea Health Technology R&D Project through the Korea Health Industry Development Institute (KHIDI), funded by the Ministry of Health & Welfare, Republic of Korea (grant number : HR14C0005), a grant from the“Systems Biology Infrastructure Establishment Grant”provided by the Gwangju Institute of Science & Technology in 2015, a grant from the Bio-Synergy Research Project (NRF-2014M3A9C4066449) of the Ministry of Science, ICT and Future Planning through the National Research Foundation, and by a grant from the GIST Research Institute(GRI) in 2016.
This article has been published as part of BMC Medical Informatics and Decision Making Volume 16 Supplement 1, 2016: Proceedings of the ACM Ninth International Workshop on Data and Text Mining in Biomedical Informatics. The full contents of the supplement are available online at https://bmcmedinformdecismak.biomedcentral.com/articles/.
Published: 18 July 2016
References
1. Howlader N NA, Krapcho M, Garshell J, Miller D, Altekruse SF, Kosary CL, Yu M, Ruhl J, Tatalovich Z,Mariotto A, Lewis DR, Chen HS, Feuer EJ, Cronin KA: SEER Cancer Statistics Review, http://seer.cancer.gov/csr/1975_2012/, based on November 2014 SEER data submission, posted to the SEER web site. 2015. 2. Simpson JF, Gray R, Dressler LG, Cobau CD, Falkson CI, Gilchrist KW, Pandya KJ,
Page DL, Robert NJ. Prognostic value of histologic grade and proliferative activity in axillary node-positive breast cancer: results from the Eastern Cooperative Oncology Group Companion Study, EST 4189. J Clin Oncol Off J Am Soc Clin Oncol. 2000;18(10):2059–69.
3. van’t Veer LJ, Dai H, van de Vijver MJ, He YD, Hart AA, Mao M, Peterse HL, van der Kooy K, Marton MJ, Witteveen AT, et al. Gene expression profiling predicts clinical outcome of breast cancer. Nature. 2002;415(6871):530–6. 4. Buyse M, Loi S, van’t Veer L, Viale G, Delorenzi M, Glas AM, d'Assignies MS,
Bergh J, Lidereau R, Ellis P, et al. Validation and clinical utility of a 70-gene prognostic signature for women with node-negative breast cancer. J Natl Cancer Inst. 2006;98(17):1183–92.
5. Paik S, Shak S, Tang G, Kim C, Baker J, Cronin M, Baehner FL, Walker MG, Watson D, Park T, et al. A multigene assay to predict recurrence of tamoxifen-treated, node-negative breast cancer. N Engl J Med. 2004;351(27):2817–26. 6. Tang H, Sebti S, Titone R, Zhou Y, Isidoro C, Ross TS, Hibshoosh H, Xiao G,
Packer M, Xie Y. Decreased BECN1 mRNA expression in human breast
cancer is associated with estrogen receptor-negative subtypes and poor prognosis. EBioMedicine. 2015;2(3):255–63.
7. McGovern SL, Qi Y, Pusztai L, Symmans WF, Buchholz TA. Centromere protein-A, an essential centromere protein, is a prognostic marker for relapse in estrogen receptor-positive breast cancer. Breast Cancer Res. 2012;14(3):R72.
8. Al-Ejeh F, Simpson P, Sanus J, Klein K, Kalimutho M, Shi W, Miranda M, Kutasovic J, Raghavendra A, Madore J. Meta-analysis of the global gene expression profile of triple-negative breast cancer identifies genes for the prognostication and treatment of aggressive breast cancer. Oncogenesis. 2014;3(4):e100.
9. Liu R, Guo CX, Zhou HH. Network-based approach to identify prognostic biomarkers for estrogen receptor-positive breast cancer treatment with tamoxifen. Cancer Biol Ther. 2015;16(2):317–24.
10. Curtis C, Shah SP, Chin SF, Turashvili G, Rueda OM, Dunning MJ, Speed D, Lynch AG, Samarajiwa S, Yuan Y, et al. The genomic and transcriptomic architecture of 2,000 breast tumours reveals novel subgroups. Nature. 2012;486(7403):346–52.
11. Gluck S, Ross JS, Royce M, McKenna Jr EF, Perou CM, Avisar E, Wu L. TP53 genomics predict higher clinical and pathologic tumor response in operable early-stage breast cancer treated with docetaxel-capecitabine +/-trastuzumab. Breast Cancer Res Treat. 2012;132(3):781–91.
12. Al-Ejeh F, Shi W, Miranda M, Simpson PT, Vargas AC, Song S, Wiegmans AP, Swarbrick A, Welm AL, Brown MP. Treatment of triple-negative breast cancer using anti-EGFR–directed radioimmunotherapy combined with radiosensitizing chemotherapy and PARP inhibitor. J Nucl Med. 2013;54(6):913–21.
13. Miller LD, Smeds J, George J, Vega VB, Vergara L, Ploner A, Pawitan Y, Hall P, Klaar S, Liu ET, et al. An expression signature for p53 status in human breast cancer predicts mutation status, transcriptional effects, and patient survival. Proc Natl Acad Sci U S A. 2005;102(38):13550–5.
14. Edgar R, Barrett T. NCBI GEO standards and services for microarray data. Nat Biotechnol. 2006;24(12):1471–2.
15. Palla G, Derenyi I, Farkas I, Vicsek T. Uncovering the overlapping community structure of complex networks in nature and society. Nature. 2005; 435(7043):814–8.
16. Alexe G, Alexe S, Crama Y, Foldes S, Hammer PL, Simeone B. Consensus algorithms for the generation of all maximal bicliques. Discret Appl Math. 2004;145(1):11–21.
17. Madden SF, Clarke C, Gaule P, Aherne ST, O’Donovan N, Clynes M, Crown J, Gallagher WM. BreastMark: an integrated approach to mining publicly available transcriptomic datasets relating to breast cancer outcome. Breast Cancer Res. 2013;15(4):R52.
18. da Huang W, Sherman BT, Lempicki RA. Bioinformatics enrichment tools: paths toward the comprehensive functional analysis of large gene lists. Nucleic Acids Res. 2009;37(1):1–13.
19. Abdel-Fatah TM, Middleton FK, Arora A, Agarwal D, Chen T, Moseley PM, Perry C, Doherty R, Chan S, Green AR, et al. Untangling the ATR-CHEK1 network for prognostication, prediction and therapeutic target validation in breast cancer. Mol Oncol. 2015;9(3):569–85.
20. de Oca RM, Gurard-Levin ZA, Berger F, Rehman H, Martel E, Corpet A, de Koning L, Vassias I, Wilson LO, Meseure D. The histone chaperone HJURP is a new independent prognostic marker for luminal A breast carcinoma. Mol Oncol. 2015;9(3):657–74.
21. Jiao D, Lu Z, Qiao J, Yan M, Cui S, Liu Z. Expression of CDCA8 correlates closely with FOXM1 in breast cancer: public microarray data analysis and immunohistochemical study. Neoplasma. 2014;62(3):464–9.
22. Kwok JM, Myatt SS, Marson CM, Coombes RC, Constantinidou D, Lam EW. Thiostrepton selectively targets breast cancer cells through inhibition of forkhead box M1 expression. Mol Cancer Ther. 2008;7(7):2022–32. 23. Karra H, Repo H, Ahonen I, Löyttyniemi E, Pitkänen R, Lintunen M, Kuopio T,
Söderström M, Kronqvist P. Cdc20 and securin overexpression predict short-term breast cancer survival. Br J Cancer. 2014;110(12):2905–13.
24. Takagi K, Miki Y, Shibahara Y, Nakamura Y, Ebata A, Watanabe M, Ishida T, Sasano H, Suzuki T. BUB1 immunolocalization in breast carcinoma: its nuclear localization as a potent prognostic factor of the patients. Horm Cancer. 2013;4(2):92–102.
26. Thompson PA, Ljuslinder I, Tsavachidis S, Brewster A, Sahin A, Hedman H, Henriksson R, Bondy ML, Melin BS. Loss of LRIG1 locus increases risk of early and late relapse of stage I/II breast cancer. Cancer Res. 2014;74(11):2928–35. 27. Cheng C-J, Lin Y-C, Tsai M-T, Chen C-S, Hsieh M-C, Chen C-L, Yang R-B.
SCUBE2 suppresses breast tumor cell proliferation and confers a favorable prognosis in invasive breast cancer. Cancer Res. 2009;69(8):3634–41. 28. Parris TZ, Danielsson A, Nemes S, Kovacs A, Delle U, Fallenius G, Mollerstrom E,
Karlsson P, Helou K. Clinical implications of gene dosage and gene expression patterns in diploid breast carcinoma. Clin Cancer Res. 2010;16(15):3860–74.
• We accept pre-submission inquiries
• Our selector tool helps you to find the most relevant journal
• We provide round the clock customer support
• Convenient online submission
• Thorough peer review
• Inclusion in PubMed and all major indexing services
• Maximum visibility for your research
Submit your manuscript at www.biomedcentral.com/submit