DEVELOPMENT REPORT
Development of a vibratory cueing
system using an implicit method to increase
walking speed in patients with stroke:
a proof-of-concept study
Kazuhiro Yasuda
1*†, Yuki Hayashi
2†, Anna Tawara
3and Hiroyasu Iwata
2Abstract
One of the main sequelae of stroke is dificulty walking, which is characterized by a decreased gait velocity and asymmetrical walking patterns. The purpose of this research was initially focused on developing a vibro-tactile cueing device that recognizes an implicit increase in cadence frequency. Subsequently, a proof-of-concept study with patients who had experienced stroke was conducted to examine the applicability of the system that had been developed. We applied Weber’s law to provide an implicit method for increasing cueing frequency. This law involves the calculation of just-noticeable difference (JND) relative to a previous state. Throughout training with the proposed cueing device, patients marginally increased cadence, and their cadence and gait speeds were significantly increased post-test. Hip circumduction gait (i.e., abnormal gait patterns) did not change significantly throughout training. Notably, patients reported that they were unaware of any changes associated with the vibration stimulus. Our result demonstrates the immediate changes to cadence and gait speed that occurred through training with the proposed implicit cueing device. However, the result of this study is confined to immediate gait changes after training and utilized only a small sample of stroke patients. Thus, the limited volume of data obtained prevents rigorous analysis regarding the applicability of this training method. Nonetheless, these results are promising and provide a starting point from which to base larger studies.
Keywords: Stroke, Gait training, Cueing, Haptic device, Implicit motor learning
© The Author(s) 2020. This article is licensed under a Creative Commons Attribution 4.0 International License, which permits use, sharing, adaptation, distribution and reproduction in any medium or format, as long as you give appropriate credit to the original author(s) and the source, provide a link to the Creative Commons licence, and indicate if changes were made. The images or other third party material in this article are included in the article’s Creative Commons licence, unless indicated otherwise in a credit line to the material. If material is not included in the article’s Creative Commons licence and your intended use is not permitted by statutory regulation or exceeds the permitted use, you will need to obtain permission directly from the copyright holder. To view a copy of this licence, visit http://creat iveco mmons .org/licen ses/by/4.0/.
Introduction
In Japan, approximately 250,000 people annually expe-rience a stroke, and several individuals require reha-bilitation to regain independence [1]. One of the main sequelae of stroke is difficulty walking, which is charac-terized by decreased gait velocity and asymmetrical walk-ing patterns [2, 3]. Therefore, gait training is a main focus of rehabilitation programs. Further, it has been reported
that increased walking speed contributes to improve quality of life (QOL) [4].
Gait rehabilitation research has been focused on the development of the cueing devices [7]. Systems with visual, audio, and vibratory cueing are well-known for assisting gait rehabilitation in patients with Parkinson’s disease [5, 6]. These devices function by providing rhyth-mic stimulation to patients as biofeedback to alleviate gait freezing. This cueing method is also being currently used to explore the rehabilitative effects produced in patients that have experienced stroke [7–9]. A 2016 review article reported that cadence cueing has been applied to reha-bilitate walking and that increasing the cueing frequency followed by the patient during walking rehabilitation
Open Access
*Correspondence: [email protected]
†Kazuhiro Yasuda and Yuki Hayashi contributed equally to this work 1 Research Institute for Science and Engineering, Waseda University, 3-4-1 Okubo, Shinjuku-ku, Tokyo 169-8555, Japan
sessions has improved walking speed significantly com-pared with other types of rehabilitative therapies [7].
Associated reaction is an unconscious, paretic, upper-limb muscle contraction that occurs throughout the duration of lower-limb exertion [10, 11]. This typi-cal coordination problem is very likely to occur when patients who have experienced stroke intentionally speed up while walking. It presents a challenge for fast-gait-speed rehabilitation implemented to avoid the deteriora-tion of gait quality. As mendeteriora-tioned above, walking speed improvement in patients with stroke is more significant when a cueing system is used compared with other types walking rehabilitation. However, it is possible that the intentionally speed up while walking induced by the cue-ing system leads to associated unintended muscle con-tractions that could be detrimental, because the system requires a conscious walking pattern in patients with stroke.
As mentioned above, since muscle tone is increased when patients intentionally make efforts to increase gait speed, there is a risk inducing abnormal gait patterns. Thus, the purpose of this research was initially aimed toward the development of a vibro-tactile device that rec-ognizes an “implicit” increase in cadence frequency. Sub-sequently, we conducted a proof of concept study using patients with stroke to examine the applicability of the system.
Methods System overview
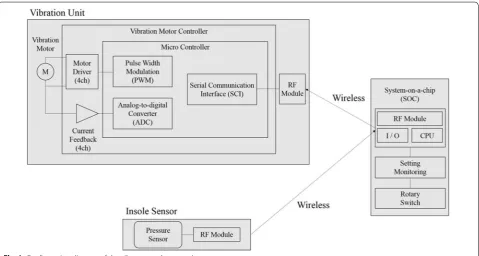
Figure 1 depicts the configuration diagram used for developing the system. Two vibrators were deployed at bilateral sides of a pelvic belt. The vibro-tactile stimu-lus is provided by vibration motors (Z7AL2B1692082, Jinlong Machinery & Electronics, Inc. China) at 80 Hz on anterior superior iliac spine to perceive stimulus easily for patients. The interval of stimulation was set using personal computer software (Keil uVision5, Keil Software Inc., Germany) and was sent to a microcon-troller (NRF 51, Nordic Semiconductor, USA). A rota-tory switch on the NRF 51 enabled frequency changes while patients walked (Fig. 2). The vibration command was sent to another microcontroller (TMS320F270; Texas Instruments, USA) on the belt using wireless communication.
The patient walks while alternating vibration cues are given to the left and right sides of his/her waist. As stated in the introduction, the aim of the present study was to slightly alter the vibration tempo without induc-ing an abnormal muscular tone in the patients. A previ-ous study has reported that Weber’s law can be applied to the interval of stimulation [12]. Thus, we hypothe-sized that we could apply JND to alter cueing frequency (i.e., At every specified step, cueing frequency increases without the patient’s awareness).
Method of implicit change of cadence‑cueing frequency We applied Weber’s law [12] to determine the implicit method for increasing cueing frequency. This law involves the calculation of the just-noticeable difference (JND) relative to a previous state. For example, a value known as Weber’s fraction represents the minimum difference ratio that can be realized. Weber’s fraction w is calculated as follows:
where R is the value of previous state and ∆R is the JND value. Ideally, Weber’s fraction is a constant. With respect to perception, Weber’s fraction represents the smallest degree of change in stimulation that can be detected by an individual.
In our study, Weber’s fraction represents the ratio of the minimal time interval of consecutive vibratory cues that can be perceived relative to a previous time interval. Figure 1b includes a basic illustration depict-ing increased cadence while walkdepict-ing. For each speci-fied step number, nstep , the time interval of each cue decreases according to the following equation:
(1)
w= R
R ,
where T0 is the specified initial time interval between each cue, n is the switched level set by the rotatory switch shown in Fig. 1, Tn is the time interval after setting by rotatory switch, and r is the ratio value determined according to the Weber’s ratio W.
Determining the variables of cueing change
To apply our implicit method for increasing cueing cadence, the variable T0 and r in Eq. (2) should be deter-mined. Meanwhile, the switched level n was incremented by 1 for every nstep steps, and we conducted a verifica-tion test to determine this nstep variable. First, we set a 10 m walking distance using our cadence-cueing device. According to a previous study, the length of a step of a healthy individual is approximately 50–60 cm [13]. This means that it takes approximately 18–20 steps for a healthy individual to walk 10 m. We then decided that at least three cadence increases were required for each walk; therefore, nstep was set to 5.
Second, the appropriate initial time interval for each cue T0 needed be determined based on the condition of each patient. Due to the asymmetry of a hemiplegic gait
(2)
Tn=T0(1−r)n
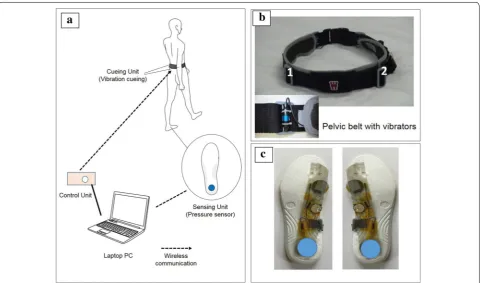
Fig. 2 Hardware of the vibratory cadence cueing system. The system shown in a consists of a belt with two left and right vibrators, a controller, PC and insole. Gait rhythm is cued by the vibrators, and frequency is modulated using the controller. The patient walks according to the left and right vibratory stimulation. In b vibrators are designed for placement on the left and right PSIS bony protuberances, and so the vibrations are easily felt. c
[3], we determined T0 . The walking condition of a hemi-plegic patient has been shown in Fig. 3. HS indicates heel strike at the non-paralyzed side, and HS′ indicates heel strike at the paralyzed side. Thus, we defined THS−HS′ as the average time from HS to HS′, while THS′−HS is defined as the average time from HS’ to HS′. T0 was calculated from the average of the two values as follows:
The timing of heel strikes was detected by an insole sensor as shown in Fig. 2c. It was comprised an NRF51 microcontroller and pressure sensors (FlexiForceSen-sorA401, Tekscan Inc., USA), which included the sensor deployed on the heel of the patient.
Finally, the value of the ratio, r , was determined using a test to verify Weber’s fraction, which was performed on three patients that had experienced strokes. Each sub-ject signed informed consents prior to testing, and basic information regarding these patients has been summa-rized in Table 1. The first value of r was set at 0.01. For each 5 steps taken, the time interval decreased accord-ing to specifications determined usaccord-ing Eq. (2) using this value for r . The patients were then asked whether they were able to feel frequency change after walking. If the patient did not recognize the change, 0.005 was added to r for the next trial. At the point where the frequency change was not recognized, the value of r was deemed to be Weber’s fraction, and r was set to the value of the
pre-vious walk. Table 2 depicts descriptive statistics values
(3)
T0 =
THS−HS′+ THS′−HS
2 .
used for the test. To choose a value applicable to most patients, the 95% confidence interval lower limit value 0.04 was selected to be the r value used.
In summary, nstep was set at five to ensure that at least three cueing changes, T0 were determined by measuring and averaging the heel strike patterns of patients before training. Further, r was set to 0.04, a value based on pre-liminary tests to verify Weber’s fraction using the three patients who had experienced stroke.
Proof of concept study
Objective
Our goal in developing this system was to decrease the time interval of cadence cueing to a point where it would not be recognized during the walking rehabilitation of patients. Thus, we expected the patient’s walking speed to increase, without the patient noticing that stimuli had changed throughout the process of training. To evaluate these functions of our system, a proof of concept study was conducted using 6 patients that had experienced stroke.
Ethical approval and consent to participate in the study All procedures were approved by the Waseda University Ethics Committee for Human Research. After a complete description of the procedures and purpose of the study had been given, written informed consent was obtained from all participants (Approval Number: 2015-087(2)).
Participants
Table 3 shows the basic information and characteristics of the patients. Participants included six patients who had experienced stroke (mean age: 67.3 ± 5.5 years). Inclusion criteria were as follows: (a) Brunnstrom recovery stage
Fig. 3 Asymmetrical gait of a hemiplegic patient
Table 1 Characteristics of patients participating in the study
Brs. Brunstrom’s recovery stage, MMSE Mini-Mental-State Examination Score Sex Age Brs. Hypoesthesia MMSE Duration
of time since the onset (months)
Male 69 III Dull 27 < 4
Male 79 V Dull 28 < 3
Male 60 VI Dull 30 < 6
Table 2 Statistical analysis
Sample number 3
Standard deviation 0.013
95% confidence interval lower limit 0.040
Average 0.072
III (i.e., patients could initiate lower limb movements but were unable to control them well) or above, (b) abil-ity to communicate well and sufficiently understand the instructions provided by the researcher (i.e., no demen-tia), and (c) patients could not have other medical con-ditions that may interfere with walking test performance and trial design.
Procedure
The test was conducted at the Tokyo General Hospital. In the pre-test phase, the patient was asked to walk twice for 10 m at a preferred speed. Meanwhile, the insole sensor was used to calculate the initial value, T0 , using Eq. (3). In the training phase, the patient wore the pelvic belt and walked the 10 m course five times with the appropriate cueing cadence. During the patient’s walk, we decreased the time interval of each cue every 5 steps by manipulat-ing the rotatory switch. Finally, the post-test phase was conducted by asking the patient to walk for 10 m two separate times at his/her preferred speed without cue-ing, which was the same as for the pre-test. After the test, patients were asked whether they noticed any changes in stimuli.
Dependent variables
Cadence and walking speed were selected as indices for verifying the effect of cueing-training during the trial. Cadence was measured by an inertial-type gait analysis sensing system (RehaGait, Hosomed Gmbh, Germany) [16]. Walking speed was measured using a 10-m walking test [17], which is a typical method used for the evalua-tion in the context of clinical gait analysis. In addievalua-tion, we measured the circumduction of the hip joint of the para-lyzed side during the trial using RehaGait. This measure-ment shows the degree of compensation of movemeasure-ment utilized by patients. Lastly, the stance time ratio of the
paralyzed and non-paralyzed side was selected as an index value to evaluate gait asymmetry. This was defined as follows:
where tparalyzed is the stance time of the paralyzed side, and thealthy is the stance time of non-paralyzed side. An
rstance of 1 indicates perfect stance symmetry for both
sides. These indices were all measured by RehaGait.
Statistical analysis
The Friedman’s test is an ideal statistic to use within a repeated measures type of experiment to determine whether a particular factor has an effect. Thus, the Fried-man test followed by the Dunn’s post hoc test was used to compare differences among three trials (i.e., pre-test, training and post-test). All tests were two-tailed and were considered significant if p-values were less than 0.05.
Results
The results of the study have been shown in Table 4, and individual data for cadence and walking speed were shown in Table 5.
Cadence
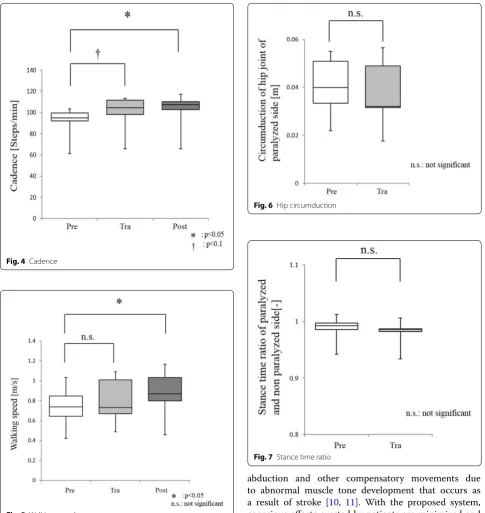
Average cadences at pre-test, during training, and post-test were 91.18, 99.72, and 101.68 steps/min, respectively. The cadence speeds were significantly increased both during training (p = 0.0695) and post-test (p = 0.0155) when compared to the pre-test (Fig. 4).
Walking speed
Average walking speeds measured pre-test, during train-ing, and post-test were 0.737, 0.799, and 0.870 m/s, respectively. Walking speeds post-test were significantly increased relative to pre-test values (p = 0.0342) but dur-ing the traindur-ing (p = 0.2331) increases were not signifi-cant (Fig. 5).
Circumduction of hip joint of paralyzed side
Figure 6 shows that the average circumduction of hip joint of paralyzed side during pre-test and training peri-ods were 0.0404 and 0.0374 m. Thus, circumduction did not change significantly throughout training (p = 0.4142).
Stance time ratio of paralyzed and non‑paralyzed sides The average stance time ratio of paralyzed and non-par-alyzed sides during pre-test and training periods were 0.987 and 0.980, respectively. No significant changes were observed in stance time ratios of paralyzed and
(4)
rstance=
tparalyzed
thealthy ,
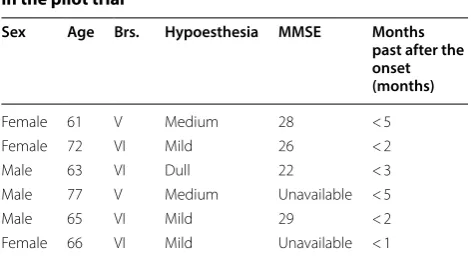
Table 3 Basic characteristics of patients included in the pilot trial
Brs. Brunstrom’s recovery stage [14], MMSE Mini-Mental-State Examination Score [15]
Sex Age Brs. Hypoesthesia MMSE Months past after the onset (months)
Female 61 V Medium 28 < 5
Female 72 VI Mild 26 < 2
Male 63 VI Dull 22 < 3
Male 77 V Medium Unavailable < 5
Male 65 VI Mild 29 < 2
non-paralyzed sides throughout training (p = 1.00) (Fig. 7).
Discussion
The purpose of this research was to develop a vibro-tactile cueing device that is able to recognize implicit increases in cadence frequency and to conduct a proof-of-concept study using patients that had experienced stroke to examine the applicability of the developed system. The system developed here, through the provi-sion of rhythmic stimulation, improved cadence in six stroke patients. Furthermore, walking speed, which is a criterion for complex gait evaluation, improved after training. Hip abduction, which is an index of abnormal gait, did not worsen from use of the system. Further-more, patient did not notice any changes with respect to cadence or walking speed being provided rhythmically
throughout tests. These results suggest the possibility that the proposed system may be used to allow walk-ing speeds to improve in a natural manner (without the patient having to expend any effort increasing walking speed).
It has been reported that in general, the cadence of healthy individuals in normal walking is approximately 100–130 [18]. In the pre-test of this study, the walk-ing cadence of patients was 91.18 which was lower than that of healthy individuals, and the cadences were 99.72 and 101.68 during training and post-training, respectively, indicating the improvement to the level of healthy individuals. Therefore, the improvement of cadence with this system may have demonstrated that the long-term training is valuable to be implemented. However, when focused on individual data, this sys-tem improved walking performances including cadence Table 4 Comparison of specific tests at pre-training, training and post-training phases
a Median values (interquartile range)
b Dagger (✝), P ≤ 0.1; single asterisks, P ≤ 0.05; (Friedman’s test) c n = number of patients
Variablea Pre (n
= 6c) Training (n
= 6) Post (n = 6) p‑valueb
Pre‑tra Pre‑post
Cadence (steps/min) 95.07 (92.00–99.67) 104.46 (98.00–111.67) 107.45 (102.75–110.05) 0.0695✝ 0.0155*
Walking speed (m/s) 0.739 (0.643–0.844) 0.732 (0.671 –1.009) 0.869 (0.798–1.030) 0.2331 0.0342* Circumduction of hip joint
of paralyzed side (m) 0.0399 (0.0334–0.0509) 0.0321 (0.0316–0.0489) – 0.4142 –
Stance time ratio of para-lyzed and non-parapara-lyzed side (–)
0.992 (0.985–0.997) 0.986 (0.982–0.986) – 1.00 –
Table 5 Individual data for cadence and walking speed at pre-training, training and post-training phases
Pre Training Post
Cadence (steps/min)
Patient A 103.47 108.20 108.89
Patient B 91.00 112.83 117.16
Patient C 61.27 65.91 65.90
Patient D 101.17 113.53 110.43
Patient E 95.18 100.71 106.01
Patient F 94.96 97.09 101.66
Pre Training Post
Walking speed (m/s)
Patient A 1.03 1.08 1.16
Patient B 0.61 0.68 0.83
Patient C 0.42 0.48 0.45
Patient D 0.87 1.08 1.07
Patient E 0.73 0.77 0.90
and gait velocity in most patients. However, as the decreased performance was noted in Patient F, suggest-ing that the effects of the system may vary from patient to patient.
Walking is typically disabled by stroke, and impaired ambulation reduces QOL [4]. Thus, improving walk-ing speed is an important aspect of clinical treatment. However, excessive voluntary movement induces hip
abduction and other compensatory movements due to abnormal muscle tone development that occurs as a result of stroke [10, 11]. With the proposed system, conscious efforts exerted by patients are minimized and walking state is altered by making very fine changes to rhythmic stimulation patterns. Consequently, applying this technology may provide a cueing system applicable to stroke patients in clinical settings.
An experimental constraint of this research is that it is a proof of concept study, therefore, the sample size is small. In addition, verifying the influence of repeated practice in order to identify long-term changes will be required to produce a more complete determination of the usefulness of the system.
Fig. 4 Cadence
Fig. 5 Walking speed
Fig. 6 Hip circumduction
One limitation of this study was the possible influence of order effect. Significant differences were observed in the cadence and gait velocity between the pre-test and post-test values. However, the cadence during training showed an improving trend that was not statistically sig-nificant compared to that in the post-test, and the gait velocity during training was not significantly different from that in post-test. These results may have been influ-enced by the habituation to walking through training. In subsequent experiments, the more robust design is needed to evaluate the effect, setting up a control group.
Conclusion
We have developed a device that has the capacity to improve cadence by implicitly changing gait rhythms. In a proof-of-concept study using stroke patients, cadence was improved without patients noticing, and walking speed improved after training with the system. There was also no worsening of hip abduction, which is a meas-ure of compensatory movement that occurs when walk-ing post-stroke. In addition, the patients were unaware improvements to cadence during training. The results of this proof-of-concept study suggest the possible applica-tion of the device developed here, but verificaapplica-tion with a more robust study that includes a greater number of test subjects will be required before clinical application.
Abbreviations
QOL: quality of life; JND: just noticeable difference.
Acknowledgements
The authors express gratitude to Zenyuu Ogawa for assisting in hardware design.
Authors’ contributions
KY performed the design of this study, acquisition and analysis of data, and drafted the manuscript. YH and AT made contributions to the development and analysis of the data. HI was involved in the conception of the system and design of the study. All authors read and approved the final manuscript.
Funding
This study was supported by the Japanese Society for the Promotion of Science (JSPS), Grant-in-Aid for Scientific Research (C) No. 17K01875, and Research Institute for Science and Engineering, Waseda University, Grant-in-Aid for Junior Researchers.
Availability of data and materials
The data that support the findings of this study are available from the cor-responding author upon reasonable request.
Ethics approval and consent to participate
Ethical approval was granted by the Ethics Committee of Waseda University.
Consent for publication
Written informed consent for the publication of clinical details and/or clini-cal images was obtained from all patients.
Competing interests
The authors declare that this research was conducted without any commer-cial or financommer-cial relationships which could be construed as a potential con-flict of interest. The authors declare that they have no competing interests.
Author details
1 Research Institute for Science and Engineering, Waseda University, 3-4-1 Okubo, Shinjuku-ku, Tokyo 169-8555, Japan. 2 Graduate School of Creative Science and Engineering, Waseda University, 3-4-1 Okubo, Shinjuku-ku, Tokyo, Japan. 3 Department of Modern Mechanical Engineering, Waseda University, 3-4-1 Okubo, Shinjuku-ku, Tokyo, Japan.
Received: 1 October 2019 Accepted: 26 December 2019
References
1. Toyoda K (2013) Epidemiology and registry studies of stroke in Japan. J Stroke 15:21–26
2. Otter A, Geurts A, Mulder T, Duysens J (2007) Abnormalities in the temporal pattering of lower extremity muscle activity in hemiparetic gait. Gait Posture 25:342–352
3. Perry J, Burnfield J (2010) Gait analysis: normal and pathological func-tions, 2nd edn. Slack Incorporated, New Jersey
4. Schmid A, Duncan P, Studenski S, Lai S, Richards L, Perera S, Wu S (2007) Improvements in speed-based gait classification are meaningful. Stroke 38:2096–2100
5. Ginis P, Nachaerts E, Nieuwboer A, Heremans E (2018) Cueing for people with Parkinson’s disease with freezing of gait: a narrative review of the state-of-the-art and novel perspectives. Ann Phys Rehabil Med 61:407–413
6. Ebersbach G, Edler D, Kaufhold O, Wissel J (2008) Whole body vibration versus conventional physiotherapy to improve balance and gait in Parkinson’s disease. Arch Phys Med Rehabil 89:399–403
7. Nascimento L, Oliverira C, Ada L, Michaelsen S, Teixeira-Salmela L (2015) Walking training with cueing of cadence improves walking speed and stride length after stroke more than walking training alone: a systematic review. J Physiother 61:10–15
8. Park J, Lim H, Song C (2015) The effect of external cues with vibra-tory stimulation on spatiotemporal gait parameter in chronic stroke patients. J Phys Ther Sci 27:377–381
9. Ivanenko Y, Grasso R, Lacquaniti L (2000) Influence of leg muscle vibra-tion on human walking. J Neurophysiol 84:1737–1747
10. Bhakta B, Cozens J, Chamberlain M, Bamford J (2001) Quantifying associated reactions in the paretic arm in stroke and their relationship to spasticity. Clin Rehabil 15:195–206
11. Adkin A, Frank J, Carpenter M, Peysar G (2000) Postural control is scaled to level of postural threat. Gait Posture 12:87–93
12. Simon G, Bastien O, Roussel Marie-Ève (2001) About optimal timing and stability of Weber fraction for duration discrimination. Acoustical Sci Technol 22(5):370–372
13. Öberg T, Karsznia A, Öberg K (1993) Basic gait parameters: refer-ence data for normal subjects, 10–79 years of age. Int J Rehabil Res 30:210–223
14. Brunnstrom S (1970) Movement therapy in hemiplegia. Harper & Row, New York
15. Lancu I, Olmer A (2016) The minimental state examination—an up-to-date review. Harefuah 145:687–690
16. Donath L, Faude O, Lichtenstein E, Nüesch C, Mündermann A (2016) Validity and reliability of a portable gait analysis system for measuring spatiotemporal gait characteristics: comparison to an instrumented treadmill. J Neuroeng Rehabil 20:6
17. Murray MP (1967) Gait as a total pattern of movement: including a bibliography of gait. Am J Phys Med 46:290–333
18. Tudor-Locke C, Aguiar EJ, Han H, Ducharme SW, Schuna JM, Barreira TV, Moore CC, Busa MA, Lim J, Sirard JR, Chipkin SR, Staudenmayer J (2019) Walking cadence (steps/min) and intensity in 21–40 year olds: CADENCE-adults. Int J Behav Nutr Phys Act. 16(1):8
Publisher’s Note