Sneha GDhanvijay Prof. Vibha Bora
Student Assistant Professor
Department of Electronics & Telecommunication Engineering Department of Electronics & Telecommunication Engineering G.H. Raisoni Academy of Engineering & Technology Nagpur,
Maharashtra, India
G.H. Raisoni Academy of Engineering & Technology Nagpur, Maharashtra, India
Abstract
The primary sign of breast cancer is presence of microcalcification clusters; however, it is difficult and time consuming for radiologists to classify microcalcification as malignant or benign. In this paper, we introduce highly accurate method based on a morphological image processing and Wavelet Transform technique to detect the microcalcification in mammograms. By using multistructure elements morphological processing the microcalcification are firstly enhanced. Then, candidates of microcalcification are refined by a multilevel Wavelet reconstruction approach. The objective of this project is to improve the segmentation, sensitivity, and specificity. The purpose of this synopsis is by using HAAR Wavelet Transform comparing with state of art method we will try to achieve better result.
Keywords: Breast cancer, Microcalcifications, Segmentation, Mammography, Wavelet Transform, Classification _______________________________________________________________________________________________________
I. INTRODUCTION
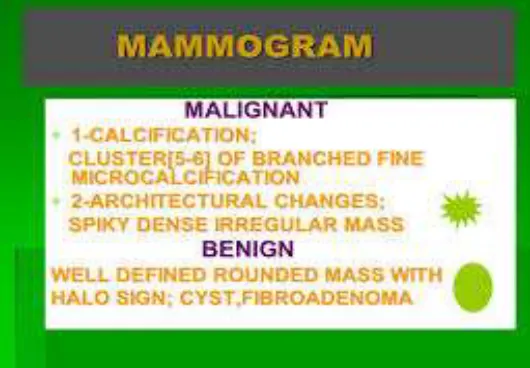
Breast cancer is currently the most common cancer affecting women worldwide. Cancer is the leading cause of death, causing one in six of all deaths from cancers in European women. Also in the in the U.S. women have 12.5% (about one in eight) risk of developing breast cancer during her lifetime. Mammography is one of the most reliable and effective methods for detecting breast cancer. The presence of microcalcification clusters is a primary sign of breast cancer. Microcalcifications are small deposits of calcium salts within breast tissues which appear as small bright spots in mammograms. It is very difficult to diagnosis for radiologist microcalcification clusters when form within dense tissue which has high and homogeneous intensity.
1) Malignant: Malignant tumours are cancerous and are made up of cells that grow out of control. Cells in these tumours can invade nearby tissues and spread to other parts of the body. Sometimes cells move away from the original (primary) cancer site and spread to other organs and bones where they can continues to grow.
2) Benign: Benign tumours are not cancerous. They often be removed, and in most cases, they do not come back. Cells in Benign tumours do not spread to other parts of the body.
Fig. 2: Malignant tumours Are cancerous Fig. 3: Benign tumours Are not cancerous
II. DETECTION OF MICROCALCIFICATION IN MAMMOGRAM USING WAVELET TRANSFORM
Flowchart:
Detection of Microcalcifications:
In this section, we propose a new method which is based on a morphological filtering technique to enhance the individual microcalcifications detection. There are many methods of microcalcifications detection in mammograms. The basic idea of the method is to use a orthogonal 2-D wavelet transform to obtain Hessian matrix of every pixel, after then microcalcifications were detected by computing based on multi-structuring elements of which sizes and shapes are fitted to the individual microcalcifications to enhance them
Fig. 5: ROI image
An appropriate structuring element fitting to the target objects is the key. Since in mammograms an individual microcalcifications frequently vary both in size and shape, it is imposable to use a single structuring element to remove all of them. To find an answer this problem, we use a multi-structuring-based method which uses eight different flat structuring elements.
Dual- Tree Complex Wavelet Transform:
The purpose behind Dual-tree complex wavelet transform is stimulated from Fourier Transform which does not suffer from shift variance. Kingsbury put forward to construct a complex-valued wavelet basis also forms a Hilbert pair.
Ψc (x) = ψr(x) + jψi(x)
Dual-tree complex wavelet transform can decompose a signal into real and imaginary components as fourier Transform.
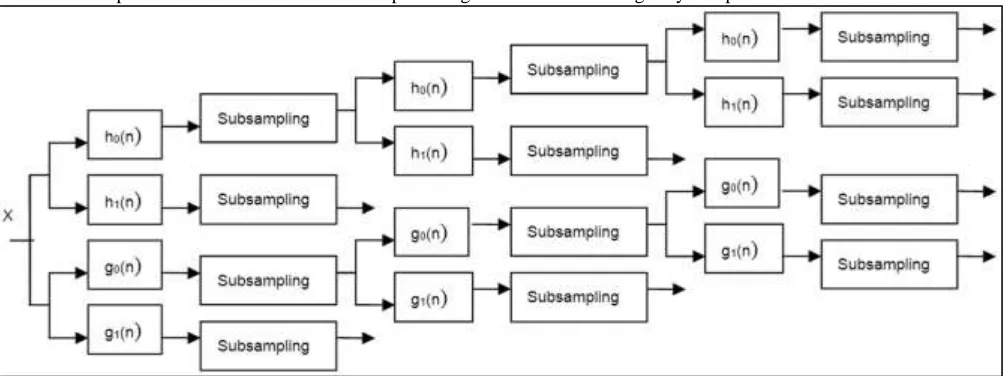
Fig. 6 practical implementation of Dual-tree complex wavelet transform on 1-D signal. x stands for the input signal. h0 (n) and h1 (n) represent the low-pass and pass filter pair for the upper filter bank, go (n) and g1 (n) represent the low-pass and high-pass filter pair for the lower filter bank, respectively.
III. IMPLEMENTATION
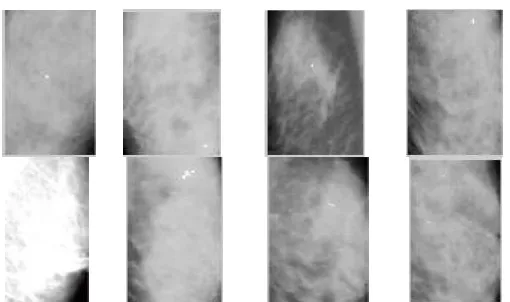
Fig. 7: ROIs containing microcalcifications. Total eight ROIs were selected, and every ROI included a number of micro-calcifications with varied shape, size and distribution.
Methods to Detect Microcalcifications:
1) Difference image technique 2) Wavelet transform
3) By using first and second step we got binary image containing microcalcifications. Then, logical ‘AND’ operation was taken
Dataset and ROI selection ROIs of clinical dataset of mammograms choose and decided by four experienced senior radiologists. Each mammogram is of 1024 ×1024 pixels, with a spatial resolution of 50um/pixel. Fig.4 and fig5 shows a typical mammogram in MLO view from Mammography Image Analysis Society (MIAS) and clinical dataset respectively. We used 50 ROIs with a size of 128 × 128 pixels, in which there are 25 normal ROIs and 25 ROIs including microcalcifications. Fig.7 shows eight ROIs containing microcalcifications. After we used 50 ROIs with a size of 128 × 128 pixels, in which included 25 normal ROIs and 25 ROIs containing microcalcifications? Fig.7 shows eight ROIs containing microcalcifications. After we obtained the ROIs, we stretched their gray scales to [0,255] according to the following expression:
G1(x,y) = (G0(x,y) – min(G0)) × 255/max(G0) – min(G0)
Where, G0(x,y) is the original grey value of the point(x,y), G1(x,y) is the grey value of the point(x,y) in the ROI after grey normalization.
1) Difference image technique: Laplace operator: The Laplace filtering make it sharp a figure and enhance the high – frequency components. Smooth filtering operator: smooth filtering makes it blur a figure and suppress the high-frequency components. Then detect the edge of using Kirsch operator, f1 represents figure filtered by Laplace operator, f2 represents figure filtered by 3×3 smooth filtering operator f3 obtained subtracting f2 from f1 and image. Then detect the edge of f3 using Kirsch operator and get binary segmentation.
2) Wavelet transform: By the simulation and analysis, the high-pass sub-band of first level be composed of high-frequency components and the high-pass sub-band of fourth level be composed of some low-frequency components. Hence, the original image was decomposed by Daubechies wavelet at level four and the coefficients of the first layer and the fourth layer were set to zero. Then the wavelet reconstruction was done.
3) AND operation: Then, logical ‘And’ operation was taken on the results of the two steps. Which they are the first step, we got binary image containing microcalcifications and noise. Also after the second step, we got a binary image containing micro-calcifications and background.
Fig. 9: original image Fig. 10: wavelet threshold image
Fig. 11: Region with microcalcifications
Fig. 12: Results of microcalcifications detection Microcalcifications were detected effectively.
IV. CONCLUSION AND FUTURE SCOPE
In conclusion, compared with other technique, wavelet transform (DB4) could use to detect the microcalcifications more effectively. It helps the radiologist as second reviewer to evaluate screening mammograms. We can extend this work to include real time image analysis without the dataset using ANN and other machine learning algorithms.
REFERENCES
[1] Zhili Chen,Harry Strange “Topological Modeling and Classification of Mammographic Microcalcification Clusters” IEEE Transaction on biomedical engineering,vol.62,no.4,april,2015
[2] Gua Jinghuan,(1974), fmale, Liaoning Changtu Country, Doctor, Associate proffessor, Research on Image processing and pattern Recognition “Study on Microcalcification Detection using Wavelet Singularity” International Journal of Signal Processing, Image Processing and Pattern Recognition Vol.7, No.1,2014
[3] Xiaoyong Zhang, Noriyasu Homma, Shotaro Goto, Yosuke, Kawasumi, Tadashi Ishibashi, Makoto Abe, Norihiro Sugita, and Makato Yoshizawa “A Hybrid Image Filtering Method for Computer-Aided Detection of microcalcification clusters in mammograms” Research Article Hindawi Publishing Corporation Journal of Medical EngineeringVolume 2013,
[6] S.Yu and L.Guan, “ACAD system for the automatic detection of clustered microcalcifications in digitized mammogram films,”IEEE Transactions on Medical Imaging, vol. 19, no. 2, pp. 115– 126, 2000