ISSN (e): 2250-3021, ISSN (p): 2278-8719
Vol. 09, Issue 8, August. 2019, ||Series -I || PP 63-68
Analysis of the Micro-Hardness Variation of the SS-316L Welded
Sheet with Coating and Without Coating
1
Dr. Sandeep Sharma,
2Er.Rupinder Singh
1Professor, 2 Research Scholar 1&2
Department of Mechanical Engg.,DeshBhagat University, MandiGobindgarh, Punjab, India Corresponding Author:Dr. Sandeep Sharma
Received 12 August 2019; Accepted 26 August 2019
Abstract:
Stainless steel is the category of containing approximately equal amounts of ferrite and austenite. They have desirable properties of both austenitic and ferritic stainless steels, such as low temperature toughness, high tensile strength and excellent resistance to corrosion, particularly chloride stress corrosion cracking). Consequently, they are used increasingly as alternatives to austenitic stainless steels, especially in chloride or sulphide environments, for example, in the manufacture of pipelines for transportation of oil and gas. However, one of the limitations in using these grade steels is as welded components, where poor welding has induced adverse microstructural features and consequently increased the susceptibility to various forms of corrosion such as stress corrosion cracking and intergranular corrosion. The whole work is divided into two parts In the first part SS-316L steel metal plate with 10 mm wall thickness was used in this study. Single pass &Multi-pass welding was carried out using standard gas tungsten arc welding (GTAW). A technique for the Hardness measurements on the different weld regions using Vickers micro-hardness was done. In the second part the welded pieces are coated with TiN Nano structure with 3µm thickness. Vickers hardness measurement showed relatively higher values for coated welded over the with coated weld regions also compared to the base metal.Key Words:
SS-316L, GTAW, SEMI.
INTRODICTION
1.1.Gas-Tungsten Arc Welding (GTAW)
This process is also known as tungsten–inert gas (TIG) welding. This is similar to the Gas- Metal Arc Weldingprocess. Difference being the electrode is non consumable and does notprovide filler metal in this case. A gas shield (usually inert gas) is used as in the GMAWprocess. If the filler metal is required, an auxiliary rod is used [4].
Figure 1 Plasma Arc Welding (PAW) [4]
1.2.About Base material SS316L
1.3.Mechanical Properties
Room Temperature Tensile Properties Minimum mechanical properties for annealed Types 316, 316L, 317 and 317L austenitic stainless steel plate, sheet and strip as required by ASTM specifications A240 and ASME specification SA-240, are shown in table 1.
Table 1 Shows Mechanical Properties of Base material [5]
Property Minimum Mechanical properties required
Type 316 Type 316L Type 317 Type 317L
Yield Strength (MPa) 205 170 205 205
Ultimate Strength (MPa) 515 485 515 515
Percentage Elongation (mm) 40.00 40.00 35.00 40.00
Hardness (HV) 95 95 95 95
1.4.Plasma Torch coating
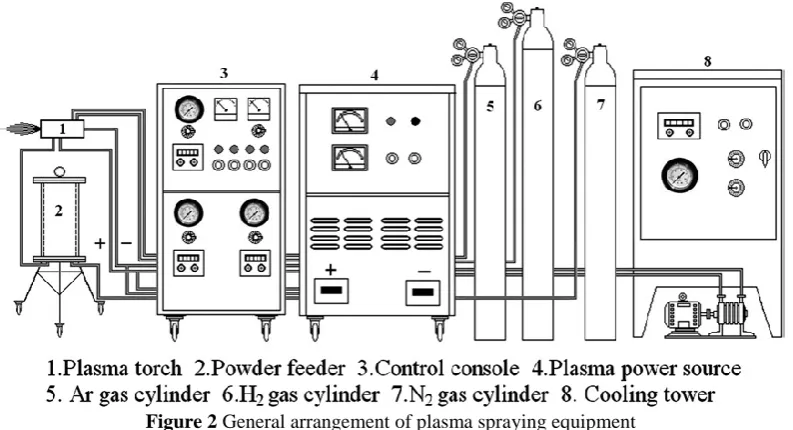
In plasma torch input power level was kept at11kW. The powder injection was external from the nozzle and directed towards the plasma. Argon and hydrogen plasma mixture gas used as carrier gas. The powder feed rate of 15 gm/min was kept constant, using a turntable type volumetric powder feeder. A four stage closed-looped centrifugal 37 pump (water cooling) used for cooling the system, regulated at a pressure of 10kg/cm2 supply. The typical arrangement of the plasma spray equipment and schematic diagram of the plasma spraying process are shown in Figure 2. The equipment consists of the following units:
1. Plasma spraying equipment
2. Control console
3. Powder feeder
4. Power supply
5. Stand-off-distance of torch
6. Torch cooling system (water)
7. Carrier gas supply
8. Hoses, cables, gas cylinders and accessories
Figure 2 General arrangement of plasma spraying equipment
Table 2 Operating parameters during coating deposition.
Operating parametrs Value
Plasma Arc Current (amp.) 260-500
Arc Voltage (volt) 40-44
Torch input power (KW) 11
Plasma gas (argon) flow rate (IPM) 28
Secondry gas (N2) flow rate (IPM) 3
Carrier gas (Ar) flow rate (IPM) 12
Poweder feed rate (gm/min) 15
Mann et al.(2001) compared the abrasion and silt erosion characteristics of plasma nitriding and HVOF coatings along with commonly used steels in hydro turbines. For silt erosion characterisation, hydrofoils scaled down to 1/10 of the actual hydro turbine blade were selected. Angles of incidence, velocity and Reynolds numbers were maintained similar to those that commonly occur in hydro turbines, simulating low as well as high-energy impingement wear. The abrasive wear characterisation was carried out as per ASTM G-65. HVOF coated steel performed much better than plasma nitrided 12Cr and 13Cr–4Ni steels. Plasma nitrided 12Cr steel performed better than plasma nitride 13Cr–4Ni steel. This is due to its higher micro hardness and its ability to absorb more nitrogen under identical plasma nitriding experimental conditions. Based on this experimental study, HVOF and plasma nitrided 12Cr steel are being field-tried on a hydro turbine component, which is severely affected due to abrasion and silt erosion.
Sheng Hong et al.(2014) prepared a Cr3C2-NiCr coating by means of high-velocity oxygen fuel (HVOF) thermal spraying process and analyzed with regard to their cavitation-silt erosion (CSE) behavior under different sediment concentration conditions. It is found that Cr3C2, Cr7C3, Cr2O3 and (Cr, Ni) phases are obtained in the coating. The binder matrix contains amorphous phase and nano crystalline grains. The crystallization temperature of the amorphous phase is about 559 °C. The coating exhibits low porosity and high microhardness. After being eroded for 20 h, the CSE mass loss of the coating in 40 kg/m3 is 1.15 and 1.23 times to that in 20 kg/m3 and in 0 kg/m3, respectively. Due to increase in interaction area of sand particles with specimen, the CSE rate is found to increase progressively as sediment concentration increase. Signatures of lips, craters, microcutting, cracks and micropores are observed on the eroded surface of the coating. The CSE mechanism for the coating is a composite ductile and brittle mode. The HVOF sprayed Cr3C2-NiCr coating has a uniform microstructure. The as-sprayed coating consists of primary carbides, chromium oxide and a mixture of amorphous and nano crystalline binder phases. The average Vickers micro hardness value of the coating (1187±86 Hv) is much higher than that of the stainless steel 1Cr18Ni9Ti (198±15 Hv). CSE rate was found to increase progressively with the increase in sediment concentration. The NiCr binder phase in the coating has been eroded preferentially in 20 kg/m3 and 40 kg/m3 conditions, whereas the NiCr binder phase was removed together with the carbide particles in 0 kg/m3 condition
Sheng Hong et al.(2014) prepared a Cr3C2-NiCr coating by means of high-velocity oxygen fuel (HVOF) thermal spraying process and analyzed with regard to their cavitation-silt erosion (CSE) behavior under different sediment concentration conditions. It is found that Cr3C2, Cr7C3, Cr2O3 and (Cr, Ni) phases are obtained in the coating. The binder matrix contains amorphous phase and nano crystalline grains. The crystallization temperature of the amorphous phase is about 559 °C. The coating exhibits low porosity and high microhardness. After being eroded for 20 h, the CSE mass loss of the coating in 40 kg/m3 is 1.15 and 1.23 times to that in 20 kg/m3 and in 0 kg/m3, respectively. Due to increase in interaction area of sand particles with specimen, the CSE rate is found to increase progressively as sediment concentration increase. Signatures of lips, craters, microcutting, cracks and micropores are observed on the eroded surface of the coating. The CSE mechanism for the coating is a composite ductile and brittle mode. The HVOF sprayed Cr3C2-NiCr coating has a uniform microstructure. The as-sprayed coating consists of primary carbides, chromium oxide and a mixture of amorphous and nano crystalline binder phases. The average Vickers micro hardness value of the coating (1187±86 Hv) is much higher than that of the stainless steel 1Cr18Ni9Ti (198±15 Hv). CSE rate was found to increase progressively with the increase in sediment concentration. The NiCr binder phase in the coating has been eroded preferentially in 20 kg/m3 and 40 kg/m3 conditions, whereas the NiCr binder phase was removed together with the carbide particles in 0 kg/m3 condition
II.
METHODOLOGY
1. Cut the 10mm thick plate of SS-316L into a size of 50*100 mm
2. Join the plates by Gas-Tungsten Arc Welding at different Current, Voltage, Speed & Weld pass
3. Prepare the Specimen one without coating and second with coating
4. Prepare the specimen for testing
5. Perform the non-destructive testing like EDX, SEM of samples
6. Compare the each test results with coating of weld specimen & without coating.
Table 3 Experimental Welding variable used
Sr.no. Voltage Range (Volts) Current range (Ampere) Travel Speed mm/min Weld Pass
1. 9-12 90 – 95 63 -75 1
2. 9-12 100 – 115 75 -80 2
III.
RESULTS & DISCUSSIONS
a. Vickers Hardness MappingHardness testing was perfomed in accordance with ASTM standard E92-82 on a LECO Model LM 247AT micro-hardness tester with a Vickers indenter. The machine was calibrated using a hardness standard of 543HV. The samples were placed under the lens of the LECO machine, with an image of the surface magnified 500x displayed on the computer connected to the machine. After the region of interest was in focus, the test was run; the lens automatically rotated out and the diamond indenter rotated into position. The ConfiDent and PAXCAM software packages were used to determine the depth of each indent and the hardness of each point.
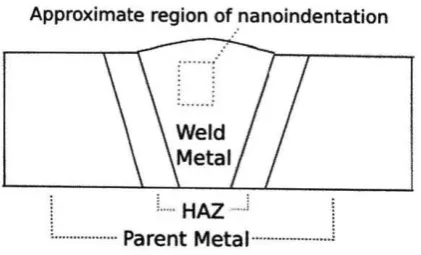
The Vickers hardness tests were performed with a test load of 500 gfand a dwell time of 15 seconds. Once the test was completed, the lens rotated back into position, allowing the size of theindent to be measured. Once the corners were manually identified, the computer used the lengths of the diagonals, to calculate the Vickers hardness number for that point. This data point was taken within the HAZ of thesample; the diagonals were measured to be 65.66 pm (horizontal) and 65.48 pm (vertical), giving an HV of 216 of the base metal. The hardness was evaluated in a grid over the surface of the sample, with indents performed 1.905 mm (3/40 of an inch) apart. This distance was chosen in order to prevent effects from workhardening. The region mapped for each sample is shown in Figure 3(a) & 3(b).
Figure 3 (a): The region of the weld face covered by Vickers Hardness testing. The entire weld and HAZ region is tested.
An increase in hardness is observed in the weld metal, mainly with the increase in travel speed & weld pass. Hardness values ranging from 271 HV to 290 HV are observed for the weld pass 1 while values ranging from 309 HV to 335 HV.
The current range at 90-95A shows the lowest hardness with respect to other weld passes but very close to those for the base metal. It has values ranging from 271 HV are observed. This might be correlated to higher ferrite content, relatively higher average grain size, existence of hardening precipitates (such as sigma and chi phases), and higher concentration of interstitial atoms (such as C, and N) in the ferrite and austenite grains. It is well-known that ferrite content is considered the primary determinant factor of hardness in stainless steels as Ferrite is harder (and stronger) than austenite. However, other factors such as grain size, presence of intermetallic precipitates, and concentration of interstitial atoms such as C, and N have a significant influence on the hardness of stainless steel alloys.
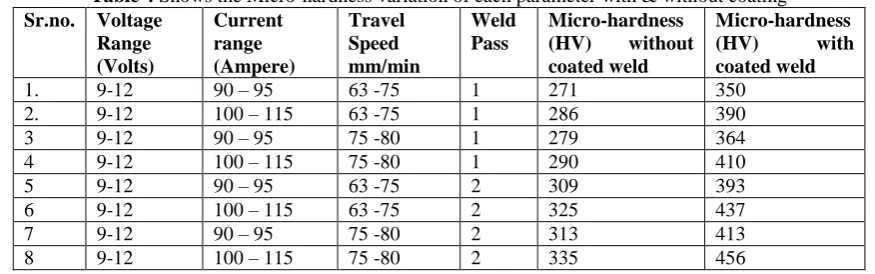
Table 4 Shows the Micro-hardness variation of each parameter with & without coating Sr.no. Voltage
Range (Volts) Current range (Ampere) Travel Speed mm/min Weld Pass Micro-hardness
(HV) without
coated weld
Micro-hardness
(HV) with
coated weld
1. 9-12 90 – 95 63 -75 1 271 350
2. 9-12 100 – 115 63 -75 1 286 390
3 9-12 90 – 95 75 -80 1 279 364
4 9-12 100 – 115 75 -80 1 290 410
5 9-12 90 – 95 63 -75 2 309 393
6 9-12 100 – 115 63 -75 2 325 437
7 9-12 90 – 95 75 -80 2 313 413
8 9-12 100 – 115 75 -80 2 335 456
Coating hardness measurement is carried out with Micro-Hardness Tester using is summarized in Table 4. Each data point is the average of four observations. From this table, it is observed that there is an increase in coating hardness with the increase in welding current. This may be due to the formation/transformation of compounds viz. Titanium-Nickel nano structure and alumina etc. to their allotropic forms and their compositional variations during spray deposition with the increase in welding current.
IV.
CONCLUSIONS
1. Increased hardness levels in the SS-316L at coated weld were correlated with microstructural
variations, particularly increasing ferrite content. Although ferrite content is the primary determinant factor in determining hardness in stainless steels as the ferrite is considered to be harder (and stronger) than austenite, other factors such as grain size, presence of intermetallic precipitates, and concentration of interstitial atoms such as C, and N have a significant influence on the hardness of stainless steel alloys.
REFERENCES
[1]. Alvarez-Armas, I. (2008) "Stainless steels: brief history and some recent alloys", Journal of Mechanical Engineering, Vol.1 pp51-67.
[2]. B.S. Mann and V. Arya, Abrasive and Erosive Wear Characteristics of Plasma Nitriding and HVOF Coatings: Their Application in Hydro Turbines, Wear, 2001, 249, pp 354–360
[3]. HamedTasallotiKashani, Paul Kah, JukkaMartikainen “Laser overlap welding of zinc-coated steel on aluminum alloy” 15th Nordic Laser Materials Processing Conference, Nolamp 15, 25-27 August 2015, Lappeenranta, Finland pp 565-571.
[4]. Miller Electric (2013) “Guidelines For Gas Tungsten Arc Welding (GTAW)”, December 2015 pp 1-24
[5]. Practical guidelines for the fabrication duplex stainless steels, International Molybdenum Association, 2001
[6]. PT Sheng Hong, Yuping Wu, Qian Wang, Guobing Ying, Gaiye Li, WenwenGao, Bo
Wang,WenminGuo,(2014)” Microstructure and cavitation-silt erosion behavior of high-velocity oxygen-fuel (HVOF) sprayed Cr3C2-NiCr coating Surface & Coating Technology”, pp 213-220
[7]. Sagar Amin and HemantPanchal “A Review on Thermal Spray Coating Processes” International Journal
of Current Trends in Engineering & Research (IJCTER) e-ISSN 2455–1392 Volume 2 Issue 4, April 2016 pp. 556 – 563.
International organization of Scientific Research
68 | Page
[9]. Wenquan Wang, Wenmo Li and HongyongXu “Microstructures and Properties of Plasma Sprayed Ni
Based Coatings Reinforced by TiN/C1-xNxTi Generated from In-Situ Solid-Gas Reaction” Materials 2017, pp 785 -795.
![Figure 1 Plasma Arc Welding (PAW) [4]](https://thumb-us.123doks.com/thumbv2/123dok_us/7800190.1660236/1.595.117.478.504.672/figure-plasma-arc-welding-paw.webp)