A Novel Automatic Facial Expression
Recognition Method Based on AAM
Li Wang, Ruifeng Li and Ke Wang
State Key Laboratory of Robotics and System, Harbin Institute of Technology, Harbin, China Email: [email protected], lrf100@ hit.edu.cn, wangke@ hit.edu.cn
Abstract —This paper proposes a novel method to recognize facial expression through Active Appearance Model (AAM) to extract facial regions based on Facial Action Coding System (FACS). It is composed of three parts: extraction of facial regions based on AAM, extraction of facial features by Gabor wavelet transformation, and expression recognition through Support Vector Machines (SVMs). AAM has better performance than other methods in eliminations of the influence of different facial region size, head pose and lighting condition and thus can effectively increase the recognition accuracy. Therefore it is used to extract facial regions before extracting features by Gabor wavelet transformation. Finally, SVMs is applied to recognize expression for its advantage of solving the problems of small sample size and overfitting. The feasibility and effectiveness of this method are evaluated and verified by experiments, and satisfactory results are achieved.
Index Terms—Facial expression recognition, Facial Coding Action System, Gabor wavelet transformation, Active Appearance Model, Support Vector Machines
I. INTRODUCTION
In recent decades, automatic facial expression recognition as a branch of artificial intelligence has gained increasing attention due to its wide application in the fields of human-computer interaction, medical treatment and intelligent robot system [1, 2, 3]. Albert Mehrabian, an American psychologist, indicated that facial expression played the most important role in communication [4]. It is considered to be an immediate and natural way of express emotions and intensions from human beings. Therefore, it is a main modality for information exchange in human’s daily life. And many open expression image databases and videos have been built for researchers all over the world to do research. The research in the domains of facial expression recognition, interpretation and animation are generated from it.
Recently, many researchers have proposed and accomplished multiple methods or systems for automatic facial expression recognition, which make significant impacts on its development or analysis. A computer vision system was proposed to observe the facial motion through an optimal estimation flow method coupled with
geometric, physical and motion-based dynamic models describing the facial structure [5]. A method for natural facial expression recognition based on the minimum number of Gabor wavelet with PCA by SVMs was proposed [6]. Two methods were proposed for expression recognition in facial image sequences using geometric deformation without the texture information through multiclass SVMs [7]. A method for automatically classification of facial images was proposed based on labeled elastic graph with 2D Gabor wavelet representation by LDA after doing PCA on the labeled graph vectors of the training set of images [8]. Ref. [9] proposed a method of automatic facial expression recognition by spatiotemporal descriptors with SVMs. A fuzzy recognition system was proposed by extracting facial features, like mouth, eyebrows, nose and so on as classification vectors for fuzzy interface system to recognize expression [10]. The different AAM and k-NN were used to recognize expression [11]. Ref. [12] presented a framework on multiple manifolds for expression analysis. ICA was employed on facial expression recognition [13, 14]. PCA coupling with feature selection algorithm was used to recognize expressions [15]. Multiple methods of feature extraction and selection were investigated for automatic facial expression recognition [16]. Gabor feature and Local Binary Pattern were used as feature vectors for expression recognition by SVMs [17]. Hence, the methods were different from facial feature extraction or classifier presented by a large number of researchers.
From the previous studies, there are many methods to extract facial features and recognize expressions, which aim at recognizing facial expression from static images or image sequences captured in the video. Many methods have been applied to recognize expressions on the whole face region in the image. However, some face regions are entirely unrelated to expression production, which can be removed from the region without influences on expressions recognition. Thus, the method in this paper is to extract the effective facial regions to improve recognition accuracy and effect by AAM, and recognize expressions through SVMs according to Gabor features.
The application of Gabor filters followed by SVMs in the field of classification or recognition is one of the leading methods in terms of its performance and generality [18]. In this paper, a simple, convenient and effective recognition method is proposed. Facial regions
Manuscript received June 29, 2013; revised September 7, 2013; accepted September 10, 2013.
are extracted by AAM based on FACS after detecting faces through Haar-like cascade classifier. Gabor wavelet transformation is applied to represent facial features in the facial regions. At last, SVMs is used to recognize expressions depending on Gabor feature vectors. In Section 2, the method is presented in detail. Experiments and results analysis are described in Section 3. Finally, conclusions are presented in Section 4.
II. FACIAL EXPRESSION RECOGNITION METHOD
A. The Framework of Our Method
The framework of the proposed method is shown in Fig. 1. After detecting faces by cascade classifier, the facial regions are segmented, extracted and normalized by AAM. Gabor filters are used to characterize facial features as recognition vectors. SVMs is employed to recognize expression through Gabor features.
B. Facial Regions Extraction
In [19], it described the problem space for facial expression analysis, which included levels of description, transitions among expressions, distinctions between deliberate and spontaneous expressions, reliability and validity of training and test data, individual differences among subjects in facial features and related characteristics, head orientation and scene complexity, image characteristics, and relation to other non-verbal behavior. The reduction of the influences of condition (like illumination), head orientation, and different size of face regions is very necessary before extracting facial features. AAM was a powerful generative parametric model for non-rigid visual objects. Since proposed by Edwards et al [20], the method has been widely applied in
image modeling, alignment, and facial expression recognition and tracking problems [21, 22]. This model handles lighting change, face pose and occlusion effectively[23]. Therefore, it is used to extract and align facial regions before extracting Gabor features.
The correct detection and precise location of a face in still images, image sequences, or videos is a prerequisite for the following parts of facial expression recognition system from previous researches. The cascade classifier is used to detect origin face, which is based on Haar-like features developed last century. The feature prototypes are scaled independently in vertical and horizontal direction in order to generate a rich, overcomplete set of features [24]. Some of these feature prototypes are shown in Fig. 2. The cascade classifier constructed by these features is fast and precise for object detection.
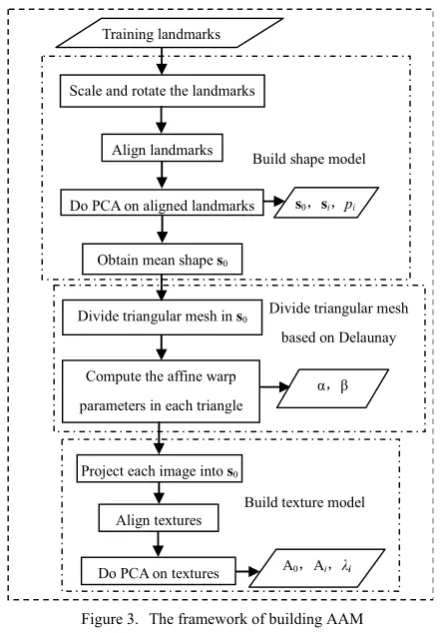
After detecting face regions in images, AAM is built which coupled the shape and texture of face images [25]. Its building process is shown in Fig. 3.
Mathematically, the shape of AAM is defined as the coordinate of n vertices composed of facial regions in the image:
s=
(
x1,y2,",xn,yn)
(1)Training landmarks
Scale and rotate the landmarks
Align landmarks
Do PCA on aligned landmarks s0,si,pi
Divide triangular mesh in s0
Compute the affine warp parameters in each triangle
Project each image into s0
Align textures
Do PCA on textures A0,Ai,λi
Build shape model
Build texture model Divide triangular mesh
based on Delaunay
α,β
Obtain mean shape s0
Figure 3. The framework of building AAM Segment the face from the image
Detect face in the image
Extract features in the facial regions
Classify facial expressions Enhance the contrast of facial regions
Image in the database
Extract facial regions using AAM
Extract facial features by Gabor wavelet transformation
Use SVMs to recognize Extract facial regions
Figure 1. The framwork of the proposed work
Each shape vector includes 68 vertices in shape model used in this paper to construct the facial regions, which are mainly around eyes, eyebrows, nose, and mouth. The regions can be divided into triangular mesh by Delaunay triangulation division according to the landmarks.
The texture model is built by piecewise affine warp to project the original images into the mean shape based on the triangular mesh. The implementation of piecewise affine warp is illustrated as Fig. 4.
Given the pixel x=
( )
x,y T in the triangle, which includes three vertices( )
xi0,yi0T,(
x0j,y0j)
T, and(
xk0,yk0)
T. According to the piecewise affine warp,x
can be calculated by:( )
(
)
(
) (
)
⎥⎦⎤⎢⎣
⎡ −
+ =
= , T 0, 0 T 0, 0 T 0, 0 T
i i j j i
i y x y x y
x y
x α
x (2)
(
) (
)
⎥⎦⎤ ⎢⎣⎡ −
+ 0, 0 T 0, 0 T
i i k
k y x y
x
β
where:
(
)(
) (
)(
)
(
0 0)(
0 0) (
0 0)(
0 0)
0 0 0 0 0 0 i k i j i k i j i k i i k i x x y y y y x x x x y y y y x x − − − − − − − − − − =
α (3)
and
(
)(
) (
)(
)
(
)(
) (
)(
)
0 0 0 0 0 0
0 0 0 0 0 0 0 0
i j i i j i
j i k i j i k i
y y
x
x
x x
y
y
x
x
y
y
y
y
x
x
β
=
−
−
− −
−
−
−
−
−
−
(4) So, the coordinate of pixels in the original image is recalculated by (2), (3), (4):
(
,)
T[
(
,)
T(
,)
T]
)
(x;p = xi yi +α xj yj − xi yi
W (5)
(
) (
)
[
, T , T]
i i k
k y x y
x −
+β
The shape and texture models of AAM are as follows, respectively:
∑
= + = m i i p 1 i 0 s ss (6)
∑
= + = l i i iA uu A u A
1
0( ) ( )
)
( λ (7)
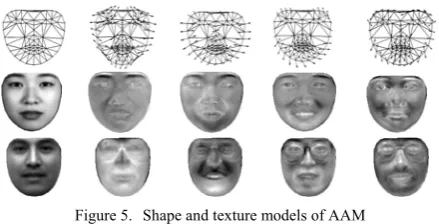
where s0 is the mean shape, A0 is the mean texture in the mean shaped patch, pi andλi are the parameters describing the main variations of the shape and texture modes siand Ai. The mean shape, texture of AAM and
their variations with larger variables pi and λi representing the most change are shown in Fig. 5.
After building AAM, facial regions are extracted based on FACS developed by Paul Ekman and Wallac V. Friesen [26], shown in Fig. 6. Some regions between eyes and nose are removed, which are unrelated to expression recognition. The whole face region is labeled as R = 1 shown in the odd columns, and the facial regions for R = 3 in the even columns,which are used in the experiment to describe the different recognition results in Fig. 6.
C. Gabor Wavelet Transformation
After facial regions extraction using AAM, the next step is facial feature extraction to produce feature vectors. Gabor wavelet transformation is applied to obtain facial expression information for recognition. Since Gabor responses own the property similar to the 2D receptive field profiles of the mammalian cortical simple cells in spatial locality and orientation selectivity [27], they have been applied for local feature representation within a pure computer vision context.
Gabor filter is a Fourier transformation enveloped by Gaussian function, and Gabor wavelet representation makes use of Gabor filter to be the basic wave to extract facial features in different scales and orientations in the face image [28]. The 2D Gabor wavelet transformation is described as follows:
⎥ ⎥ ⎦ ⎤ ⎢ ⎢ ⎣ ⎡ − =
Ψ − 2 −2
2 2 , , 2 , 2 2 2 , exp exp exp ) ( σ κ σ κ υ μ υ μ μυ υ μ σ
κ i z
z
z (8)
) , (x y
z is the location in the image coordinate, and
υ μ
κ , is defined as:
φμ
υ υ
μ κ
κ , = expi
υ
υ κ
κ = max/ f
8
π μ φμ =
Figure 5. Shape and texture models of AAM
Figure 6. Samples of different facial region extraction α
β
α
β
0 0 T
( , )x yi i
0 0 T
( , )x yj j
0 0 T
( , )x yk k T
( , )x y
T
( , )x yj j
T
( , )x yk k T
( , )x yi i
W(x;p)
W(x;p)
As shown,κυ,φμandσ are three main parameters in (8), which describe the wavelength, orientation and the size of Gabor function, respectively. μandυrepresent the scale and orientation of Gabor filter, respectively. And feature representations of different Gabor filters are obtained by changing the three parameters. The more Gabor filters with orientations and scales are used, the more facial information is obtained, butthe computation amount is expanded in consequence.
Given an image I(z), the image transformed after Gabor filters by the convolution is:
υ μ υ
μ, =I(z)∗Ψ ,
G (9)
In (8), parametersσ =2π ,κmax =π 2, and f = 2 are applied, and scale υ is chosen from 0 to 4, and orientationμfrom 0 to 7. So, a feature vector is formed based on facial regions image by forty filters after concatenating each convolution image.
The forty Gabor filters consist of Gabor bank. Then Gabor filters, the number of which is below forty, are called partial Gabor filters in our work. The amplitude of sample images after feature extraction with scale 2 of orientation 1 and 4 are shown in Fig. 7. It is shown that Gabor filters extract eyes, nose and mouth features on the face which contain the main facial expression information.
D. Facial Expression Recognition Based on SVMs SVMs, as a linear model for classification proposed by Vapnik et al based on the statistical theory [29], can be used for classification as a popular machine learning method. It is applied to the fields of classification, regression and objection detection for its simplicity, effectiveness and reliability [30]. Then SVMs is used to recognize facial expression for its advantages that it can solve the problems of small amounts of sample sets learning and overfitting in a better way proved by a large number of researchers after extensive studies.
In the two-class of linear classification, given the training sample set
{
x1,",xn}
∈Rd×1 belongs to twoclasses, indicated by 1 and -1. Then, the data set is written as:
{
(
x1,y1) (
,", xn,yn)
}
. Here is: yi∈{ }
1,−1. Thus, the discriminant function is expressed as:) (
)
(x y w x b
f = ⋅ + (10) The classified plane equation is:
0 = + ⋅x b
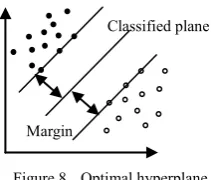
w (11) The goal of SVMs is to seek the optimal decision boundary, which maximizes the distance between the
boundary and the nearest data among the two sets. The distance is called margin shown in Fig. 8. The closest points distributed on the both sides of the classified plane are support vectors.
The vertical distance between a sample and the classified plane is computed by w⋅x+b w . The normalized (11) and the optimal classified plane equation are described as follows:
[
]
⎪⎭ ⎪ ⎬ ⎫ ⎪⎩ ⎪ ⎨ ⎧ + ⋅x b w w b w, min 1argmax (12)
The maximal value is obtained from (12) by computing the minimal value w 2. In order to solve the optimal value conveniently, the optimal problem subjected to the correct classified condition is described as follows after introducing Lagrange multiplier:
[
]
{
}
∑
= − + ⋅ − = n i ii y w x b
w b w Q 1 2 1 ) ( 2 1 ) , ,
( α α (13)
and the condition is:
[
(w⋅x)+b]
−1≥0yi (14) In the case of overlapping class distribution, (13) cannot separate samples correctly. Therefore, the slack variables,ξn ≥0
(
n=1,",N)
, are introduced. Then, the optimal boundary problem is defined as:∑
= + = n i i C w w 1 2 2 1 ) ,P( ξ ξ (15)
it is under the constraint:
( )
[
i]
ii w x b
y ( ⋅ϕ )+ −1≥1−ξ (16)
In nonlinear separable space, the data can be mapped into linear space by the kernel function to perform linear classification as above shown in Fig. 9. There are three kinds of kernel functions widely used in SVMs, including polynomial kernel, Gaussian kernel, and sigmoid kernel. In our work, Gaussian kernel is used. The kernel function is expressed as:
Figure 7. The images of amplitude part
0 0 0 0 0 X X X X X Φ(0)
Φ(0)Φ(0)
Φ(0) Φ(0) Φ(X) Φ(X) Φ(X) Φ(X) Φ(X)
X F
Figure 9. Hyperplane in high dimensional space Classified plane
Margin
( )
2 ,y e x y xK = −γ − (17) Thus, the regulations of ξiandγ determine support vectors and classified hyperplane to control classification results. The method of “one against one” is applied to classify multiple expressions by SVMs. As in the case of K-classes,
1 2 (
K K
−
1)
classifiers are needed to be learned. In each input feature vector, the recognition result is obtained by votes from each classifier, and the most voting class is considered as the final prediction.III. EXPERIMENT ON THE METHOD
A. The database Description
The JAFFE and Yale database are used to evaluate and validate the method. The first database, proposed by Japan Advanced Telecommunication Research Institute International, contains 213 facial expression images, which correspond to ten female Japanese, and each person posed seven predefined facial expressions. There are anger, disgust, fear, happiness, neutral, sadness and surprise. AN, DI, FE, HA, NE, SA and SU are used to represent these expressions in the confusion matrices of classification. Each expression of one person has 2 to 4 images. Several experiments to evaluate our method are performed in the following part. Ten-fold cross validation, different group test, and independent subject experiments on JAFFE are carried out for facial features of Gabor bank and partial Gabor filters, respectively. The Yale database contains 165 images of 15 individuals with 60 facial expression images, and each person providing four images with expressions of normal, happiness, sadness and surprise. Since the number of images in Yale database is relatively less, only the independent subject experiment with Gabor bank is performed to evaluate the method, and the average rate is reported.
B. Ten-fold Cross Validation
The data set are partitioned randomly into ten groups, each of which is roughly equal to the number of each subject. Nine groups are used to train SVMs classifiers, while the remaining one is used to test. Each group is used as a testing group in turn. Ten-fold cross validation is done, and the average rate and their confusion matrices of classification are represented. Meanwhile, rates of other methods for facial expression recognition and the proposed method are shown in Tab. 1. The later is better than other methods from the experiment results.
Tab. 2 and Tab. 3 show confusion matrices of classification for R = {1, 3}. Expressions of anger and surprise can be recognized better for R = 3 than R = 1. But for R = 1, happiness is recognized preferably. Neutral and sadness are recognized in the lowest rate for R = {1, 3}. Sadness for R = 1 is apt to be confused with other expressions in varying degrees except surprise.
C. Different Group Test
In this part, four subsets with different number of testing samples are randomly selected from JAFFE database. Each subset is composed of ten groups, and the number of each group is 15, 20, 25 and 30 samples. The rest of samples outside the test group are applied to train. It is called the group test here. The results of features with Gabor bank and partial Gabor filters are shown.
The group recognition rates with Gabor bank used to extract facial features for R = {1, 3} are shown in Tab. 4. The best result is on the first subset with 15 samples for R = 3. The worst result is on the third subset with 25 samples. The highest and lowest rates are 100% and 80% respectively, which appeared on some testing groups of 15 and 20 samples for R = {1, 3}. From the outcomes, the proposed method performs better by contrast with R = 1.
Confusion matrices of recognition rate for R = {1, 3} are summarized in Tab. 5 and Tab. 6. The highest and lowest rates are 96.2% for anger and 82.2% for happiness in R=1, and 99.3% for surprise and 81.5% for happiness in R=3. The error rate of happiness being recognized as neutral is highand almost all expressions are recognized as sadness except surprise. Usually, happiness is represented as eyebrows slightly bent downward, and angulus oris pulled upward as sometimes showing teeth. The smaller amplitude of movements on face feature, the more difficulties of expression recognition there are. Therefore, some images of happiness are extremely similar to neutral. Sadness is described as inner corners of eyes and eyebrows upward with the later wrinkling
TABLE I.
FACIAL EXPRESSION RECOGNITION RATE (%) Method Ten-fold cross validation
LBP[31] 80.7±0.5
LDiP[32] 85.9±1.8
Gabor[33] 79.7±4.2
LDNG[34] 88.7±0.2
R=1 87.3±1.2
R=3 89.7±0.5
TABLE III.
CONFUSION MATRIX OF CLASSIFICATION FOR R=3(%)
R=3 AN DI FE HA NE SA SU
AN 96.15 3.7 0.0 0.0 2.78 8.82 0.0
DI 0.0 96.3 6.06 0.0 0.0 2.94 0.0
FE 0.0 0.0 93.94 0.0 0.0 2.94 0.0
HA 0.0 0.0 0.0 89.7 13.89 0.0 0.0
NE 0.0 0.0 0.0 0.0 77.78 5.88 0.0
SA 3.85 0.0 0.0 3.45 5.56 79.41 0.0
SU 0.0 0.0 0.0 6.9 0.0 0.0 100
TABLE II.
CONFUSION MATRIX OF CLASSIFICATION FOR R=1(%)
R=1 AN DI FE HA NE SA SU
AN 87.5 0.0 0.0 0.0 2.78 3.23 0.0
DI 6.25 96.15 3.03 0.0 0.0 3.23 0.0
FE 0.0 3.85 87.88 0.0 0.0 3.23 3.57
HA 0.0 0.0 0.0 92.59 11.1 6.45 0.0
NE 0.0 0.0 0.0 0.0 77.78 6.45 0.0
SA 6.25 0.0 6.06 3.7 5.56 77.42 0.0
together, and corners of the mouth pulled downward accompanying trembling sometimes.
There are subtle distinctions between sadness and other expressions, such as disgust, neutral, and happiness. It is hardly to be recognized by human beings from human vision. So it is quite difficult to be classified for machine learning. Expressions of anger, fear and happiness are better distinguished for R = 1 than R = 3, while the rest of four expressions are recognized more effectively for R = 3. The reason is that the AUs with relation to these expressions areconcentrated on lower eyelids and regions among two eyebrows, some information of which is removed when extracting facial regionsfor R = 3.
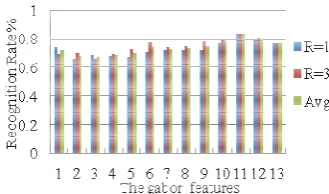
Average recognition rates of all subset for R = {1, 3} with different partial Gabor features and their average rate are shown in Fig. 10. These partial features are
obtained by Gabor filters with one scale with eight orientations and one orientation with five scales. Horizontal coordinate represents the type of Gabor filters used to extract facial feature. From 1 to 8, they describe Gabor features as five scales with one orientation from 0 to 7. The rest of ordinate values describe features as eight orientations with one scale from 0 to 4.
From the overall results of group test, it can be seen that the rate for R = 3 is higher than for R = 1, which is obvious to correspond with the previous part of this part. Orientation 5 and scale 2 have more impact on expression recognition comparedwith the rest of Gabor features. D. Independent Subject Test
In this part, the experiment of independent subject is performed, which uses one subject to test and the rest of subjects to train. The names of ten subjects of JAFFE database are KA, KL, KM, KR, MK, NA, MN, TM, UY, YM, which are represented by the numbers 1 to 10 with the number of 23, 22, 22, 20, 21, 21, 20, 21, 21 and 22, respectively. The number of each subject from Yale database is four, which contains 15 subjects with four expressions, glasses and mustache.
Expression recognition rates based on Gabor bank and texture for R = {1, 3} are shown in Fig. 11, where GR = {1. 3} represents facial expression recognition using Gabor bank, and TR = {1, 3} is texture features for R = {1, 3} respectively. The best result comes from subject 3 with GR = 3, while the worst one appears on subject 7 for GR = 1. There is little change on subject 7 around mouth, eyes and eyebrows, which shows expression by changing their position and texture in the face. Subtle expression is more difficult to be classified not only by human in the real world but also for pattern classifiers. It is obtained that the recognition rate for GR=3 outperforms 1 except subject 9. The recognition rate using texture features for TR = 1 is higher than 3 except subject 1 and 2. The recognition accuracy on subject 2 for TR = 3 is the highest among texture features. So, feature extraction is a pivotal part in the process of facial expression recognition.
Confusion matrices of classification for R = {1, 3} are shown in Tab. 7 and Tab. 8. The means of AN, DI, FE, HA, NE, SA and SU are same with the above part. The recognition effect of anger and happiness is robust for the same rate of different facial regions. Anger is recognized as three other expressions, containing neutral, sadness and disgust for R = 1, but including the three expressions in addition to fear for R = 3. Happiness are recognized as expressions of fear, sadness, surprise and neutral for R =
TABLE VI.
CONFUSION MATRIX OF CLASSIFICATION FOR R=3(%)
R=3 AN DI FE HA NE SA SU
AN 93.85 4.24 0 0 0 5.69 0
DI 3.85 89.84 1.53 0 0 1.63 0
FE 0 1.69 90.84 0 0 0.81 0
HA 0 0.85 0 81.02 0 0.81 0.69
NE 2.31 0 0.76 13.14 95.58 6.50 0.69
SA 0 3.39 3.82 5.84 3.54 84.55 0
SU 0 0 3.05 0 0.88 0 98.65
TABLE V.
CONFUSION MATRIX OF CLASSIFICATION FOR R=1(%)
R=1 AN DI FE HA NE SA SU
AN 96.15 3.39 0 0 0 4.07 0
DI 0.77 88.14 0.76 0 0 1.63 0
FE 0 1.69 93.13 0.73 0 1.63 3.38
HA 0 0 0 81.75 0 0 0.68
NE 3.08 0 0 12.41 92.04 10.57 2.03
SA 0 6.78 1.53 5.11 7.08 82.11 0
SU 0 0 4.58 0 0.88 0 93.92
TABLE IV.
FACIAL EXPRESSION RECOGNITION RATE (%)
Group
The number of testing samples
15 20 25 30
R=1 R=3 R=1 R=3 R=1 R=3 R=1 R=3
1 86.67 100 90.0 95.0 88.0 88.0 90.0 93.33
2 86.67 93.33 95.0 95.0 84.0 88.0 90.0 93.33
3 86.67 93.33 100 95.0 88.0 96.0 83.33 90.0
4 93.33 100 100 95.0 80.0 84.0 96.67 93.33
5 100 100 95.5 90.0 92.0 88.0 96.67 90.0
6 86.67 86.67 90.0 100 88.0 88.0 93.33 90.0
7 86.67 86.67 85.0 90.0 88.0 88.0 96.67 93.33
8 80.0 93.33 85.0 85.0 84.0 80.0 83.33 93.33
9 93.33 93.33 95.0 90.0 92.0 80.0 86.67 86.67
10 100 100 80.0 100 80.0 84.0 93.33 93.33
Average 90.0 94.66 91.55 93.5 86.4 86.4 91.0 91.67
1, but it onlypredicts neutral and surprise for R = 3. The rest of expression recognition rate for R = 3 is higher than R = 1 with the differencefrom 6.2% for fear to 16.7% for surprise. It indicates that the method proposed here is more effective for independent subject experiment from independent subject test.
The recognition rates of partial Gabor filters are shown in Fig. 12 and Fig. 13 for R = {1, 3}. The mean of horizontal coordinate is the same with the above part. The results show that some of partial Gabor filters perform better than Gabor bank, like on subject 1 in orientation 0 and subject 5 in scale 2 for R = 3. Partial Gabor filters with scale 1 and orientation 7 for R = 1 and scale 0 and orientation 4 for R = 3 have more discriminating information in the light of experiment results than other Gabor filters, which raise useless recognition features.
Independent subject experiment on Yale database is carried out with features of Gabor bank, and the average rate is reported for the small number of samples in this data set. In Tab. 9 and Tab. 10, recognition rates and confusion matrices for R = {1, 3} are shown. In this experiment, the average rate of facial expression recognition for R = 1 is higher than R = 3 with 1.66%. Based on the results, it is noted that the accuracy for expression normal for R = 1 is better than R = 3, while the remaining ones are the same with different error rate. For R = 1, happiness and surprise are only recognized as sadness and normal, respectively. But they are recognized as surprise and sadness severally for R = 3. The highest error rate of normal is 26.67% for R = 3 as expression sadness, and the one of sadness is 40.0% for R = 1 as normal. As the experiment on JAFFE data set, sadness is more difficult to recognize compared with the remaining expressions for the subjects expressing sadness.
Figure 11. Facial expression recognition rates for each subject
TABLE IX.
RECOGNITION RATE AND CONFUSION MATRIX OF
CLASSIFICATION FOR R=1(%)
R = 1 Average rate 78.33
Confusion Matrix of Classification
R = 1 Happiness Normal Sadness Surprise
Happiness 93.33 6.67 6.67 0
Normal 0 73.33 40.0 6.67
Sadness 6.67 20.0 53.33 0
Surprise 0 0 0 93.33
Figure 13.Recognition rate with partial Gabor filters for R = 3 Figure 12.Recognition rate with partial Gabor filters for R = 1
TABLE VIII.
CONFUSION MATRIX OF CLASSIFICATION FOR R=3(%)
R=3 AN DI FE HA NE SA SU
AN 63.33 13.79 0.0 0.0 6.67 9.68 0.0
DI 10.0 51.72 9.38 0.0 0.0 16.13 0.0
FE 3.33 10.34 50.0 0.0 6.67 3.23 6.67
HA 0.0 0.0 0.0 77.42 0.0 3.23 6.67
NE 10.0 0.0 15.63 16.13 80.0 9.67 6.67
SA 13.33 24.14 15.63 0.0 6.67 54.84 0.0
SU 0.0 0.0 9.38 6.45 0.0 3.23 80.0
TABLE VII.
CONFUSION MATRIX OF CLASSIFICATION FOR R=1(%)
R=1 AN DI FE HA NE SA SU
AN 63.33 17.24 6.25 0.0 10.0 16.13 0.0
DI 3.33 41.38 18.75 0.0 0 19.35 0.0
FE 0.0 17.24 43.75 3.23 3.33 9.67 16.67
HA 0.0 0.0 0.0 77.42 3.33 3.23 3.33
NE 20.0 0.0 9.38 9.68 70.0 3.23 13.33
SA 13.33 24.14 9.38 3.23 6.67 41.94 3.33
E. Results and Analysis
From all the experiment results, it is shown that the proposed method is effective and available. By comparison the methods of face feature for R= {1, 3}, its computation amount and accuracy are preferential. Overall, the recognition rates of surprise and neutral are much higher. Based on FACS, various AUs combinations raise countless expressions by moving mimetic muscles under the corresponding skin covering the face. Hence, different extractions of facial regions composed of AUs cause different recognition effects.
It illustrates that some features on the basis of test results for partial Gabor filters become noise to disturb facial expression recognition. Importantly, it is to extract effective features and reduce the noise for diverse representation features by selecting features of stronger recognition ability. Facial features are characterized by countless scales and orientations, which are selected by human visual system to understand information conveyed by expressions from different expressers. But Gabor features are only used to describe them in a certain number of scales and orientations for consideration of computation amount and time. Therefore, some subtle facial changes are hardly to be sensed in real-life situation from machine learning. Since some expressions are produced by associated motion of eyes, eyebrows or other parts in the face, directions and amplitudes of their motions are unpredictable.
IV. CONCLUSIONS
In this paper, a novel method of automatic facial expression recognition is proposed using SVMs with Gabor wavelet transformation based on AAM according to FACS. The goal of this approach is to recognize expression effectively and conveniently on effective expression regions to maximum extent by extracting facial regions from the whole image. In addition, facial regions are extracted and normalized to reduce influences of face pose, illumination and different size of face regions by AAM. It is helpful to extract features of key facial parts using Gabor filters for its property of much greater simalarity to human visual system. Finally, SVMs is applied to obtain highly-efficient performance with small sample datasets.
To evaluate and validate this approach, a amount of experiements are done on JAFFE and Yale datasets. Rates and confusion matrices for classification are shown. The rate as high as 100% is obtained using this method. Expressions of happiness and surprise are recognized
commendably. The experimetal results indicate that it is more effective and reasonable than the whole face region and other methods for expression recognition. The accuracy and effect are acceptable and satisfied, and it can be applied to human-computer interaction or other aeras of artificial intelligence.
Through deep studies on this method, its feasibilityand high performance have been verified and many meaningful factors are foundto make recognition effect better. Firstly, it is critical to extract facial expression information by means of Gabor filters with much better discrimant function and enhance its ability to descibe features on the primary regions producing facial expression. Secondly, other methods of expression features extraction for similar and subtle expressions is needed to combine Gabor features in order to boost distinguishable performance. The last one is to extract AUs of expression production presicely from shape and texture for acquiring more accurate expression information and acknowledges.
ACKNOWLEDGMENT
This work was supported by grant (No. 61273339) from the National Natural Science Foundation of China.
REFERENCES
[1] A. B. Ashraf, S. Lucey, J. F. Cohn, “The painful face – Pain expression recognition using active appearance models,” in image and computer vision, vol. 27, pp. 1788-1796, 2009, doi: 10.1016/j.imavis.2009.05.007.
[2] M. Pantic, J. M. Leon, “Automatic Analysis of Facial Expressions: The State of the Art,” IEEE Trans. On Pattern Analysis and Machine Intelligence, vol. 22, pp. 1424-1445, 2000, doi: 10.1109/34.895976 .
[3] B. Fasel, J. Luettin, “Automatic facial expression analysis: a survey”, in Pattern Recognition, vol. 36, pp. 259-275, 2003, doi: 10.1016/S0031-3203(02)00052-3.
[4] B. Abboud, F. Davoine, M. Dang, “Facial Expression recognition and synthesis on an appearance model,” in Signal Processing: Image Communication, vol. 19, pp. 723-740, 2004, doi: 10.1016/j.image.2004.05.009.
[5] I. A. Essa, A. P. Pentland, “Coding, Analysis, Interpretation, and Recognition of Facial Expression,” IEEE Trans. On Pattern Analysis and Machine Intelligence, vol. 19, pp. 757-763, 1997, doi: 10.1109/34.598232. [6] R. Samad, H. Sawada, “Extraction of the minimum number
of Gabor wavelet parameter for the recognition of natural facial expression,” Artif Life Robotics, vol. 16, pp. 21-31, 2011.
[7] I. Kotsia, I. Pitas, “Facial Expression Recognition in Image Sequences Using Geometric Deformation Features and Support Vector Machines,” IEEE Trans. On IMAGE PROCESSING, vol. 16, pp. 172-187, 2007, doi: 10.1109/ TIP.2006.884954.
[8] M. J. Lyons, J. Budynek, S. Akamatsu, “Automatic Classification of Single Facial Image,” .IEEE Trans. On Pattern Analysis and Machine Intelligence, vol. 21, pp. 1357-1362, 1999, doi: 10.1109/34.817413.
[9] Y. Ji, K. Idrissi, “Automatic facial expression recognition based on spatiotemporal descriptors,” Pattern Recognition Letter, vol. 33, pp. 1373-1380, 2012, doi: 10.1016/j.patrec. 2012.03.006.
TABLE X.
RECOGNITION RATE AND CONFUSION MATRIX OF
CLASSIFICATION FOR R=3(%)
R = 3 Average rate 76.67
Confusion Matrix of Classification
R = 3 Happiness Normal Sadness Surprise
Happiness 93.33 0 13.33 0
Normal 0 66.67 33.33 0
Sadness 0 26.67 53.33 6.67
[10]I. Mahdi, S. Hamed, “A novel fuzzy facial expression recognition system based on facial feature extraction from color face images,” Engineering Applications of Artificial Intelligence, vol. 25, pp. 130-146, 2012, doi: 10.1016/ j.engappai.2011.07.004.
[11]Y. Cheon, D. Kim, “Natural facial expression recognition using differential-AAM and manifold learning,” Pattern Recognition, vol. 42, pp. 1340-1350, 2009, doi: 10.1016/ j.patcog.2008.10.010.
[12]R. Xiao, Q. Zhao, D. Zhang, P. Shi, “Facial expression recognition on multiple manifolds,” Pattern Recognition, vol. 44, pp. 107-116, 2011, doi: 10.1016/j.patcog.2010. 07. 017.
[13]I. Buciu, C. Kotropoulos, I. Pitas, “Comparison of ICA approaches for facial expression recognition,” Signal Image and Video Processing, vol. 3, pp. 245-361, 2009, doi: 10.1007/s11760-008-0074-3.
[14]F. Long, T. Wu, J. R. Movellan, M. S. Bartlett, G. Littlewort, “Learning spatiotemporal features by using independent component analysis with application to facial expression recognition,” Neurocomputing, vol. 93, pp. 126-132, 2012, doi: 10.1016/j.neucom.2012.04.017. [15]L. S. Oliveira, M. Mansanom, A. de S. Britto Jr and A. L.
Koerich, “2D Principal Component Analysis for Face and Facial-Expression Recognition”, Computing in Science & Engineering, vol. 13, pp. 9-13, 2011.
[16]S. M. Lajevardi, Z. M. Hussain, “Automatic facial expression recognition: feature extraction and selection”, Signal Image and Video Processing, vol. 6, pp. 159-169, 2012, doi: 10.1007/s11760-010-0177-5.
[17]T. H. H. Zavaschi, A. S. Britto Jr. L. E.S. Oliveira, A. L. Koerich, “Fusion of feature sets and classifiers for facial expression recognition,” Expert Systems with Applications, vol. 40, pp. 646-655, 2013, doi: 10.1016/j.eswa.2012. 07. 074.
[18]A. B. Ashraf, S. Lucey, T. Chen, “Reinterpreting the Application of Gabors Filters as a Manipulation of the Margin in Linear Support Vector Machines,” IEEE Trans. On Pattern Analysis and Machine Intelligence, vol. 32, pp. 1335-1341, 2010, doi: 10.1109/TPAMI.2010.75.
[19]T. Kanade, J. F. Cohn, Y. Tian, “Comprehensive Databae for Facial Expression Analysis,” in Proceedings of 4th
IEEE International Conference on Automatic Face and Gesture Recognition, pp. 46-53, 2000, doi: 10.1109/AFGR. 2000.840611.
[20]K. Ramnath, S. Koterba, and J. Xiao, “Multi-View AAM Fitting and Construction,” International Journal Computer Vision, vol. 76, pp. 183-204, 2008, doi: 10.1007/s11263-007-0050-3.
[21]G.J Edwards, A. Lantis, C.J. Taylor and T.F. Cootes, “Statistical models of face images-improving specificity,” Image and Vision Computing, vol. 16, pp. 203-211, 1998, doi: 10.1016/S0262-8856(97)00069-3.
[22]S. Baker, and I. Matthews, “Lucas-Kanade 20 Years on: A Unifying Framwork,” International Journal Computer Vision, vol. 56, pp. 221-255, 2004, doi: 10.1023/B: VISI. 0000011205.11775.fd.
[23]G. J. Edwards, C. J. Taylor, and T.F. Cootes, “Interpreting face images using active appearance models,” Proceedings of 3th IEEE International Conference on Automatic Face and Gesture Recognition, pp. 300-305, 1998, doi: 10.1109 /AFGR.1998.670965.
[24]R. Lienhart, J. Maydt, “An extended set of Haar-like features for rapid object detection,” Proceedings of the 2002 International Conference on Image Processing, vol. 1, pp. 900-903, 2002, doi: 10.1109/ICIP.2002.1038171.
[25]I. Matthews, S. Baker, “Active Appearance Models Revisited,” International Journal of Computer Vision, vol. 60, pp. 135-164, 2004, doi: 10.1023/B:VISI.0000029666. 37597.d3.
[26] G. Donato, M. S. Bartlett, J. C. Hager, P. Ekman, T. J. Sejnowski, “Classifying Facial Actions,” IEEE Trans. On Pattern Analysis and Machine Intelligence, 21(10), pp. 974-989, 1999, doi: 10.1109/34.799905.
[27]W. Gu, C. Xiang, Y.V. Venkatesh, Dong Huang and Hai Lin, “Facial expression recognition using radial encoding of local Gabor features and classifier synthesis,” Journal of Pattern Recognition, vol. 45, pp. 80-91, 2012, doi: 10. 1016/j.patcog.2011.05.006.
[28]C. Liu, “Gabor-Based Kernel PCA with Fractional Power Polynomial Models for Face Recognition,” IEEE Trans. On Pattern Analysis and Machine Intelligence, vol. 26, pp. 572-581, pp.572-581, 2004, doi: 10.1109/TPAMI. 2004. 1273927.
[29]N. Cristianini, J. Shawe-Taylor, (2000). An Introduction to Support Vector Machines and Other Kernel-Based Learning Methods. UK: Cambridge University.
[30]C. M. Bishop (2006), Pattern Recognition and Machine Learning. New York: Springer-Verlag, pp. 325-356. [31]C. Shan, S. Gong, and P. W. McOwan, “Facial expression
recognition based on local binary patterns: A comprehensive study,” Image Vis. Comput., vol. 27, pp. 803–816, 2009, doi: 10.1016/j.imavis.2008.08.005. [32]T. Jabid, M. H. Kabir, and O. Chae, “Local directional
pattern (LDP) for face recognition,” in Proc. IEEE Int. Conf. Consum. Electron., Mar., pp. 329–330, 2010, doi: 10.1109/ICCE.2010.5418801.
[33]M. S. Bartlett, G. Littlewort, I. Fasel, and J. R. Movellan, “Real time face detection and facial expression recognition: Development and applications to human computer interaction.” in Proc. Conf. Comput. Vis. Pattern Recognit. Workshop, vol. 5. p. 53, Jun. 2003, doi: 10.1109/CVPRW. 2003.10057.
[34]A. R. Rivera, J. R. Castillo, and O. Chae. “Local Directional Number Pattern for Face Analysis: Face and Expression Recognition,” IEEE Trans. On Image Processing, vol.22, pp. 1740-1752, 2013, doi: 10.1109/TIP. 2012.2235848.
Li Wang was born in 1982. She received the Bachelor’s degree in Mechanical engineering and automation in 2005, from Hebei University of Engineering, Handan, China. She received the Master’s degree in Mechanical Design and Theory in 2009, from Shijiazhuang Tiedao University, Shijiazhuang, China.
She is a Ph.D student College of mechanical and electrical engineering of Harbin Institute of Technology. Her main research interest include pattern recognition, image processing and computer vision.
Ruifeng Li was born in Shanxi, China, in 1965. He obtained the degree of Bachelor, Master and Doctor of Engineering 1988, 1991, 1997, from School of Mechatronics Engineering of Harbin Institute of Technology, respectively.
Ke Wang was born in 1979. He obtained Bachelor’s in department of Automation in 2002, and Doctor’s degree in control theory and control engineering in 2008, from Dalian University of Technology, respectively.