www.pharmascholars.com 29
Research Article
METHOD DEVELOPMENT AND VALIDATION FOR ESTIMATION OF
NEVIRAPINE FROM TABLETS BY RP-HPLC
Rohini P
*1, Madhusudhanareddy I
2, Gupta A
3, Lokeswara babu V
3and Sudharani G
3 1Department of Pharmaceutics, Nagarjuna University, Guntur, India
2Department of Pharmaceutical Chemistry, Malla Reddy College of Pharmacy, Secunderabad,
India
3
Department of pharmaceutical Sciences, Joginpally B.R College of pharmacy, Hyderabad,
Andhra Pradesh, India
*Corresponding author e-mail:
[email protected]
ABSTRACT
A reverse phase high performance liquid chromatography method has been developed for the estimation of nevirapine in tablets. The quantification was carried out on the symmetry C18 column, with a mobile phase consisting of acetonitrile and phosphate buffer in the ratio of 65:35 v/v. The mobile phase pumped at a rate of 0.8 mL/min and the detection was carried out at 283 nm. The linearity was found to be in the range of 20-60 µg/mL. The limit of detection and limit of quantitation was found to be 0.027µg/mL and 0.09µg/mL, respectively. The percentage recovery values were found to be in the range of 99.83-100.73%. Statistical analysis proves that the method was found to be simple, precise, accurate and reproducible, and can be used for the routine quality control of nevirapine in formulations.
Keywords: Nevirapine, tablets and HPLC
INTRODUCTION
Nevirapine, chemically 11-cyclopropyl-4-methyl-5, 11-dihydro-6H-dipyrido [3, 2-b: 2’, 3’-e] [1, 4] diazepin-6-one (Figure 1) is a non-nucleoside reverse transcriptase inhibitor (NNRTI) with activity against human immunodeficiency virus type 1 (HIV-1) that is already marketed for the treatment of HIV-1 infected adults. Nevirapine is recommended for treating HIV infections in combination with other reverse transcriptase inhibitors such as stavudine and lamivudine1, 2.
A literature survey revealed that the few analytical methods available for estimation of nevirapine from pharmaceutical formulations3-8 and from human plasma9-11. The reported method for the estimation of nevirapine from pharmaceutical formulations includes HPLC3-6, Spectrophotometry7 and thin layer
chromatography8 method of analysis. The earlier reported methods were less sensitive and time consuming. Hence, the objective was to develop a new, simple, economical, selective, accurate and precise reverse phase high-performance liquid chromatographic method with good sensitivity for assay of nevirapine in tablet dosage form.
N N
N H
N O CH3
Fig. 1: Structure of Nevirapine
International Journal of Pharmacy
www.pharmascholars.com 30
EXPERIMENTAL
Materials
Nevirapine (NAV) generous gift samples from Cipla Ltd. (Mumbai, India). A commercial NEVIMUNE (Cipla) and NEVIPAN (Crosland’s) tablets containing 200 mg of NAV were purchased from a local market and used within their shelf-life period. The HPLC grade acetonitrile, methanol and water were purchased from Rankem (New Delhi, India). All other chemicals used were of pharmaceutical or analytical grade from Rankem (New Delhi, India).
Instrumentation
A Waters HPLC system consisting of a Water 2695 binary gradient pump, an inbuilt auto sampler, a column oven and Water 2487 dual wavelength absorbance detector (DAD) was employed throughout the analysis. The data were acquired using the Empower-2 software. The column used was XTerra symmetry C18 (150×4.6 mm, 5μm). A Bandline sonerex sonicator was used for enhancing the dissolution of the compounds. A Digisum DI 707 digital pH meter used for pH adjustment.
Optimized chromatographic conditions
The chromatography elution was carried out in the isocratic mode using a mobile phase consisting of acetonitrile and phosphate buffer (pH 3.0, pH adjusted with ortho phosphoric acid) in a ratio of 65:35 v/v. The analysis performed at ambient temperature using a flow rate of 0.8 mL/min with a run time of 5 min. The eluent was monitored using DAD at a wavelength of 283 nm. The mobile phase was filtered through whatmann filter paper No.41 prior to use.
Preparation of stock and standard solutions
A stock solution of NAV (1000 μg/mL) was prepared by taking accurately weighed 100 mg of NAV reference standard in 100 mL volumetric flask containing 50 mL deionized water and then the volume was made up to the mark with deionized water. The stock solution is protected from light using aluminum foil. Aliquots of the standard stock solution of NAV were transferred using A-grade bulb pipette into 100 mL volumetric flasks and solutions were made up to the mark with the mobile phase to give the final concentrations of 20-60 μg/mL.
Estimation of nevirapine from tablets
To determine the content of NAV in tablets (label claim: 200 mg), 20 tablets were taken and the contents were weighed and mixed. An aliquot of powder equivalent to the weight of one tablet was accurately weighed and transferred to 50 mL
volumetric flask and was dissolved in 25 mL of deionized water and volume was made up to the mark with deionized water. The flask was sonicated for 25 min to affect complete dissolution. The solution filtered through a 0.45 μm micro filter. A suitable aliquot of the filtered solution was transferred into a 100 mL volumetric flask and made up to the volume with the mobile phase to yield the concentration of 50μg/mL. The experiments were performed six times under the optimized chromatographic conditions described above. The peak areas were measured at 283 nm and concentration in the sample was determined by comparing the area of sample with that of the standard.
Method validation
Linearity: By appropriate aliquots of the standard NAV solution with the mobile phase, five working solutions ranging between 20-60 µg/mL were prepared. Each experiment was performed in triplicate according to optimized chromatographic conditions. The peak areas of the chromatograms were plotted against the concentration of NAV to obtain the calibration curve.
Accuracy: Recovery studies by the standard addition method were performed with a view to justify the accuracy of the proposed method. Previously analyzed samples of NAV to which known amounts of standard NAV corresponding to 50, 100 and 150% of label claim were added. The accuracy expressed as the percentage of analyte recovered by the proposed method.
Precision: Precision was determined as repeatability and intermediate precision, in accordance with ICH guidelines. The intra-day and inter-day precision were determined by analyzing the samples of NAV at a concentration of 30, 40 and 50µg/mL. Determinations were performed with three replicates on the same day as well as on three consequent days.
Reproducibility: The reproducibility of the method was checked by determining precision on a same instrument, the analysis being performed by another person in the same laboratory. It was analyzing the samples of NAV at different concentration (30, 40, 50 µg/mL) were determined in triplicate and calculate the amount of drug present in the sample.
Limit of detection and the limit of quantification:
www.pharmascholars.com 31
Robustness: The robustness of the method was performed by deliberately changing the chromatographic conditions. The organic strength and pH of the mobile phase were varied by ±2% and 0.2 units, respectively.
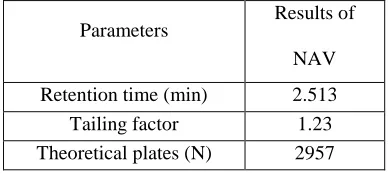
System suitability tests: To ensure the validity of the analytical procedure, a system suitability test was established. Data from ten injections of 20µL of the working standard solution containing 40 µg/mL were used for the evaluation of the system suitability parameters like tailing factor, the number of theoretical plates and retention time.
RESULTS AND DISCUSSIONS
A RP-HPLC was proposed as a suitable method for the estimation of NAV in the tablet. The best chromatographic conditions were adequately selected. The selection of mobile phase and flow rate was made on the basis of peak shape, baseline drift, time required for analysis, economical and the mobile phase consisted of acetonitrile and phosphate buffer (pH 3.5, adjusted pH with ortho phosphoric acid) in the ratio of 65:35 v/v at a flow rate of 0.8 mL/min and analyzed at 283 nm. The retention time observed (2.510) allows a rapid determination of the drug. In Figure 2, a typical chromatogram obtained under these conditions is shown.
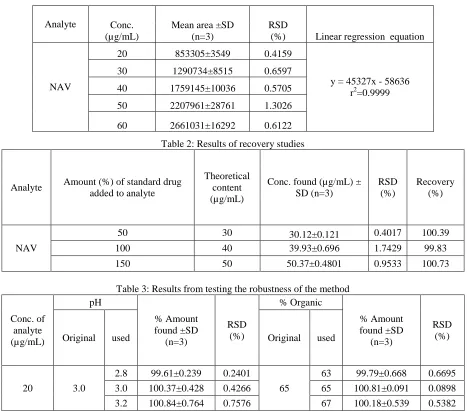
The calibration plot of peak area against concentration was linear in the range of 20-60 µg/mL. Calibration data, with their % relative standard deviation (%RSD) and linear regression equation are listed in Table 1. The linear regression data for the calibration curve are indicative of a good linear relationship between peak area and concentration over a wide range. The correlation coefficient was indicative of high significance. The LOD and LOQ were determined based on analytical responses on 3 and 10 times the background noise, respectively. The LOD and LOQ were found to be 0.027µg/mL and 0.09µg/mL, respectively.
The accuracy was assessed from three replicates containing a concentration of 30, 40 and 50µg/mL. The recovery of the method, determined by spiking a previously analyzed test solution with the addition of standard NAV solution, was found to be in the range of 99.83-100.73%. The values of % recovery and
%RSD are listed in Table 2, indicates that the method is accurate.
The precision of the method was measured in accordance with ICH guidelines. The low %RSD (<2) values indicate that the method is precise. Reproducibility of the method was performed in the same laboratory on a same instrument which was performed by another analyst. The assay values and low %RSD (<2) values indicate that the method is reproducible. The robustness was determined by analyzing the same sample under a variety of conditions. The factors consider to be: variations in the pH (0.2) and percentage of acetonitrile (±2%). The results and the experimental range of the selected variables were given in Table 3, together with the optimized conditions. There were no significant changes in the chromatography pattern when the above modifications were made in the experimental conditions, showing that the method is robust. The system suitability tests were also carried out to evaluate the reproducibility of the system for the analysis to be performed. The results of system suitability tests are given in Table 4, showing that the parameters are within the suitable range. The proposed method was applied to the analysis of marketed formulations and the results obtained are given in Table 5. The blank solution was prepared containing the components indicated in tablet dosage form except the active ingredient. No interference was observed from the tablet excipients. The NAV content was found to be 100.21% and 99.77% for NEVIMUNE and NEVIPAN, respectively. The low %RSD indicated the suitability of this method for routine analysis of NAV in pharmaceutical dosage forms, shown in Table 5.
CONCLUSION
The proposed RP-HPLC method is rapid, specific, accurate and precise for the quantification of NAV from its tablet dosage form. The method has been found to be better than previously reported methods, because of its wide range of linearity, use of readily available mobile phase, lack of extraction procedures and low tR. All these factors make this method
www.pharmascholars.com 32
Fig. 2: Typical chromatogram of nevirapine
Table 1: Linearity regression data for the calibration plot of nevirapine
Table 2: Results of recovery studies
Analyte Amount (%) of standard drug added to analyte
Theoretical content (µg/mL)
Conc. found (µg/mL) ± SD (n=3)
RSD (%)
Recovery (%)
NAV
50 30 30.12±0.121 0.4017 100.39 100 40 39.93±0.696 1.7429 99.83 150 50 50.37±0.4801 0.9533 100.73
Table 3: Results from testing the robustness of the method
Conc. of analyte (µg/mL)
pH
% Amount found ±SD
(n=3)
RSD (%)
% Organic
% Amount found ±SD
(n=3)
RSD (%) Original used Original used
20 3.0
2.8 99.61±0.239 0.2401
65
63 99.79±0.668 0.6695 3.0 100.37±0.428 0.4266 65 100.81±0.091 0.0898 3.2 100.84±0.764 0.7576 67 100.18±0.539 0.5382 Analyte Conc.
(µg/mL)
Mean area ±SD (n=3)
RSD
(%) Linear regression equation
NAV
20 853305±3549 0.4159
y = 45327x - 58636 r2=0.9999 30 1290734±8515 0.6597
www.pharmascholars.com 33
Table 4: Results of system suitability tests
Parameters Results of NAV Retention time (min) 2.513 Tailing factor 1.23 Theoretical plates (N) 2957
Table 5: Analysis of nevirapine in tablets Tablet
Formulation
Label Claim per Tablet (mg)
% Drug found ± SD (n=6)
RSD (%) NEVIMUNE 200 100.21±1.0398 1.0376
NEVIPAN 200 99.77±1.2653 1.2682
REFERENCE
1. Rey D. et al, Tolerance of a Short Course of Nevirapine, Associated with 2 Nucleoside Analogues, in Postexposure Prophylaxis of HIV. J. Acquir. Immune. Defic. Syndr., 2004; 37: 1454-6.
2. USP-NF, The Official Compendia of Standards, published by The United States Pharmacopoeia Convention, City Press, Baltimore, US, 2009, Vol III, pp 3072-3.
3. Mohanraj P, Deb Kumar S, Choudhury T and Gauthaman K. A Simple and Rapid RP-HPLC Method for the Estimation of Nevirapine in Bulk and Pharmaceutical Dosage Forms. E-J. Chem., 2008; 5 (S2): 1081-6. 4. Prasada Rao CH, Channabasavaraj KP, Lakshmi Aswini G. Development and validation of RP-HPLC
method for the estimation of nevirapine in bulk and tablets. J. Pharm. Sci., 2009: 1(2): 78-82.
5. Ananth Kumar D, Naveen Babu MV, Seshagiri Rao JVNL and Jayathirtha Rao V. Simultaneous determination of Lamivudine, Zidovudine and Evirapine in Tablet Dosage Forms by RP-HPLC Method. Rasayana J. Chem., 2010; 3 (1): 94-9.
6. Vaishali PN and Kishor PB. A validated UV spectrophotometric method for the simultaneous estimation of Lamivudine, Nevirapine and zidovudine in combined tablet dosage form. J. Pharm. Res., 2009; 2 (4): 666-9.
7. Venkatesh P and Rajesh Kumar R. Sepectrophotometric determination of nevirapine in pharmaceuticals after derivatization with 2,4-dinitro phenlyhydrazine. Asian J. Pharm. Health Sci., 2011; 1 (1): 33-4. 8. Purnima DH, Mitesh DP and Nitul S. Quantitative estimation of nevirapine by high performance thin layer
chromatography. J. Pharm. Res. Health Care. 2009; 1 (2): 197-216.
9. Venkata Kumar Ch, Ananth Kumar D and Seshagiri Rao JVNL. A new validated RP-HPLC method for the determination of nevirapine in human plasma. E-J. Chem., 2010; 7 (3): 821-6.
10. Pav JW, Rowland LS and Korpalski DJ. HPLC-UV method for the quantitation of nevirapine in biological matrices following solid phase extraction. J. Pharm. Biomed. Anal., 1999; 20 (1-2): 91-8.