Optimization of Doubling at Draw Frame for
Quality of Carded Ring Yarn
A.
Subrata Kumar Saha, B. Jamal Hossen
Lecturer, Department of Textile Engineering Ahsanullah University of Science and Technology 141-142, Love Road, Tejgaon I/A, Dhaka-1208, BangladeshAbstract-- Sliver has a huge impact on yarn quality parameter like evenness, imperfection index, Cvm%, U% of yarn. In general doubling means the increase in weight per unit length. Doubling is a process used in yarn manufacturing by which a single product is produced from a several intermediate feed product. The study was performed on 0.12 hank card sliver which was used to produce 24/1 Ne carded yarn. At first the number of doubling in the breaker and finisher drawing was 6, 7, and 8 respectively. The paper is to find out whether the change of number of doubling has any effect on yarn quality or to find out the suitable number of sliver doubling in passage 1 and passage 2.
Index Term-- Doubling, Draft, Hairiness, count, unevenness, imperfection index.
I. INTRODUCTION
In processing in the spinning mill, the unevenness of the product increases from stage to stage after the draw frame. There are two reasons for this. Firstly the number of fibres in the section steadily decreases. Uniform arrangement of fibres becomes more difficult because of their smaller number. Secondly each drafting operation increases the unevenness. Each processing stage is a source of faults. Drafting arrangements, in particular increase unevenness considerably. In order, finally, to achieve a stable yarn the process must include operations that give an equalizing effect. These can be doubling, leveling, and drawing [1]. In general doubling means the increase in weight per unit length [1]. Doubling is a process used in yarn manufacturing by which a single product is produced from a several intermediate feed product. For example, sliver doubling where 4 to 8 slivers are fed to draw frame and 1 sliver is delivered. On the other hand, draft is to reduce the linear density of a fibrous assembly by drawing. This process is called drafting and drafting operation increases the unevenness [4]. The function of draw frame is to provide doubling and drawing at the same time. The paper is to find out whether the change of number of doubling has any effect on yarn quality or to find out the suitable number of sliver doubling in passage 1 and passage 2.The entire question leads us to this experiment.
II. DOUBLING
Doubling is very important for equalizing. This means well distribution of different fibres with their same or different properties all along the length of the delivery sliver. The main purpose of doubling is blending and elimination of mass variation of the delivery sliver [1]. Mass variation is reduced if there are a few thick places and some amount of thin places in the same zone. If this kind of set up does not arise the task of elimination of mass variation completely
depends on the auto leveler [3]. Blending also improved by doubling because cans from different carding machines are fed to a breaker draw frame and cans of different breaker draw frame are fed to different finisher draw frame [5]. Thus a very good blending of fibre can be achieved. When doubling and drawing are combined, the input materials are doubled to reduce the long-term errors; however, new errors of shorter wavelengths are added as a result of the process of elongation. There is an exchange of relatively long-term for short-term error [6].
III. MATERIAL AND METHOD
In modern installation, the raw material is supplied via ducting pipe into the feed chute of the carding machine. The carding machine produces card sliver. Then the card sliver cans are fed to the breaker draw frame. The breaker draw frame sliver cans are then fed to the finisher draw frame. In breaker and finisher draw frame different numbers of doublings was used and for each sample roving in simplex machine were made and finally yarn was made in ring frame. After producing yarn we test the quality of yarn.
IV. EXPERIMENTAL PROCEDURE
V. DATA ANALYSIS
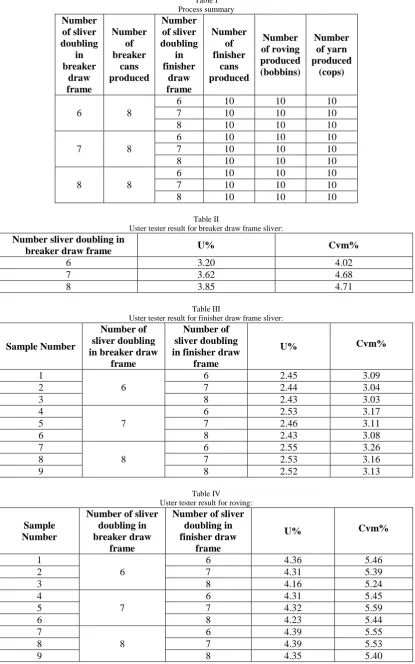
Table I Process summary
Number of sliver doubling
in breaker
draw frame
Number of breaker
cans produced
Number of sliver doubling
in finisher
draw frame
Number of finisher
cans produced
Number of roving produced (bobbins)
Number of yarn produced
(cops)
6 8
6 10 10 10
7 10 10 10
8 10 10 10
7 8
6 10 10 10
7 10 10 10
8 10 10 10
8 8
6 10 10 10
7 10 10 10
8 10 10 10
Table II
Uster tester result for breaker draw frame sliver:
Number sliver doubling in
breaker draw frame U% Cvm%
6 3.20 4.02
7 3.62 4.68
8 3.85 4.71
Table III
Uster tester result for finisher draw frame sliver:
Sample Number
Number of sliver doubling in breaker draw
frame
Number of sliver doubling in finisher draw
frame
U% Cvm%
1
6
6 2.45 3.09
2 7 2.44 3.04
3 8 2.43 3.03
4
7
6 2.53 3.17
5 7 2.46 3.11
6 8 2.43 3.08
7
8
6 2.55 3.26
8 7 2.53 3.16
9 8 2.52 3.13
Table IV Uster tester result for roving:
Sample Number
Number of sliver doubling in breaker draw
frame
Number of sliver doubling in finisher draw
frame
U% Cvm%
1
6
6 4.36 5.46
2 7 4.31 5.39
3 8 4.16 5.24
4
7
6 4.31 5.45
5 7 4.32 5.59
6 8 4.23 5.44
7
8
6 4.39 5.55
8 7 4.39 5.53
Table V
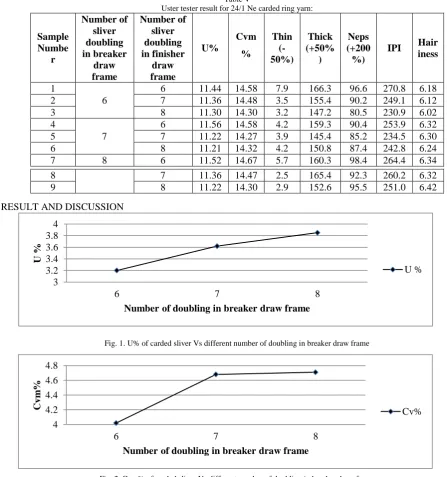
Uster tester result for 24/1 Ne carded ring yarn:
Sample Numbe
r
Number of sliver doubling in breaker
draw frame
Number of sliver doubling in finisher
draw frame
U%
Cvm %
Thin (-50%)
Thick (+50%
)
Neps (+200 %)
IPI Hair iness
1
6
6 11.44 14.58 7.9 166.3 96.6 270.8 6.18
2 7 11.36 14.48 3.5 155.4 90.2 249.1 6.12
3 8 11.30 14.30 3.2 147.2 80.5 230.9 6.02
4
7
6 11.56 14.58 4.2 159.3 90.4 253.9 6.32
5 7 11.22 14.27 3.9 145.4 85.2 234.5 6.30
6 8 11.21 14.32 4.2 150.8 87.4 242.8 6.24
7 8 6 11.52 14.67 5.7 160.3 98.4 264.4 6.34
VI. RESULT AND DISCUSSION
Fig. 1. U% of carded sliver Vs different number of doubling in breaker draw frame
Fig. 2. Cvm% of carded sliver Vs different number of doubling in breaker draw frame
From Figure 1 & 2, it is observed that U% & Cvm% of card sliver shows an increasing trend when the number of doubling increase. The main reason of this increasing trend is when number of doubling were increased the feed
material weight increases but delivery material weight is needed to remain same. So breaker draw frame draft is increased and that increases the U% and Cvm% of sliver.
Fig. 3. U% of carded sliver Vs different number of doubling combination sample in finisher draw frame
8 7 11.36 14.47 2.5 165.4 92.3 260.2 6.32
9 8 11.22 14.30 2.9 152.6 95.5 251.0 6.42
3 3.2 3.4 3.6 3.8 4
6 7 8
U
%
Number of doubling in breaker draw frame
U %
4 4.2 4.4 4.6 4.8
6 7 8
Cv
m
%
Number of doubling in breaker draw frame
Cv%
2.42 2.47 2.52 2.57
1 2 3 4 5 6 7 8 9
U%
Sample Number
Fig. 4. Cvm% of carded sliver Vs different number of doubling combination sample in finisher draw frame
From Figure 3 & 4, it is observed that U% & Cvm% of card sliver in finisher draw frame shows a decreasing trend when the number of doubling in finisher draw frame increases (sample no 1 to3, 4 to 6, 7 to 9 ). The main reason of this
decreasing trend is finisher draw frame has auto leveller. It reduces the unevenness of sliver with the increment of number of doubling.
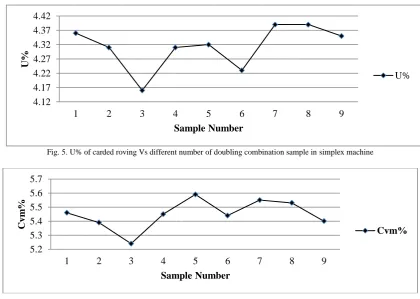
Fig. 5. U% of carded roving Vs different number of doubling combination sample in simplex machine
Fig. 6. Cvm% of carded roving Vs different number of doubling combination sample in simplex machine
From Figure 5 & 6, it is observed that U% & Cvm% of card roving in roving frame shows a decreasing trend when the number of doubling in finisher draw frame increases
(sample no 1 to3, 4 to 6, and 7 to 9). Sample 3 shows the best result.
Fig. 7. U% of carded yarn Vs different number of doubling combination sample in ring frame
5.2 5.3 5.4 5.5 5.6 5.7
1 2 3 4 5 6 7 8 9
Cv
m
%
Sample Number
Cvm%
3 3.05 3.1 3.15 3.2 3.25 3.3
1 2 3 4 5 6 7 8 9
Cv
m
%
Sample Number
Cvm%
4.12 4.17 4.22 4.27 4.32 4.37 4.42
1 2 3 4 5 6 7 8 9
U%
Sample Number
U%
11.2 11.3 11.4 11.5 11.6
1 2 3 4 5 6 7 8 9
U%
Sample Number
From Figure 7 it is observed that U% of carded yarn at ring frame shows a decreasing trend when the number of
doubling in finisher draw frame increases (sample no 1 to3, 4 to 6, and 7 to 9). Sample 6 shows the best result.
Fig. 8. Cvm% of carded yarn Vs different number of doubling combination sample in ring frame
From Figure 8, it is observed that Cvm% of carded yarn shows a decreasing trend when the number of doubling in
finisher draw frame increases (sample no 1 to3, 4 to 6, and 7 to 9). Sample 5 shows the best result.
Fig. 9. Yarn imperfection index (IPI) of carded yarn Vs different number of doubling combination sample in ring frame
From Figure 9, it is observed that imperfection index (IPI) of carded yarn shows a decreasing trend when the number of
doubling in finisher draw frame increases (sample no 1 to3, 7 to 9). Sample 3 shows the best result.
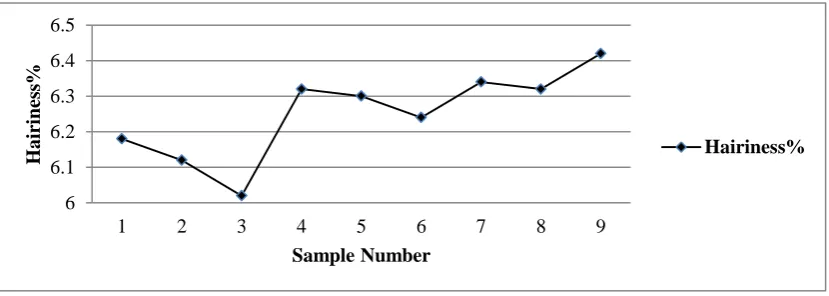
Fig. 10. Hairiness of carded yarn Vs different number of doubling combination sample in ring frame
From Figure 10, it is observed that hairiness of carded ring yarn shows a decreasing trend when the number of doubling in finisher draw frame increases (sample no 1 to3, 4 to 6). Sample 3 shows the best result.
VII. CONCLUSION
This experiment shows that sample no-3 means six doubling in breaker and eight doubling in finisher draw frame is a
good combination of doubling in carded ring yarn production. Considering U% and Cvm% sample-3 does not show the best result. The U% and Cvm% value of other sample are very close to sample-3 value. In case of yarn quality main parameter is yarn imperfection index (IPI). In 6-8 doubling combination yarn imperfection index (IPI) is lower. In the yarn test result considering IPI and hairiness it is clearly seen that 6-8 doubling combination is the best. A 14.2
14.3 14.4 14.5 14.6 14.7
1 2 3 4 5 6 7 8 9
Cv
m
%
Sample Number
Cvm%
225 235 245 255 265 275
1 2 3 4 5 6 7 8 9
IP
I%
Sample Number
IPI%
6 6.1 6.2 6.3 6.4 6.5
1 2 3 4 5 6 7 8 9
H
a
irines
s%
Sample Number
spinning mill which is looking for very good quality yarn should try this setup.
REFERENCES
[1] Klein W., Manual of Textile Technology, The Textile Institute. ISBN 0 900739 91 6
[2] Pattabhiram T. K., Essential Elements of Practical Cotton Spinning, Somaiya Publications Pvt. Ltd. Mumbai, New Delhi.
[3] Lawrence, Ph.D. Carl A. Fundamentals of Spun Yarn Technology. Library of Congress Cataloging-in-Publication Data, ISBN 1-56676-821-7 (alk. paper)
[4] Mohammed Rubaiyat Chowdhury, “Effect of doubling numbers on sliver and yarn quality,” The AUST Journal of Science and Technology, vol.-1, Issue-2, July, 2009, pp. 117–126
[5] Akshay Kumar, S M Ishtiaque, “Impact of different stages of spinning process on fibre orientation and properties of ring, rotor and air-jet yarns,” Indian Journal of Fibre & Textile Research, vol.-33, December. 2008, pp. 451–467