Patent Abstract Analysis on Chinese Big Data Based on A
Filter-Refinement Scheme
Zongbao Yang, Shaohong Zhang
*, Jianyu Liu, Zhiqian Zhang, Xiaofei Xing, Ying Gao
Department of Computer Science, GuangZhou University, Guangzhou, P.R. China.
* Corresponding author. Tel.: 13433973800; email: [email protected] Manuscript submitted March 25, 2019; accepted June 25, 2019. doi: 10.17706/jcp.14.7.479-496
Abstract: Great attention has been paid to big data technologies by both industry and academia in recent years. Patent analysis is widely viewed as an important tool for tracking these technologies. However, there are some challenges when searching patents in practice, especially in the coverage of research results. Most patent analysis methods use keywords to search for information. However, big data techniques involve in many applications, and different patent applicants make various subjective decisions in the selection of keywords. Considering this problem, we proposed a new, more precise method for big data patent analysis based on a novel filter-refinement scheme. We compared our method with other keyword extracted methods, including SegPhrase, C-value, and Word2vec, etc. The experimental results show that the phrases extracted by the filter-refinement scheme outperformed the competitors on various measures and most of these phrases have a high quality. By applying our results to the analysis of domestic big data technologies in China, we found that there is greater development in industry than in academia; Huawei has the largest number of patent applications. In addition, the development of big data technologies in China is unbalanced, with the development level of the eastern regions significantly outperforming that of the western regions.
Availability: The data sets and sample Python (Version 2.7.11) source code used in the paper are available on the following Baidu cloud network disk: https://pan.baidu.com/s/14mDsnYWDPdErbxPgksm5I3Q
Key words: Big data patents, filter-refinement scheme, patent analysis, abstract analysis.
1.
Introduction
Big data consists of massive data sets that have large, varied and complex structure; it is difficult to store, analyze and visualize for further processing or results [1]. With the fast development of information-sensing Internet of things devices1 such as mobile devices, cell phones and wireless sensor
networks [2], the capacity of the world to store information has roughly doubled every 40 months since the 1980s [3]. According to estimates by the International Data Corporation (IDC), the amount of data has been growing at an annual rate of 50%2. McKinsey & Company, Inc. announced Big Data: The Next Frontier of
Innovation, Competition, and Productivity, which relates to the advent of the age of big data in 2011 [4]. A 2012 column in the New York Times in stated that the big data era has come.
The rapid development of big data technologies has attracted much attention from scholars and companies. In fact, the computing power of domestic Internet enterprises, represented by BAT, does not lag behind that of the world. For example, on 2016 Nov. 10, the 2016 Benchmark Final Ranking published the
1 https://en.wikipedia.org/wiki/Big data
Sort Benchmark Global Ranking Contest, in which the Tencent big data cloud team finished sorting 100TB of data in less than 99 seconds (98.8 seconds), which broke the previous record of 329 seconds established by Alibaba. Earlier, Baidu achieved a record of 716 seconds and Hadoop 4222 seconds, which indicates that China has great power to process big data. In addition, there have been increasingly many applications of big data in various fields, such as credit [5], healthcare [6], education [7], sports [8], real estate [9], crime [10], bioinformatics [11], [12] and security [13].
With the development of computer technologies, including deep learning, machine learning, and natural language processing, many methods have been developed to analyze the development of technologies. Patent analysis is widely viewed as an efficient approach for analyzing technological innovation and forecasting [14]. Kim and Jun analyzed Apple's patents to understand the technological innovation of Apple [15]. Wen et al. proposed a new standard for patent representation and organization, complete with additional inter-word relationships mined from titles, abstracts and patent claims, to improve accuracy and interpretability in patent topic discovery tasks [16]. Sofean et al. developed a robust and scalable segmentation tool for the automatic structuring of patent texts into predefined sections; this serves as a pre-processing step for patent text information retrieval and extraction [17].
Patent search is the basis of patent analysis, and research results often determine the analysis quality. There are three challenges in patent search, which are as follows [18]. 1) Low readability: People may use rhetorical structures and ambiguous phrases to defend their inventions and obtain broader protection. 2)
Lengthy queries: People often use entire patent documents as search queries. 3) High Recall: Missing even one strongly relevant document is unacceptable in patent retrieval because of the tremendous costs involved in patent lawsuits.
As a recall-oriented search task, patent searching does not allow missing relevant patent documents due to the high commercial value of patents and the high costs of processing patent applications and infringements. Therefore, it is important to retrieve all possible relevant documents rather than finding only a small subset of them. However, in practice, applicants often describe their patents abstractly or make claims without enough technical details to decrease the retrievability of their patents [19]. In addition, researchers often retrieve patents by using their own keywords, which may miss some important keywords. Both issues may lead to incomplete query results.
One efficient way to solve this problem is to enrich query phrases to improve keyword coverage. This is called query expansion, for which there are two main methods: the appending method and the feedback method [20], [21]. The appending method appends additional phrases to the original keyword set; these additional phrases can be extracted from either the query document or external resources, such as Wordnet or Wikipedia [22]-[24]. If the query patent document itself is exploited to expand the original keyword set, we call this an internal method [25], [26]. If external resources are used to expand the original keyword set, we call this an external method [27], [28]. Feedback-based methods make use of user feedback to improve the search results. However, when users retrieve documents, it is difficult for researchers to obtain feedback from them [29]-[31]. Citation analysis is a typical part of feedback-based methods [32]-[34]. In particular, the pseudo-relevance feedback method has been used extensively for patent retrieval [25], [35].
big data analysis with regard to big data patent documents [39]. Li et al. analyzed the trend in patent application quantity in China and several other countries by using the SooPAT [40].
In this paper, we extracted 'big data' related phrases through abstract analysis based on a filter-refinement scheme. The Chinese wikipedia data set was used to train the model by Gensim to calculate the similarity between the extracted phrases and 'big data', and four methods (TF-IDF, SegPhrase, C-value and Word2vec) were used to do the same job in the same corpus. With the trained model, we could calculate and obtain the similarity matrix of each method, and evaluate the quality of them based on four measures (Euclidean distance, mean, cosine similarity and Manhattan distance). The experimental results show that the proposed method is outperformed on these measures, which indicated the phrases we extracted are more related with 'big data'. We composed these 'big data' related phrases as a new search formula to retrieve the information of big data patents in China domestic, from a patent service system CNIPSUN3. The research results were further used to analyze the development of the big data technologies
in China.
The rest of this paper is organized as follows: Section 2 introduces some background knowledge and problems described of this paper; Section 3 describes the methods of how to solve some problems mentioned. Section 4 introduces an experiment to verify the efficiency of the filter-refinement scheme. Section 5 analyses the developmental characteristics of domestic big data technologies in China. Finally, several findings and conclusions are given according to our research results in Section 6.
2.
Assumptions and Problems Described
2.1.
Assumptions
Preliminary knowledge is needed for designing the filter. Here we present two assumptions based on the background knowledge. To make it is more clearly, we used some abbreviations, which were introduced as following:
RBF-set: stands for the keywords of the randomly download abstracts before been filtered;
BBF-set: stands for the keywords of the big data related abstracts before been filtered.
F-set: stands for the designed Filter in this paper;
AF-set: stands for the keywords extracted thought the Filter (after been filtered);
f(p): means the frequency of a phrase p;
: Means the threshold of the frequency of the phrases in the RBF-set;C: stands for the set of common phrases;
We used the bold capital letters (e.g. W) denotes the vector of phrases; the no bold letters (e.g. w) denotes a phrase.
Assumption 1: If the number of the occurrence times of a phrase exceeds the threshold ψ, this phrase will be called as a common phrase. It can be more clearly explained in the following Eq. (1).
(1)
(1)
| ( )
|
r j i
i i i
P p f p and p RBF set
C p p P and p BBF set
= −
= −
(1)
In Eq. (1), (1)
P
stands for the phrases, which the frequency of them is no less than
;p r
_
standsfor a phrase in the RBF-set;
p i
_
stands for a phrase in the BBF-set. Any phrases inC
will be called as a common phrases.Assumption 2: If the phrases in the filtered version are better than the phrases in the BBF-set, the filter will be considered as an efficient one. 'Better than' here means the phrases extracted by the filter are more relevant with the 'big data' than the phrases in the BBF-set. To make it more clearly, we formulated the question as following:
1
0.1
( ) * ( );
1 n
i i i
i
count i w fc p w
=
= =
ii if p C
if p C (2)
In Eq. (2),
count i
( )
stands for the accumulate number of the occurrence times of the firsti
phrasesin the RBF-set or BBF-set in the comparing string. The comparing string will be introduced detailed in the section of 3.3;
p i
_
stands for thei th
−
phrase in RBF-set or the BBF-set;w
i stands for the weight ofi
p
;fc p
(
i)
stands for the frequency of the phrasep
i in the comparing string.
( , ) ( ) ( );
10,10 ,10 2 ,...
D i count i count i
where i
= − +
+ +
(3)
In Eq. (3),
D i
( , )
stands for the D-value of the accumulative number of the occurrence times of thefirst
i
and first (i
+
) phrases.2.2.
Problems Described
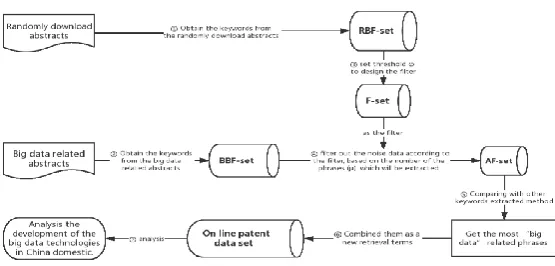
Fig. 1. Flow chart of the overall framework of this paper.
To make the presentation of this paper more clearly, we used a flow chart, shown as Fig. 1, to explain it. From the flow chart we can see that, there are seven main problems in this paper, and we described them as following:
Problem 1-2: Processing the patent abstracts. We have two data set of patent abstracts, obtained from the patent retrieval web sites. We should process these data set and extracted the keywords from the abstracts, which was introduced detailed in the section of 3.1.
Problem 3: Designing the filter. The main purpose of this paper is designing an efficient filter to filter out some noise data. The size of the filter will have a great effect on the filtering results. How to design the filter will be introduced detailed in the section of 3.2.
in the AF-set, and the quality of these extracted phrases. It will be introduced detailed in the section of 3.3
Problem 5: Comparing with other keywords extracting methods. There are some other keywords extracting methods in the previous works. We compared our approach with the other methods to obtain the most 'big data' related phrases, which will be introduced detailed in the section of 4.1.
Problem 6 and 7: Retrieving and analysis the big data technologies of China domestic. Combining these extracted phrases as a new retrieval terms to search and analysis the development of the big data technologies in China domestic, which will be introduced detailed in the section of 5.
3.
Method
In this paper, a new method for patent analysis is proposed. We collected abstracts of big data patents from various public databases and used a filter-refinement scheme to refine the extracted phrases related to 'big data'. As a result, more accurate phrases were extracted. In this section, we will introduce the methods of how to solve some problems mentioned above.
3.1.
Processing the Patent Abstracts
We extracted two groups of patent abstracts from various public databases and segmented the abstracts by extracting their keywords. We used a Python package named 'jieba'4, which supports three-word
segmentation models. (1) Precise model: which tries to cut sentences as accurately as possible. Therefore, it is suitable for text analysis. (2) Full model: which can scan every word that might be part of a phrase in a sentence; it is very fast but cannot resolve ambiguity. (3) Search engine model: ased on the exact model. Long words are cut again; the recall rate is improved, which is suitable for search engine word segmentation. However, none of these modes is suitable for our aims, so we used an improved segmentation model5 to extract the keywords from each abstract.
In fact, the improved segmentation model could extract keywords from the abstract, which is different from the other three segmentation models. The purpose of this paper is also to extract the most 'big data' related phrases, so that, the improved model is more suit for our goals.
3.2.
Designing the Filter
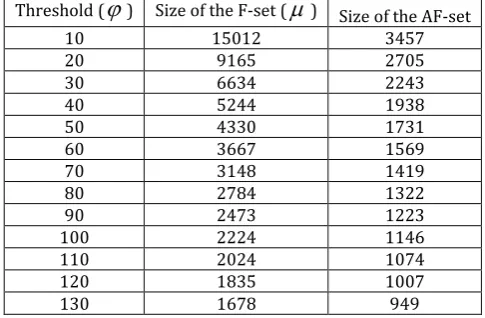
We can see clearly from the Table 1 that, the smaller the threshold (
) is, the bigger the size of F-set and AF-set. The threshold
means the frequency of phrases in the RBF-set. We just chose these phrases, which the frequency of them no less than
, from the RBF-set as elements of the F-set.Table 1. The Relationship of the Threshold
with the Size of the F-set and the AF-setThreshold (
) Size of the F-set (
) Size of the AF-set10 15012 3457
20 9165 2705
30 6634 2243
40 5244 1938
50 4330 1731
60 3667 1569
70 3148 1419
80 2784 1322
90 2473 1223
100 2224 1146
110 2024 1074
120 1835 1007
130 1678 949
140 1552 898
150 1447 858
160 1333 810
170 1244 761
180 1167 734
190 1109 713
200 1060 681
With the increasing of the threshold, more phrases would be saved in the AF-set. Therefore, the quality of these extra saved phrases are so important for the selection of the size of the filter. It is obvious that, if the extra saved phrases have a greater relevance with the 'big data', the filter will be more efficient, therefore, the phrases in the AF-set will be more related with the 'big data'. For example, if the threshold is 20, there will be 2705 phrases be filtered out; if the threshold is 10, there will be 3457 phrases be filtered out. 752 phrases will be saved if the threshold changed from 20 to 10. Then, the quality of these 752 phrases will be calculated.
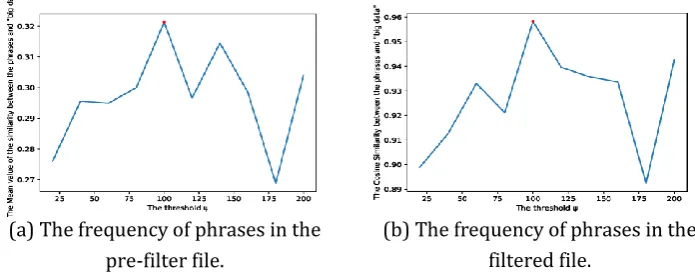
Here, we used the Chinese wikipedia as the training set to train the Gensim model, and calculate the relevance between the extra saved phrases and the 'big data'. For each threshold, we can get a list of extra saved phrases, and each phrase in the list have a relevance with 'big data'. Therefore, we could get the relevance vector between these phrases and the 'big data' under each threshold. The mean value and the cosine similarity of the vector could be used to compare with each other. The comparing result were shown as Fig. 2. In which, the red point stands for the local maximum under the threshold from 10 to 200. When it achieves the local maximum, the threshold
is 100. Therefore, we could get a conclusion that, when the threshold was set to 100, the AF-set will have the most 'big data' related phrases.Fig. 2. The frequency of phrases in the filtered and the pre-filter files.
3.3.
Number of Phrases (
) we Extracted from the Corpus
Not all of these phrases in the AF-set have a great relevance with the 'big data', therefore, how many phrases we should save in AF-set is necessary to be solved. In other words, we should determine the value of
.A phrase is considered important if it occurs many times in a precisely organized article, if it is not common or a stop word. Wikipedia, Think Tank and Baidu Encyclopedia are recognized as authoritative and academic information platforms. They have rich and clear explanations and comprehensive, systematic content that was carefully researched by professionals. They are also easy to use. Therefore, we obtained a description of 'big data' from these three authoritative network encyclopedias and saved its contents as a
comparison string.
(a) The frequency of phrases in the pre-filter file.
We used the Eq. (2) (3) (4) to calculate the
D i
( , )
, with the parameters =
10
and
i
10, 20,..., 200
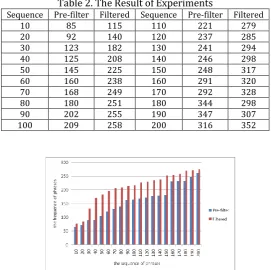
. The results are shown in Table 2, and visualized in Fig. 3. The ‘115’ in row 2,column 3 of Table 2 means the cumulative frequency of the first 10 phrases in the comparison string, and the rest can be done in the same manner. From the Fig. 3, we can clearly find that
count i
( )
is anincreasing function, so that, for each
i
(i
10, 20,..., 30
), t=1. Therefore, we get the conclusion that the filter is an efficient one.Table 2. The Result of Experiments
Sequence Pre-filter Filtered Sequence Pre-filter Filtered 10 85 115 110 221 279 20 92 140 120 237 285 30 123 182 130 241 294 40 125 208 140 246 298 50 145 225 150 248 317 60 160 238 160 291 320 70 168 249 170 292 328 80 180 251 180 344 298 90 202 255 190 347 307 100 209 258 200 316 352
Fig. 3. Experimental results.
Fig. 4. Frequencies of phrases in the filtered and pre-filter files.
Next, we drew a cumulative frequency plot for the D-values between the first
10, 20,..., 200
phrases asin Fig. 4. From Fig. 4(a) we could see that the cumulative frequency of the D-values starts to decrease when the occurrence times of phrases is 40. From Fig. 4(b), we could see that the pre-filter phrases (phrases in the BBF-set) start to ascend, and the phrases in the BBF-set are in the domain from numbers 41 to 45. However, from
45
−
th
to45
−
th
, phrases in the BBF-set are technological, video, wirelesscommunication, data mining, and velocity. According to the Assumption 1, we could find that most of them
are common phrases, which will be filtered out though the filter. Although they have larger frequency, they will be filtered out and could not appear in the AF-set. Therefore, we selected the first 40 phrases as the AF-set. In other words, the parameter
=
40
.4.
Validity and Experiments
4.1.
Four Keywords Extracting Methods
To verify the efficiency of the filter-refinement scheme, we compare its performance with four other popular keywords extracting methods, including TF-IDF, SegPhrase, C-value and Word2vec. All these methods extract the top 40 phrases that are most closely related to 'big data'.
4.1.1.
Method of TF-IDF
TF-IDF is a weighting function that has been widely used in text mining and information retrieval. It is a numerical and statistical method that is intended to reflect the importance of each word in a document in a collection or corpus [41]. TF-IDF involves the multiplication of two quantities: TF, which calculates the frequency of each phrase in the file, and IDF, which offsets the phrase weight by assuming that the importance of each phrase is inversely proportional its frequency in all documents of the corpus. The most common equation for TF-IDF is Eq. (4):
*
ij i
tfidf
=
tf
idf
(4)In Eq. (4),
tf
ij is the frequency of phrasei
and can be calculated by Eq. (5):1
ij ij k
kj i
n
tf
n
=
=
(5)In Eq. (5),
n
ij is the number of phrases in whichi
occurs in the filed
j, which includes all thedocuments.
k
is the total number of documents in this corpus. 1k kj i
n
=
is the sum of all the phrase occurrences in the filed
j.As for
idf
i, we can use Eq. (6) to calculate it:|
|
| :
|
i
i j
D
idf
log
j t
d
=
(6)In Eq. (6),
|
D
|
is the total number of documents in the corpus and| :
j t
i
d
j|
is the number ofdocuments containing phrase
i
. However, the following issue may arise: ifi
is not in a document,then
| :
j t
i
d
j| 0
=
, which will cause an error in the equation because the denominator cannot be zero.Thus, we often use
| :
j t
i
d
j| 1
+
instead of| :
j t
i
d
j|
.Finally, we used the theory above to extract the top 40 most 'big data' related phrases.
4.1.2.
Method of Word2vec
Word2vec is a group of related models that are used to produce word embedding. We often use the genism6 to calculate the model. Gensim is a Python library for topic modeling, document indexing and
similarity retrieval in large corpora. We could use the big data related patents abstracts as a training set to
train the Gensim model, with which we could extract the top 40 most 'big data' related phrase.
4.1.3.
Method of SegPhrase
SegPhrase [42], [43] is a new framework designed by Jialu Liu, Jingbo Shang, Jiawen Han, et al. This framework can extract quality phrases from corpora integrated with phrasal segmentation with only a limited training set, although it requires considerable space and computational time. It can also support multiple languages, such as English, Spanish, and Chinese.
4.1.4.
Method of C-value
C-value is a domain-independent method for multi-words automatic phrase recognition that aims to improve the extraction of nested phrases [44]. We used the following schemes to calculate the C-value of each term.
log | |
log | | ( )
( )
s
s s
s b T s
s
s F C
F
s F
N T
=
−
if s is not nested
otherwise
(7)
In Eq. (7),
s
is the candidate string,F
s is its frequency in the corpus.T
s is the set of extractedcandidate phrases that contain a, and
N T
( )
s is the number of these candidate phrases.4.1.5.
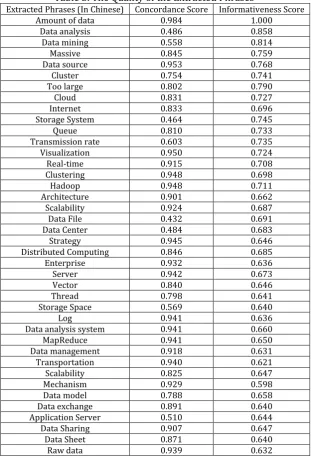
Phrases quality estimate
The phrase quality is defined to be the probability of a word sequence being a complete semantic unit [43]. However, there is no universally accepted definition of phrase quality. 'Popularity', 'Concordance', 'Informativeness' and 'Completeness' are some normal-used features to evaluate the phrase quality [42].
1) Popularity: With the development of the world, there are more and more phrases are adopted by people in various fields. Some sequence of words may be irrelevant and regarded as a non-composible semantic unit, however, there are seen as meaningful phrases in special field and age. A phrase will be viewed as a quality phrase if it occurs with sufficient frequency in a given document collection. It will be meaningful to discovery these new phrases.
2) Concordance: Concordance refers to the collocation of tokens in such frequency that is significantly higher than what is expected due to chance [43].
3) Informativeness: A phrase is informative if it is indicative of a specific topic. For example, 'This paper' is a popular and concordant phrase, but not informative in research publication corpus.
4) Completeness: Long frequent phrases and their subsequences within those phrases may both satisfy the three criteria above. A complete phrase should be interpreted as a whole semantic unit in certain context.
Table 3. The Quality of the Extracted Phrases
Extracted Phrases (In Chinese) Concordance Score Informativeness Score Amount of data 0.984 1.000
Data analysis 0.486 0.858 Data mining 0.558 0.814 Massive 0.845 0.759 Data source 0.953 0.768 Cluster 0.754 0.741 Too large 0.802 0.790
Cloud 0.831 0.727
Internet 0.833 0.696 Storage System 0.464 0.745
Queue 0.810 0.733
Transmission rate 0.603 0.735 Visualization 0.950 0.724 Real-time 0.915 0.708 Clustering 0.948 0.698 Hadoop 0.948 0.711 Architecture 0.901 0.662 Scalability 0.924 0.687 Data File 0.432 0.691 Data Center 0.484 0.683 Strategy 0.945 0.646 Distributed Computing 0.846 0.685 Enterprise 0.932 0.636 Server 0.942 0.673 Vector 0.840 0.646 Thread 0.798 0.641 Storage Space 0.569 0.640
Log 0.941 0.636
Data analysis system 0.941 0.660 MapReduce 0.941 0.650 Data management 0.918 0.631 Transportation 0.940 0.621 Scalability 0.825 0.647 Mechanism 0.929 0.598 Data model 0.788 0.658 Data exchange 0.891 0.640 Application Server 0.510 0.644 Data Sharing 0.907 0.647 Data Sheet 0.871 0.640 Raw data 0.939 0.632
4.2.
Relevance between the Extracted Phrases and 'Big Data'
In this paper, we have designed a measure to evaluate the relevance of extracted phrases to 'Big Data'. The Chinese Wikipedia was used as the training set to train the Gensim model, with this model, we could calculate the similarity between each phrase and 'big data'. We obtain a phrase relevancy vector for each method and denote them as ( ) ( ) ( )
1 2
[
v
i,
v
i,...
v
ki]
=
i
vec
, which were called as similarity vector.Here,
k
stands for the number of phrases we extracted; ( )i kv
is the similarity between thek
−
th
phrase and 'big data' as calculated by the
i th
−
keywords extracting method. For example, (1) 3v
means the similarity between the third phrase, extracted by the first keywords extracting method, and 'big data'. Then, we define another vector[1,1,...1,1]
k
=
vec
to be the basic vector, which stands for the similarity of'big data' and 'big data'; every element of this vector is
'1'
. With these defined vectors, we could calculate4.2.1.
Euclidean distance
We used Eq. (8) to calculate the Euclidean distances between the similarity vectors and the basic vector:
( ) ( ) 2 1
(
)
k=1, 2,3, 4
n k
k j j
j
OD
v
v
=
=
−
(8)In Eq. (8),
OD
k stands for the distance between the two similarity vectors,n
stands for the commonlength of the vectors, ( )k j
v
stands for the similarity vectors(
vec vec vec
1,
2,
3)
, andv
( ) stands for the basic vectorvec
. We can then calculate the Euclidean distance for each vector; the results are shown inTable 4.
4.2.2.
Mean
Next, we use Eq. (9) to calculate the mean of each similarity vector:
1
1
k=1, 2, 3, 4
n
k i
i
M
v
n
==
(9)In Eq. (9),
M
k stands for the mean value of each similarity vector,v
i stands for the elements of eachsimilarity vector, and
n
stands for the number of extracted phrases. The results are shown in Table 4.4.2.3.
Cosine similarity
We use Eq. (10) to calculate the cosine similarities between the similarity vectors and the basic vector:
1 2 1 2 1 2 2 1 1 ( )
k=1, 2, 3, 4
( ) ( )
n i i i
k n n
i i i i v v C v v = = = =
(10)In Eq. (10),
C
k stands for the cosine similarity between the similarity vector calculated by methodk
and the basic vector, where
C
k −
[ 1,1]
. The closerC
k is to 1, the more similar the directions of the twovectors, which indicates greater similarity more generally. 1
i
v
and 2i
v
stand for two different similarityvectors, where 1
i
v
, 2{
,
,
,
}
i
v
vec vec vec vec
1 2 3 4 , andn
stands for the number of extracted phrases.The detailed results are shown in Table 4.
4.2.4.
Manhattan distance
We use Eq. (11) to calculate Manhattan distances between the similarity vectors and the basic vector:
1 2
1
|
|
n
k i i
i
MD
v
v
=
=
−
(11)In Eq. (11),
MD
k stands for the Manhattan distance between the similarity vector calculated thoughmethod
k
and the basic vector. 1i
v
and 2i
v
stand for two different similarity vectors, where 1i
v
,2
{
,
,
,
}
i
v
vec vec vec vec
1 2 3 4 , andn
stands for the number of extracted phrases. The detailed resultsare shown in Table 4.
4.3.
Experiment Results
clearly observe the differences among these methods: 1) All of these methods have a high cosine similarities, which means that they all have a great relevance with 'big data'; 2) The method of filter-refinement has the shortest Euclidean distance (3.2574) and Manhattan distance (20.1371). It also has the biggest mean value (0.4966) and cosine similarity (0.9769). All these results illustrate that the phrases extracted by the filter-refinement are more relevant to 'big data'. Therefore, these extracted phrases would be efficient for extending the keyword coverage to retrieve and analysis the big data technologies.
However, the results above do not indicate that the other methods, such as the C-value and SegPhrase, are not efficient in extracting keywords from massive text corpora. In this paper, our main purpose is to extract phrases that have great relevance with 'big data'. Although the
SegPhrase
andC value
−
methods can extract phrases efficiently, common phrases and less relevant phrases still occur. The filter-refinement scheme could avoid this problem to some extent.Table 4. Experimental Results (with the Superior One Shown in Bold)
TF-IDF Word2vec C-value SegPhrase Filterre-finement Euclidean distance 3.760 3.760 3.957 3.760 3.2574 Mean 0.320 0.426 0.395 0.465 0.4966 Cosine similarity 0.941 0.940 0.928 0.971 0.9769 Manhattan Distance 27.195 22.957 24.215 21.420 20.1371
5.
The Development of Domestic Big Data Technologies in China
These extracted phrases were used to derive a new formula to retrieve 'big data' patents in the CNIPSUN database7, after which the distribution of domestic big data technologies in China was analyzed based on
the research results.
5.1.
Overall Development Trend
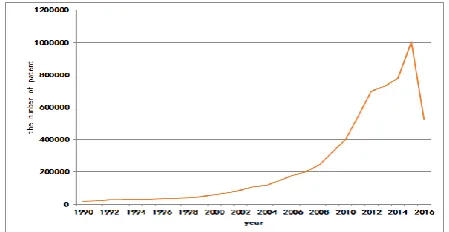
Fig. 5. Trend of applications for big data patents in China.
As shown in Fig. 5, we can see that the development of big data technologies includes two stages. The first is from 1990 to 2005. The number of big data applications and its growth rate are slow. The later stage is from 2005 to the present. After 2005, big data technologies developed well; after 2008, the speed of their growth and the number of patent applications have increased rapidly. The tail of the graph exhibits a downward trend because of delays in the publication of patent literature.
In China, the Ministry of Industry and Information Technology announced information networking technology as one of the four key technological innovation projects in the 12th Five-Year Plan. These four technological innovation projects include the storage of intelligent analysis of video, videos, data mining,
and big data, which are important to big data. In 2012, a committee of big data experts was set up by the China Computer Society to promote the research and development of big data technologies. The National Strategy for Accelerating the Implementation of Big Data was proposed during the National People's Congress (NPC) and the Chinese People's Political Consultative Conference (CPPCC) sessions in 2014 and promoted big data on the national strategic level. Supported by these policies, the big data technologies in China have developed rapidly in recent years.
5.2.
Distribution of Applicants
Fig. 6. The distribution of China's top 12 applicants for patent applications.
As shown in Fig. 6, we can observe the distribution of China's top 10 big data patent applications. In industry, Huawei, the Zhongxing Telecommunication Equipment Corporation (ZTE) and the State Grid Corporation of China have the three highest numbers of patent applications. In academia, Tsinghua University has the highest number of patent applications, followed by the University of Electronic Science and Technology, Zhejiang University and Shanghai Jiaotong University. There has been a wide range of research on big data technologies in China, both in industry and academia. Various industries have been involved in the research and development of big data technologies. A good atmosphere for the development of big data has formed and provides good conditions for industry-university cooperation.
5.3.
Regional Distribution and Trend
Fig. 7. The trend and regional distribution of big data patent applications in China.
As shown in Fig. 7, we can see the trend and regional distribution of big data patent applications in China. In Fig. 7(b), the darker the color is, the more patent applications exist, which indicates greater development of big data technologies. We can also see that the development of big data technologies is mainly concentrated in developed industrial areas such as Beijing, Guangdong, and Shanghai. From Fig. 7(a) we
(a) The trend of big data patent applications
conclude that Beijing, Guangdong, Shanghai, Jiangsu and Zhejiang are the top five cities/provinces in China, accounting for 15%, 14%, 11%, 11% and 6%, respectively. These five provinces accounted for 57% of China's big data patents, far ahead of the other domestic provinces. They are the leaders of science and technology in China, with strong comprehensive abilities. Finally, great attention should be paid to the unbalanced development of China's big data technologies. The development of big data technologies in the eastern cities of China is generally better than that in the western cities, which is similar to the development of China's economy [45].
5.4.
Invention, Utility Model, and Design Patents and Acceptance
Fig. 8. The distribution percentages and trends for the acceptance of invention, utility model, and design patents.
As shown in Fig. 8, we can observe the distribution percentage and trends for the acceptance of invention, utility model, and design patents related to big data. Patents are divided into three types8 in China:
invention, utility model and design. From Fig. 8(a) we can see that they account for 69%, 27%, and 4% of the total number of big data patents, respectively. We took the accepted patents into account to illustrate the delays in the publication of patent documents, which we mentioned previously. From Fig. 8(b), we can see that the number of patents granted between 2015 and 2016 is relatively small, which illustrates that the granting of patents exhibits a time delay. The downward trend in the tail of Fig. 8(b) is also caused by this delay.
6.
Findings and Conclusions
6.1.
Findings
Big data is a promising advanced technology that deserves much attention. Based on the analysis above and the results of our research, we have made the following observations:
(1) We used filter refinement to extract the top 40 phrases related to 'big data'. The extracted phrases are as follows (in Chinese): 1) amount of data, 2) data analysis, 3) data mining, 4) massive, 5) data source, 6) cluster, 7) too large, 8) cloud, 9) Internet, 10) storage system, 11) queue, 12) transmission rate, 13) visualization, 14) real-time, 15) clustering, 16) Hadoop, 17) architecture, 18) scalability, 19) data file, 20) data center, 21) strategy, 22) distributed computing, 23) enterprise, 24) server, 25) vector, 26) thread, 27) storage space, 28) log, 29) data analysis system, 30) Map-Reduce, 31) data management, 32) transportation, 33) scalability, 34) mechanism, 35) data model, 36) data exchange, 37) application server, 38) data sharing, 39) data sheet, 40) raw data.
(2) There have been two stages in the development of big data in China domestic. The first stage was
8 http://baike.baidu.com/view/50915.htm
(a) The distribution percentages for patent applications
before 2005, when big data technology was in the embryonic stage with a low growth rate. The second stage is from 2005 to the present, especially after 2008. Big data technologies have had great development and the number of big data patent applications had increased rapidly due to the maturity of the technology and support from policies.
(3) Universities and enterprises are significant to the development of a country's advanced technology. They are a mainstay of the research and development of new technologies. Most big data patent applicants are from universities and enterprises. Compared with universities, enterprises have an advantage in big data technologies.
(4) As with social and economic development in China, the development of big data technologies has been faced with a lack of balance. Cities in eastern China generally show better development than western cities. Beijing, Shanghai, Guangdong, Jiangsu, and Zhejiang have strong comprehensive abilities, and the number of their patent applications in big data is 59\%, which is already more than half of the total number of big data patents in China.
(5) Invention patents accounted for 69\% of the total number of big data patents, which indicates that current big data-related technology exhibits considerable creativity, novelty and practicalit9.
6.2.
Conclusions
The amount of data and the ability to process large amounts of data are becoming an important measure to evaluate the national strength. The development of big data technologies in China domestic is at the forefront of the world.
In this paper, we proposed a filter-refinement method to extract 'big data' related phrases from patent abstracts. We designed a filter to filter out the noise data, and analyzed a suitable number of phrase that we should extract. Four keywords extracting methods, including the SegPhrase, TF-IDF, C-value and Gensim model, were used as the comparisons. The Mean value, Euclidean distance, Manhattan distance and Cosine similarity were used to evaluate the efficiency of each method. The result shown that, the phrases extracted by the filter-refinement are more related with 'big data', which mainly benefited from the filtering of the common phrases and the phrase with low correlation to 'big data'.
Further more, these 'big data' related phrases were combined as the new terms to retrieve big data patent in the CNIPSUN database. It is unlike the traditional methods, based on keyword matching, the new method proposed here could extend more keywords coverage to perform a more extensive search. Finally, we could analysis the development of the big data technologies in China domestic based on the retrieval results.
Acknowledgment
The work described in this paper was partially supported by grants from Guangdong Natural Science Foundation of China [Grant No. 2018A030313922], Scientific and Technological Project of Guangzhou [Project No. 201707010284], Science and Technology Projects of Guangdong Province, China [Grant No. 2016B010127001], the funding of Guangzhou education scientific research project [Project No. 1201730714], 2016 Education reform project of Guangdong Province [Project Name 'Research on Construction and Mining methods in Knowledge Graphs of Computer Sciences Courses', Project No. 426, File [2016]236]], the Postgraduate Educational Reform project of Guangdong Province [No. 2017JGXM-MS45], and the Graduate Innovative Research Grant Program of Guangzhou University [No. 201711078088, No.2017GDJC-M15, 2018GDJC-M16].
References
[1] Sagiroglu, S., & Sinanc, D. (2013). Big data: A review. Proceedings of International Conference on
Collaboration Technologies and Systems (pp. 42-47).
[2] Yau, N., Follett, J., Holm, M., Hughes, J. M., & Cooper. (2010). Beautiful Data: The Stories behind Elegant Data Solutions.
[3] Hilbert, M., & L´l ˝opez, P. (2011). The world’s technological capacity to store, communicate, and compute information. Science, 332(6025), 60–65.
[4] Manyika, J., Chui, M., Brown, B., Bughin, J., Dobbs, R., Roxburgh, C., & Byers, A. H. (2011). Big data: The next frontier for innovation, comptetition, and productivity. Analytics.
[5] Anderson, B., & Hardin, J. M. (2014). Credit scoring in the age of big data. Encyclopedia of Business Analytics
& Optimization, 549-557.
[6] Belle, A., Thiagarajan, R., Soroushmehr, S. M. R., Navidi, F., Beard, D. A., & Najarian, K. (2015). Big data analytics in healthcare. BioMed Research International, 370194–370194.
[7] Agostino, D., & Arnaboldi, M. (2017). Social media data used in the measurement of public services effectiveness: Empirical evidence from Twitter in higher education institutions. Public Policy and
Administration, 32(4), 296-322.
[8] Yu, Y., & Wang, X. (2015). World cup 2014 in the twitter world: A big data analysis of sentiments in U.S.
sports fans’ tweets. Computers in Human Behavior,48, 392-400.
[9] Cheng, X., Yuan, M., Xu, L., Zhang, T., Jia, Y., Cheng, C., & Chen, W. (2016). Big Data Assisted Customer Analysis
and Advertising Architecture for Real Estate, 312-317.
[10] Wang, H., Kifer, D., Graif, C., & Li, Z. (2016). Crime rate inference with big data. Proceedings of the 22nd ACM
SIGKDD International Conference on Knowledge Discovery and Data Mining (pp. 635-644). San Francisco, CA,
USA.
[11] Huang, H., Zhang, S., Shen, W. J., Wong, H. S., & Xie, D. (2015). Gene set enrichment ensemble using fold change data only. Journal of Biomedical Informatics,57(C), 189-203.
[12] Zhang, S., Wong, H. S., Shen, Y., & Xie, D. (2012). A new unsupervised feature ranking method for gene expression data based on consensus affinity. IEEE/ACM Transactions on Computational Biology &
Bioinformatics,9(4), 1257.
[13] Grant-Muller, S., Hodgson, F., Malleson, N., & Snowball, R. (2017). Enhancing energy, health and security policy by extracting, enriching and interfacing next generation data in the transport domain. A Study on the
Use of Big Data in Cross-Sectoral Policy Development, 515-518.
[14]Grimshaw, D. J. (1991). Forecasting and management of technology: By alan l. porter, a. thomas roper, thomas w. mason, frederick a. rossini and jerry banks john wilev & sons inc., New York. J. Strategic Inf. Sys., 1(1), 47.
[15] Kim, J., & Jun, S. (2015). Graphical causal inference and copula regression model for apple keywords by text mining. Advanced Engineering Informatics,29(4), 918-929.
[16] Ma, W., Luo, X., Xuan, J., Xue, R., & Guo, Y. (2017). Discover semantic topics in patents within a specific domain. Journal Web Engineering, 16(7-8), 653-675.
[17] Sofean, M. (2017). Automatic segmentation of big data of patent texts. Proceedings of 19th International
Conference on Big Data Analytics and Knowledge Discovery, DaWaK 2017 (pp. 343-351). Lyon, France.
[18] Zhang, L., Li, L., & Li, T. (2014). Patent mining: A survey. SIGKDD Explorations, 16(2), 1-19.
[19] Tseng, Y., Lin, C., & Lin, Y. (2007). Text mining techniques for patent analysis. Inf. Process. Manage.,43(5), 1216-1247.
[20] Manning, C. D., Raghavan, P., & Schütze, H. (2008). Introduction to Information Retrieval. Cambridge University Press.
[21] Magdy, W., & Jones, G. J. F. (2011). A Study on Query Expansion Methods for Patent Retrieval, 19-24.
Technologies: Information Retrieval, Question Answering and Cross-Lingual Information Access, NTCIR-5,
National Center of Sciences. Tokyo, Japan: National Institute of Informatics (NII), 2005.
[23] Salampasis, M., & Larsen, B. (2012). Multidisciplinary information retrieval 5th international retrieval facility conference, IRFC 2012, Vienna, Austria. Lecture Notes in Computer Science, 7356, Springer.
[24] Mohamed-Salem, M. O., Shaalan, K. F., Oroumchian, F., Shakery, A., & Khelalfa, H. M. (2011). Information retrieval technology 7th Asia information retrieval societies conference, AIRS 2011, Dubai, United Arab Emirates. Lecture Notes in Computer Science,7097. Springer, 2011.
[25] Mahdabi, P., Andersson, L., Keikha, M., & Crestani, F. (2012). Automatic refinement of patent queries using concept importance predictors. Proceedings of the 35th International ACM SIGIR Conference on Research and
Development in Information Retrieval, SIGIR ’12 (pp. 505-514). Portland, OR, USA.
[26] Nguyen, K., & Myaeng, S. (2012). Query enhancement for patent prior-art-search based on keyterm dependency relations and semantic tags. Proceedings of Multidisciplinary Information Retrieval 5th
International Retrieval Facility Conference, IRFC 2012 (pp. 28-42). Vienna, Austria.
[27] Al-Shboul, B., & Myaeng, S. (2011). Query phrase expansion using wikipedia in patent class search.
Proceedings of Information Retrieval Technology 7th Asia Information Retrieval Societies Conference (pp.
115-126).AIRS 2011, Dubai, United Arab Emirates.
[28] Tannebaum, W., & Rauber, A. (2012). Analyzing query logs of USPTO examiners to identify useful query terms in patent documents for query expansion in patent searching: A preliminary study. Proceedings of
Multidisciplinary Information Retrieval 5th International Retrieval Facility Conference, IRFC 2012 (pp.
127-136). Vienna, Austria.
[29] Kraaij, W., de Vries, A. P., Clarke, C. L. A., Fuhr, N., & Kando, N. (2007). SIGIR 2007. Proceedings of the 30th Annual International ACM SIGIR Conference on Research and Development in Information Retrieval, Amsterdam, The Netherlands, ACM.
[30] Salampasis, M., & Larsen, B. (2012). Multidisciplinary information retrieval 5th international retrieval facility conference, IRFC 2012, Vienna, Austria. Lecture Notes in Computer Science,7356, Springer.
[31] Clough, P. D., Foley, C., Gurrin, C., Jones, G. J. F., Kraaij, W., Lee, H., & Murdock, V. (2011). Advances in information retrieval 33rd European conference on IR research, ECIR 2011, Dublin, Ireland. Lecture Notes in
Computer Science,6611, Springer.
[32] Fujii, A. (2007). Enhancing patent retrieval by citation analysis. Proceedings of the 30th Annual International
ACMSIGIR Conference on Research and Development in Information Retrieval, SIGIR 2007 (pp. 793-794).
Amsterdam, The Netherlands.
[33] Magdy, W., & Jones, G. J. F. (2010). Applying the KISS principle for the CLEFIP 2010 prior art candidate patent search task. CLEF 2010 LABs and Workshops, Notebook Papers, Padua, Italy.
[34] Magdy, W., Lopez, P., & Jones, G. J. F. (2011). Simple vs. sophisticated approaches for patent priorart search.
Proceedings of Advances in Information Retrieval 33rd European Conference on IR Research, ECIR 2011 (pp.
725-728). Dublin, Ireland.
[35] Xu, J., & Croft, W. B. (1996). Query expansion using local and global document analysis. Proceedings of the 19th Annual International ACM SIGIR Conference on Research and Development in Information Retrieval,
SIGIR’96, Zurich, Switzerland (Special Issue of the SIGIR Forum) (pp. 4-11).
[36] Koehn, P., Hoang, H., Birch, A., Callison-Burch, C., Federico, M., Bertoldi, N., & Cowan, B. (2007). Moses: Open source toolkit for statistical machine translation. Proceedings of the 45th Annual Meeting of the Association
for Computational Linguistics, Prague, Czech Republic, 2007.
[37] Hiemstra, D., Robertson, S. E., & Zaragoza, H. (2004). Parsimonious language models for information retrieval. Proceedings of the 27th Annual International ACM SIGIR Conference on Research and Development
in Information Retrieval, Sheffield, SIGIR 2004 (pp. 178-185). UK.
[38] Park, S., Lee, S. J., & Jun, S. (2016). Patent big data analysis using fuzzy learning. International Journal of
[39] Choi, J. H., & Jun, S. (2016). Big data smoothing and outlier removal for patent big data analysis. Korean
Institute of Electronics Engineers,21.
[40] Li, P., Lu, J., & Xin, Y. (2014). The information analysis and strategy research of big data technology development based on patents. Journal of Intelligence.
[41] Rajaraman, A., & Ullman, J. D. (2012). Mining of Massive Datasets. Cambridge University Press.
[42] Liu, J., Shang, J., Wang, C., Ren, X., & Han, J. (2015). Mining quality phrases from massive text corpora.
Proceedings of the 2015 ACM SIGMOD International Conference on Management of Data (pp. 1729-1744).
Melbourne, Victoria, Australia.
[43] Shang, J., Liu, J., Jiang, M., Ren, X., Voss, C. R., & Han, J. (2017). Automated phrase mining from massive text corpora. IEEE Transactions on Knowledge and Data Engineering, vol. abs/1702.04457.
[44] Frantzi, K. T., Ananiadou, S., & Mima, H. (2000). Recognition of multi-word terms: The c-value/nc-value method. Int. J. on Digital Libraries, 3(2), 115-130.
[45] Liu, G., Liu, Y., & Zhang, C. (2017). Factor allocation, economic growth and unbalanced regional development in china. World Economy, 4.
Zongbao Yang was born in Anhui province, received his B.S. degree from Guangdong Medical University, Dongguan, China, in 2016. He is currently perusing the M.S. degree in Guangzhou University, Guangzhou, China. His research interests include data mining, machine learning, social network and big scholar data. He is a member of China Computer Federation (CCF).
Shaohong Zhang is an associate professor in the Department of Computer Science at Guangzhou University. He was a postdoctoral fellow in the Department of Computer Science, City University of Hong Kong. He received the Ph.D degree from Department of Computer Science, City University of Hong Kong. His research interests include pattern recognition, data mining, and bioinformatics.
Liu Jianyu was born in Guangdong Province, received his B.S. degree from Zhongshan University of Zhongshan University of Electronic Science and Technology, China in 2017. His currently pursuing M.S. degree in Guangzhou University, Guangzhou, China. His research interests include data mining, machine learning, natural language processing, and deep learning.