Abstract
Indian households have plethora of avenues to save and invest. The options range from the safest investment avenues such as Post Office small savings schemes, Provident Funds to risky avenues such as Mutual Funds, Stocks in case of financial investments. In case of non-financial investment avenues they park their money in Real Estate and Gold. When we look in to the savings and investment patterns of Indian households the major chunk of the money is put in the safest investment options mentioned above and the amount of money invested in risky assets such as mutual fund and stocks are very less. One of the many reasons is the risk involved in such investments and the other is the doubt about the ability of the options to provide better returns than the safest options available. Those who are ready to take some risk might first try mutual funds before taking part in the capital market by investing in stocks directly. Once, they feel that the active fund managers are giving better returns and they beat passive funds performance, they could realise the importance of investing in risky assets such as active funds. Thus the study made an attempt to see whether the active fund managers are creating wealth to the subscribers of the scheme, by selecting 6 Equity Linked Savings Scheme (ELSS) and found that on an average they were not able to create wealth. However, the study also found one or two manager(s) among them creates wealth. Thus, it calls for the investors to identify the fund managers who could create wealth and put their money in their schemes to grow their investments to fulfil their objectives.
Keywords: Alpha, Risky Investments, Active funds, Wealth Creators.
Introduction
Indian investors have different investment avenues to park their surplus. Each and every investment alternative differs from the other option in terms of risk and return. Households, who prefer to be on the safer side, park their surplus in safe investment options like Bank Fixed Deposits, Provident Funds, and Insurance etc. On the other extreme investors who are ready to take risk, put their money directly in the stock market with the expectation of getting better returns. However, there are investors who are not ready to take the risk of direct investment in the capital market, but do take relatively less risk by investing their money in mutual funds to create wealth. Studies related to the ability of the fund managers in creating over and above the risk adjusted return are mixed. Hence, this study made an attempt to see whether the Indian fund managers created return above the return commensurate with
* Associate Professor, Symbiosis Institute of Business Management, Bengaluru, a constituent of Symbiosis International University, Pune. E-mail : [email protected]
Do Indian Active Fund Managers Wealth Creators?
the risk taken by them in their investment. In other words, whether they create extra wealth or Alpha by considering six Equity Linked Saving Schemes which exist for more than 10 years and found that, in general, they were not able to create extra wealth or Alpha with the exception of one fund - HDFC Tax Saver. Thus, the study found that by merely opting for any active funds they could not create wealth but they have to select the active fund managers among the plethora of fund managers existing in the investment arena who create wealth to enhance their wealth.
Returns from the bank deposits are not what they used to be and now in fact they offer negative real return to the investors. Company bonds and deposits today also offer the same kind of returns. Even those old faithfuls, small savings schemes, are losing sheen, with the government steadily aligning their returns to market rates and phasing out tax breaks. Although they still offer safe, stable returns, they are no longer the potent wealth-creation tools one could count on to comfortably see oneself through a lifetime. So, where do the investors go? if the investors have no time and they believe stock picking is only for the financially savvy. Yet, the growth that equity offers tempts them to investment in the capital market, they could reconcile by buying an index fund-a mutual fund that invests exclusively in the shares of companies that comprise the stock market indices. In India, we have two such widely tracked indices in the country: the Bombay Stock Exchange's (BSE) Sensex comprising 30 stocks and the National Stock Exchange's (NSE) Nifty comprising 50 stocks apart from number of other indices. The advantage of investing in such indices is that their underlying stocks are of companies with large market capitalisation and high investor interest.
An index fund used to be the industry standard for those who liked index investing. Founded by John Bogle, founder and retired CEO of the Vanguard Group of the US, index investing was quite the rage in a maturing US market that was disenchanted with the inconsistent performance of managed funds. Index investing took the stress out of stock market investing. In developed market like US and UK index funds have provided similar returns of active funds at reduced costs. Studies have proved that active fund managers were not able to beat the market. However, some experts are the view that in emerging markets, fund managers could beat the market. This means, investors could get a better return by investing in actively managed mutual funds than index funds which mimic a benchmark index, thus enhance their wealth. Hence, the present study aims to know whether the fund managers in India create wealth to their investors by beating the market and if so, are they doing it consistently.
Jensen (1967) analysed performance of 115 mutual fund and found that these mutual funds were on average not able to outperform a buy-the-market-and-hold policy, but also that there is very little evidence that any individual fund was able to do significantly better than that which we expected from mere random chance.
not properly diversified. Further, in terms of Fama's measure, he did not find selectivity ability of the fund manager.
Amitab Gupta (2001) in his study, evaluated the selected schemes with respect to the broad based BSE National Index to find out whether the schemes were able to beat the market. It also examined whether the returns were commensurate with the risk undertaken by the fund managers. It used three risk adjusted performance. The study also tested the market timing abilities of the fund managers. The results indicate that 38 schemes (52%) earned higher returns in comparison to the market return while the remaining 35 schemes (48%) generated lower returns than that of the market. The results pertaining to market timing abilities of fund managers in terms of both the two models, Treynor and Mazuy and Henriksson and Merton do not lend support to the hypothesis that the India fund managers are able to time the market correctly.
M S Turan, Dr. B S Bodla and Sh. Sushil Kumar Mehta (2001) analyzed the performance of 54 listed schemes of mutual funds on the basis of weekly data on NAVs. For this purpose, besides risk and return analysis, the risk adjusted performance measures have been employed. The study reveals that a considerably low level of risk is associated with the selected schemes, irrespective of the sector concerned.
Biswadeep Mishra (2002) the research paper attempts to evaluate the timing and selectivity skills of mutual funds. It was concluded that the selected mutual fund schemes had no timing ability, even though at individual level some of the schemes had timing skills. The generalized varying parameter (GVP) estimates also revealed that the systematic risk of Indian mutual funds did not remain stable over time.
Anand, S. and Murugaiah, V. (2006) using Fama's methodolgy examined the performance of 113 selected schemes of 25 fund houses for the period April 1999 to March 2003. They found that the mutual funds were not able to compensate the investor for the additional risk that they have taken by investing in the mutual funds.
Cremers & Petajisto (2009) found that on average actively managed fund has underperformed its benchmark index. However, they also found that the performance of the fund depend on the degree and the type of active management. In their conclusion, they suggest to pay attention to measure of active management-active stock picking to the mutual fund investors.
Hence, the objective of the study is to see whether Indian Fund managers create wealth to their investors by beating the performance of the Market?
Values (NAV's) of the 6 Equity Linked Savings Schemes since inception are derived from the concerned AMC websites. Thus, the monthly data from 2nd April 1996 to 1st Mar 2012 were used for the study. Thus a total of 144 months to 192 months data were used for testing whether the fund managers delivered more than its benchmark or not.
The hypothesis the authors are interested to test is given below.
Null Hypothesis: Indian Fund Managers cannot beat the performance of the market to create wealth to their investors.
Alternate Hypothesis: Indian Fund Managers can beat the performance of the market to create wealth to their investors.
Data Analysis: The monthly log returns for the six funds selected for the study were calculated. One to three year deposit rate of Commercial Bank for the concerned period is considered as risk-free rate. Three years rolling excess return of portfolio over the risk-free return is regressed against the three year rolling excess return of the relevant benchmark over the risk-free return to see whether the fund manager's beat the market (it's Benchmark), in other words, they delivered excess return (Alpha).
Results and interpretation: The study found that the Fund Managers of the funds HDFC Tax Saver generated alpha 63 times out of 191 times of 3 years duration. In case of Franklin Templeton India Tax shield, UTI Tax Savings Plan, Birla Sun life Tax Relief 96, SBI Mangnum tax gain they were 14 out of 157, 11 out of 147, 8 out of 148 and 2 out of 184 respectively. However, the fund manager of ICICI Prudential Tax Plan was not able to beat the market at least once since their inception.
Dependent Variable: ERPORT Method: Least Squares Sample: 5 41
Included observations: 37
Variable Coefficient Std. Error t-Statistic Prob.
C 1.922255 0.942099 2.040397 0.0489 ERBENCH 0.762933 0.118322 6.447931 0.0000
R-squared 0.542937 Mean dependent var 1.570083 Adjusted R-squared 0.529878 S.D. dependent var 8.343738 S.E. of regression 5.720923 Akaike info criterion 6.378676 Sum squared resid 1145.514 Schwarz criterion 6.465752 Log likelihood -116.0055 Hannan-Quinn criter. 6.409374 F-statistic 41.57581 Durbin-Watson stat 2.122864 Prob(F-statistic) 0.000000
Thus the Null hypothesis that the fund manager can't beat the market is accepted for all the fund managers except HDFC Tax Saver.
The result of Eviews for the FT Tax Saver for one 3 year period is shown in Fig 1.
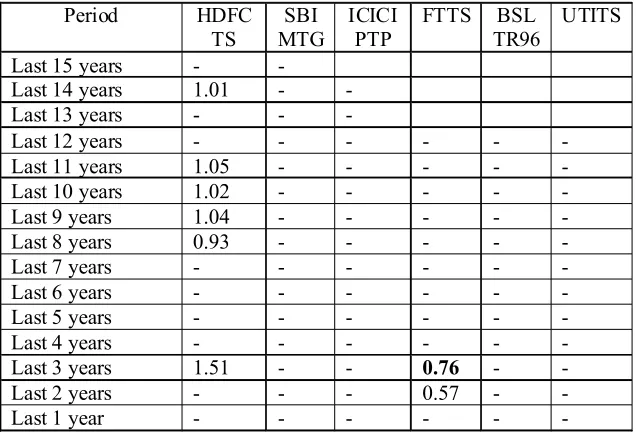
The performance of the above mentioned fund managers are also evaluated since inception on annual basis. The data used for performance evaluation ranges from 12 years to 15 years depending up on the inception of the various schemes considered for this study. The result with respect to generation of ALPHA for the above mentioned schemes is given in Table 1.
Table 1: Details of Alpha Generated by different ELSS Schemes
Period HDFC TS
SBI MTG
ICICI PTP
FTTS BSL TR96
UTITS
Last 15 years - -
Last 14 years 1.01 - - Last 13 years - - -
Last 12 years - - - -
Last 11 years 1.05 - - - - -
Last 10 years 1.02 - - - - -
Last 9 years 1.04 - - - - -
Last 8 years 0.93 - - - - -
Last 7 years - - - -
Last 6 years - - - -
Last 5 years - - - -
Last 4 years - - - -
Last 3 years 1.51 - - 0.76 - -
Last 2 years - - - 0.57 - -
Last 1 year - - - -
From the above table, one can infer that the fund manager of HDFC Tax Saver generated alpha 6 times out of 15 years. In case of Franklin Templeton India Tax Shield the fund manager generated alpha 2 times out of 12 years. However, other fund managers have not generated alpha. Thus, one can conclude that on an average the fund managers are not able to create wealth to their investors by beating the market. At the same time, one can also find one or two fund managers who consistently beat the performance of the market.
Limitations: The study is restricted to only ELSS Mutual Fund Schemes having a minimum of 10 years existence among the top 10 AMCs. Hence, one should not generalise that this result represents the Indian Fund Managers Universe.
Conclusion
Mishra (2002) and Cremers & Petajisto (2009) in their study. Thus, investors have to look for active fund managers among the plethora of fund managers who beat the performance of the market to create wealth.
References
1. Amitab Gupta "Mutual Funds in India: A Study of Investment Management" Finance India Vol.XV No.2 (June 2001) pp 631-637
2. Anand, S. and murugaiah, V. (2006). Analysis of Components of Investment Performance - An Empirical Study of Mutual Funds in India. 10th Indian Institute of Capital Markets Conference. ICFAI: Hyderabad.
3. Biswadeep Mishra "Selectivity and Timing Skills of Mutual Funds in India: An Empirical Analysis" The ICFAI Journal of Applied Finance, Volume 8, No 5, (September 2002) pp 05-16
4. Jensen, Michael C., The Performance of Mutual Funds in the Period 1945-1964. Journal of Finance, Vol.23, No.2, pp.389-416, 1967. Available at SSRN: http://ssrn.com/abstract=244153 or doi:10.2139/ ssrn.244153 Browsed on 11th October 2010
5. M Jayadev "Mutual Fund Performance: An Analysis of Monthly Returns" Finance India Vol.X, No.1, (March 1996), pp 73-84
7. Prof. M.S. Turan, Dr.B.S.Bodla and Sh. Sushil Kumar Mehta "Performance Evaluation of Listed Schemes of Mutual Funds" Management Reserachers, Vol. VIII, No. 1 & 2 (July-December 2001) pp38-66
8. RBI Handbook of Statistics on Indian Economy 2009-2010, www.rbi.org browsed on 8th Jan 2011.
9. HDFC Mutual Fund, www.hdfcmutualfund.com, browsed on Jan 20 2012
10. SBI Mutual Fund www.sbimf.com, browsed on Jan 20 2012
11. ICICI Mutual Fund www.icicipruamc.com browsed on Jan 20 2012
12. Franklin Templeton Mutual Fund www.franklintempletonindia.com browsed on Jan 20 2012
13. Birla sun life Mutual Fund mutualfund.birlasunlife.com browsed on Jan 20 2012