An Improved Back Propagation Neural Network
Model and Its Application
Fang Li
College of Computer Science, Chongqing University, Chongqing 400044, China Chongqing City Management College, Chongqing 400031, China
Changze Wu*
College of Computer Science, Chongqing University, Chongqing, China, [email protected]
Kaigui Wu
College of Computer Science, Chongqing University, Chongqing, China, [email protected]
Jie Xu
College of Computer Science, University of Leeds, Leeds, UK, [email protected]
Abstrac—t-Stroke is one of the most serious disease, and the incidence rate of stroke is confirmed to be related to environmental factors including temperature, pressure and humidity .In order to obtain the relationship between the incidence rate and environmental factors , we research on local daily meteorological data and stroke disease cases from January 2008 to December 2012, which is provided by the administrative department of public health and medical institutions statistics in China, then build the improved BPNN(Back propagation neural network) model to carry out data analysis and processing, obtain the weight matrix between them. It can be seen that the relationship between incidence rate and pressure is the highest degree from the value of weight matrix, and pressure is positive correlation with the incidence rate. The relationship between the temperature and incidence rate is second, and they are negative correlation. The incidence between average relative humidity and correlation is quite small.
The results show that the model can be used to predict the future stroke incidence rate under various meteorological conditions, and it can play a certain role in making disease knowledge popular and providing a reference to potential patients.
Index Terms—Stroke, BP, neural network, incidence rate, meteorological conditions
I.
INTRODUCTIONThe relationship between the incidence rates of stoke and environmental factors (pressure, temperature, humid-ity) have recently emerged as one of promising research areas for safety of the patients and the potential patients. In this paper we study the relationship; it means that we should get the influence coefficient of correlation (weight) between environmental factors and incidence rates of
stroke [1]. The rationality of correlation coefficient is directly related to the accuracy of the model. Because this is a complex relationship, with the passage of time and space, the weights may be changed .How to determine the weights is a key to improve the performance [2][3]. The BPNN is a forward multi-layer network, which bases on BP algorithm, and the topological structure as a layered feed-forward network, is composed of the input layer, hidden layer and output layer[4] . In essence, the BPNN algorithm makes the input and output of a set of samples into a nonlinear optimization problem with using the gra-dient descent algorithm optimization technique, which uses the iterative solution to get the right value [5].
We use momentum adaptive learning rate adjustment algorithm to improve the BPNN model in this paper. With our intellectual contributions, we improve the per-formance of BPNN algorithm. Through theoretical analy-sis and extensive evaluation, it is shown that our design provides an efficient way to outperform the existing algo-rithm.
II. MODEL IMPROVEMENT
A. Notations
m: the input layer node number; n: the output layer node number; s: the hidden layer node number;
xj: the input of j node in input layer, j =1,2,3;
wij: the weight between i node in hidden layer and j node in input layer;
θi: the threshold of i node in hidden layer; f(x): the excitation function in hidden layer;
ak: the threshold of k node in output layer;
Ψ(x): the excitation function in output layer; Ok: the output of knode in output layer.
B. The BPNN Flow
Figure 1. BPNN flow
C.Forward Propagation Process of Signal
The input of i node in hidden layer [6]:
net =i M w x +ij j θi
j=1∑ (1)
The output of i node in hidden layer:
( )
My =i φ net =i φ w x +ij j θi
j=1∑
⎛
⎞
⎜
⎟
⎝
⎠
(2) The input of k node in output layer:( )
1 1 1
q q q
x net w y a w w j i a
ki ki
k=i=∑ i+ k=i∑= ϕ i∑= ki + +θ k (3)
The output of k node in output layer :
( )
(
q)
q Ma =k ψ netk =ψ w y +aki i k =ψ wkiφ w x +ij j iφ +ak i=1∑ i=1∑ j=1∑
⎛ ⎛ ⎞ ⎞
⎜ ⎜⎝ ⎟⎠ ⎟
⎝ ⎠
(4)
D. Back Propagation Process of Error
For the two type of criterion function of every sample p[7]:
E =p 1 L
(
T -ok k)
22 k=1∑ (5)
The total error criterion functions of P training sam-ples:
(
)
2
p L
1 p p
E= T -Ok k
2 P=1k=1∑ ∑ (6) The weight adjustment formula for output layer:
k k k
ki
ki k ki k k ki
net o net
E E E
Δw =-η =-η =-η
w net w o net w
∂ ∂ ∂
∂ ∂ ∂
∂ ∂ ∂ ∂ ∂ ∂ (7)
The threshold adjustment formula for output layer:
k k k
net net
E E
-η -η -η
net a a net a
k k k
k
k k k
o E a a ∂ ∂ ∂ ∂ ∂ ∂ Δ = = =
∂ ∂ ∂ ∂ ∂ ∂ (8)
The weight adjustment formula for hidden layer:
net y net
E E i E i i
Δw =-ij η =-η =-η
netk net wi ij y net wi i ij
∂ ∂ ∂
∂ ∂ ∂
∂ ∂ ∂ ∂ ∂ ∂
(9) The threshold adjustment formula for hidden layer:
net y net
E E i E i i
Δw =-ij η =-η =-η
netk neti wij yi neti wij
∂ ∂ ∂
∂ ∂ ∂
∂ ∂ ∂ ∂ ∂ ∂
(10)
E. The Improved BPNN Algorithm
The BP algorithm is simple, easy, small amount of calculation, and has the parallel advantages, so it is one of the largest and most mature training algorithms for net-work training at present. The essence of the algorithm is to solve the minimum value of the error function. Be-cause it exists following problem by using the method of steepest descent in nonlinear programming [7]:
(1) low learning efficiency, slow convergence; (2) falling into local minima easily.
In order to make the model more accurate, we use momentum adaptive learning rate adjustment algorithm. The weights and threshold adjustment formula with addi-tional momentum factor [8]:
Δw (k+1)=(1-mc)ij ηδip +mcj Δw (k)ij (11)
Δb (k+1)=(1-mc)i ηδi+mcΔb (k) (12) i
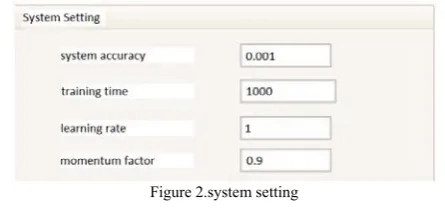
In which, k is the training times, we take 10000, mc is the momentum factor, we take 0.9. At the same time it is not easy to select appropriate learning rate for a particular problem. To solve the problem, it is natural to adjust the learning rate automatically in training process. The adap-tive learning rate adjustment formula is as follows [3][4]:
1.05η(k) η(k+1)= 0.7η(k)
η(k) ⎧ ⎪ ⎨ ⎪ ⎩ E(k+1)<E(k) E(k+1)>1.04E(k) other
,
(13)E(k) is sum of squared errors for the k step. The selec-tion of the initial learning rate can be opselec-tional, we take 1.0[9].
Figure 2.system setting
F. Other Network Parameters
(1) The initial weight values should not be equal to a set of values, we take-1~+1[10];
(2)The excitation function of network, we take sigmoid function;
(3) The training function of network, we take trainr function;
G. The Network Environment/platform
Windows XP, VS2010, C++
H. Model Solution
In this paper the pressure, temperature, humidity, and the corresponding incidence rate between 2009 and 2011 are the training samples. Train them to solve the weights from input layer to the hidden layer and from the hidden layer to the output layer. Then use the resulting weight and the pressure, temperature, humidity data in 2010 to predict the actual data. We analyze the difference be-tween the forecast value (forecast incidence) and the ac-tual incidence to prove that the model is correct. The process is as follows:
(1)Training samples input
The pressure, temperature, humidity during the period 2009-2011 are the training samples and input layer nodes, which namely input layer node 3, see the incidence rate as the output layer nodes, which namely the input node 1. Meanwhile train samples of the corresponding data. In this paper the dynamic functions of hidden layer nodes is[11]: s = 4,
And s= 0.43mn+0.12n +2.54m+0.77n+0.35 +0.512 , samples number is:
3*12*3=108, Matrix size of the input layer is108*3, ma-trix size of the input layer to the hidden layer is 3*4=12, matrix size of the hidden layer to the output layer is 4*1=4, the matrix of the output layer is 36*1.
TABLE 1.
RELATIONSHIP OF CLIMATE AVERAGE AND INCIDENCE
2008
tempera-ture pressure humidity
Disease incidence
early January 1028.250 4.010 72.800 2.900 middle
Janu-ary 1028.320 4.660 80.800 2.100
late January 1028.118 4.809 66.727 2.000 Early
Feb-ruary 1023.290 8.080 65.500 2.100 middle
February 1018.410 8.490 71.300 1.800 Late
Feb-ruary 1020.375 9.825 76.750 1.700 Early March 1020.460 9.620 70.400 2.800
Middle
March 1021.940 8.360 68.900 1.800 Late March 1012.973 16.245 68.636 2.500 Early April 1021.150 12.780 60.000 3.000 Middle April 1013.400 15.610 64.500 2.700 Late April 1015.080 17.720 63.200 2.500 Early May 1010.150 20.770 62.700 2.900 Middle May 1009.560 22.690 54.400 2.700 Late May 1005.718 24.227 67.636 2.700 Early June 1007.570 22.410 76.900 2.800 Middle June 1007.440 22.720 77.500 2.700 Late June 1003.500 28.920 72.100 2.400 Early July 1001.370 27.950 79.100 1.900 Middle July 1000.650 28.680 75.100 2.700 Late July 1006.536 31.355 66.455 2.500 Early August 1004.300 30.660 65.700 3.100
Middle
Au-gust 1002.700 28.780 71.600 2.900 Late August 1007.527 29.255 69.909 3.200
Early
Sep-tember 1008.530 24.060 77.000 3.400 Middle
Sep-tember 1008.310 24.170 82.100 2.900 Late Sep- 1014.510 24.660 69.100 3.000
tember Early
Octo-ber 1013.540 23.400 76.900 3.700 Middle
Oc-tober 1022.910 17.490 68.900 3.600 Late October 1020.282 17.327 69.364 3.300
Early
No-vember 1023.480 13.860 58.000 3.200 Middle
No-vember 1023.940 12.690 69.100 3.000 Late
No-vember 1024.940 11.170 59.000 3.000 Early
De-cember 1026.140 8.450 77.500 3.600 Middle
De-cember 1021.610 7.260 75.400 3.000 Late
De-cember 1022.700 8.055 52.000 3.900
The data format is as follows
:
TABLE 2 .DATA INPUT FORMAT
Input layer Output
layer
Data Pressure value
temperature value
humidity value
incidence rate
(2) Samples training
When all the samples are trained over, and reach the precision requirement, we can get weight matrix from input layer to hidden layer and from hidden layer to out-put layer.
In which, the weight matrix from input layer to hidden layer isX3 4× :
3 4
-0.0062 0.1695 0.4637 0.1864 X = -0.4296 0.0796 -0.1296 0.1365
0.0245 -0.1191 -0.2651 -0.4984 ×
⎡
⎤
⎢
⎥
⎢
⎥
⎣
⎦
The weight matrix from hidden layer to output layer is
4 1
Y× :
4 1
-0.1485 0.1503 Y =
0.4346 -0.1893 ×
⎡
⎤
⎢
⎥
⎢
⎥
⎢
⎥
⎢
⎥
⎣
⎦
k X jl l
w =j m k ,j=1,2,3;l=1,2,3,4. | X |il
i=1 l=1
∑
∑ ∑
(14)
Then use the formula (14) to obtain the weight matrix
[
]
w= 0.5224,-0.3899,0.0877 of pressure, temperature, humidity [12,13]. It can be seen that there is a specific positive and high degree correlation between pressure and incidence rate of stoke, there is a negative and lower cor-relation between temperature and incidence rate of stoke,the incidence rate of stoke is little relevance to hu-midity.
(3)Samples Prediction and Effect
sam-ple, pressure, temperature, humidity as input nodes,use the weights matrix gotten above, then get the rate value of the corresponding stage,at last compare with the real val-ue, get the error curve.
Figure 3. Error curve
It can be seen from the figure 3, the last system error stabilized stay between 6-8% with the increase of training times.
From the discussion above, according to the estab-lished network, we can predict the incidence rate of stroke was 3 in 2010 early January, and the relative errors of the real value of 3.2 is about 6%, predict the incidence rate was 2.7 in the mid January, and the relative errors of the real value o of 2.9 is about 7%. Sequentially compar-ing relative errors stay between 6% ~8%, the error is very small, so we can say our established model is accurate and reasonable. Using this model, we can forecast the incidence rate of stroke in future; if we know the envi-ronmental factors (pressure, temperature, humidity).Thus we can use the model to prevent the disease..
Figure 4. data comparison
I. Mode evaluation and promotion
This model can not only accurately reflect the rela-tionship between incidence rate and pressure, temperature, humidity, but also predict the future stroke incidence rate under various meteorological conditions. It can play a certain role in making disease knowledge popular as well as in transformation of health status.
ACKNOWLEDGMENTS
This work is supported by the Major Research Project of the National Natural Science Foundation of China un-der Grant No.90818028, Natural Science Foundation Project of CQ CSTC: 2011BB2064.
REFERENCES
[1] Metoki Norifumi1; Sato Yoshihiro2, Satoh Kei1,Okumura Ken3,Iwamoto Jun,“Muscular Atrophy in the Hemiplegic Thigh in Patients After Stroke ”, American Journal of Physical Medicine and Rehabilitation, v 82, n 11, p 862-865, 2003.
[2] Huifang Kong, Guoqing Ren, Jizhu He, Benxian Xiao, “The Application of Fuzzy Neural Network in Fault Self-diagnosis System of Automatic Transmission”, Jour-nal of Software, Vol 6, No 2 (2011), 209-216, Feb 2011. [3] Wu Cairong, Huang Huaxing, “Evaluation and research on
sports psychology based on BP nerual network model”, Advances in Information Sciences and Service Sciences, pp. 355-363, 2012.
[4] Jiang HuiYu,Dong Min,Yang Feng ,“Application of BP nerual network into prediction of nitrobenzene compound in toxicity”,2nd International Conference on Genetic and Evolutionary Computing, WGEC 2008, p 170-173, 2008. [5] Fan Lin, Wenhua Zeng, Jianbing Xiahou, Yi Jiang,
"Opti-mizing for Large Time Delay Systems by BP Neural Net-work and Evolutionary Algorithm Improving",Journal of Software, Vol 6, No 10 (2011), 2050-2055, Oct 2011. [6] Yuan Zhou, Qiang Zhu, Huifang Huang, “prediction of
Acute Hypotensive Episode in ICU Using Chebyshev Neural Network”, Journal of Software, Vol 8, No 8 (2013), 1923-1931, Aug 2013.
[7] Lei Ding, Xue Gou, "Design of White Mice Brain Electri-cal Signal Remote Acquisition and Processing System Based on PSoC and LabVIEW", IJACT, Vol. 5, No. 1, pp. 205 ~ 214, 2013.
[8] Shah, Manthan ,Gaikwad, Vijay, Lokhande Shashikant, Borhade Sanket, “Fault identification for I.C. engines using artificial nerual network”,Proceedings of 2011 Inter-national Conference on Process Automation, Control and Computing, PACC 2011.
[9] Alginahi Y, Sid-Ahmed M.A., Ahmadi M. “Local thresholding of composite documents using multi-layer perceptron nerual network”, Midwest Symposium on Cir-cuits and Systems, v 1, p I209-I212, 2004.
[10]Saravanan P,Nagarajan S, “An adaptive learning approach for tracking data using visual and textual features”, Pro-ceedings of the 2nd International Conference on Trendz in Information Sciences and Computing, TISC-2010, p 192-196, 2010 .
[11]RajaRajan A, “Brain disorder detection using artificial neural network”,3rd International Conference on Electron-ics Computer Technology, v 4, p 268-272, 2011.
[12]Dongchao Ma, Zhibo Zhang, Yuanyuan Jia, "A Software Components Automated Testing System on Reconfigura-ble Routing Platform", JCIT: Journal of Convergence In-formation Technology, Vol. 8, No. 1, pp. 69 ~ 76, 2013. [13]Li Jing-Rui,Wang, Gang Zhou, YunJin Gong, Yun-Fei,
Fang Li Doctor, college of Computer Science in Chongqing University, research on information security, software evolution, the Internet of things technology, medical information and so on.
Changze Wu Doctor,lecturer of college of Computer Science in Chongqing University, research on information security, software evolution, the Internet of things technology, medical information and so on.