Investigation of Solidification Affecting
Parameters of Sand Casting using ANOVA
Y.V. Gore C.M. Choudhari
PG Student (M. Tech) Professor
Department of Production Engineering Fr. C. Rodrigues Institute of Technology, Vashi, Navi Mumbai, India
V.J.T.I. Mumbai, India
B.E. Narkhede
Professor
Department of Production Engineering V.J.T.I., Mumbai, India
Abstract
Solidification of molten metal after being poured into a mould cavity is an important phenomenon in casting and is of great interest to physicists, metallurgist, casting engineers and software developers. A molten metal is poured at a very high temperature into refractory material sand at room temperature. During the solidification of casting in a mould, the heat transfer between casting and sand mould plays a vital role. It is a nonlinear transient phenomenon, posing a challenge in terms of modeling and analysis. It has been identified that the solidification process mainly governed by three parameters such as conductivity of sand, pouring temperature of molten metal and initial temperature of sand. Thus it becomes necessary to identify the most prominent parameter affecting the solidification out of the above mentioned. Experiments were conducted by simulation using ANSYS software to study the effect of these parameters on the heat transfer during solidification of casting. Thus experiments were planned using the strategy of design of experiments (DOE). Levels and ranges of input parameters were selected and then experiments were conducted. The results obtained with permutation and combinations of these parameters were analyzed by using Analysis of Variance (ANOVA), a statistical method to investigate the critical parameter affecting the heat transfer during the solidification process and their contribution.
Keywords: ANOVA, Casting, DOE, Hot Spot, Solidification, Thermal Analysis
________________________________________________________________________________________________________
I.
I
NTRODUCTIONCasting is an age old production technique of manufacturing of the component to its near net shape. Here, cavities are formed by a pattern into a porous and refractive material, usually sand, and then liquid metal is poured into the cavity so that it takes up the shape of the cavity, thus forming the required metal product. Traditional casting trade has a long history and until now it has been the basis of the entire mechanical industry. Though it is a 6000 young process, it faces several problems, such as difficulty in quality control, low production, energy efficiency, material consumption reduction and the impact of environmental protection. One of the reasons is its complexity [1].
Solidification of molten metal after being poured into a mould cavity is an important phase in casting process and greatly influenced by product quality and yield. One of the major objectives of solidification analysis is to predict the presence of hot spot, i.e. a location in casting that solidifies last and probable location of shrinkage cavity. Solidification in casting is basically phase change of molten metal by the transfer of heat form cooling metal to the mould [2].
Numerical method for solidification simulation has received considerable attention from researchers in the past two decades. The casting shape is broken down into a number of simple elements and the unsteady state heat conduction equation is applied to them over a number of time steps in order to obtain the temperature of different nodes. FEM, FDM and BEM methods have been used [3]. Simulation of solidification process enables visualization of the process of freezing in a casting and identification of hot spot. Solidification of casting is a non- linear transient phenomenon posing challenge in terms of modeling and simulation. The study of solidification plays an important role in casting, to avoid the defects like shrinkage. In order to achieve this, normally riser is used for thick castings.
II.
P
ROBLEM DEFINITIONThe main objective of this paper is to study the effect of these parameters on the heat transfer during solidification of casting to investigate the critical parameter affecting the heat transfer during the solidification process and their contribution. An analysis plays an important role in order to predict the results and improve the performance of the system at design stage. In casting to avoid the defects due to formation of hot spot, analysis helps to adjustment of parameter plays a vital role.
III.
S
IMULATIONTransient Thermal Analysis of Casting is carried out using ANSYS software [2, 7]. Steps Involved in simulation are discussed here.
Step 1: Model Generation: A.
Axisymmetric shape of square casting has been assumed. This can be idealized as the 2-D analysis of a slice with unit thickness. Fig. 1 shows a cast part enclosed in a sand mould. The two areas can be modeled in ANSYS itself or can be imported from other modeling softwares like PRO-E and CATIA. Here they are modeled in ANSYS itself. Two materials have been considered, one of the mould and the other of the casting as sand and Aluminium, respectively.
Fig. 1: Two Dimensional Model of Mould with Cast Part Inside
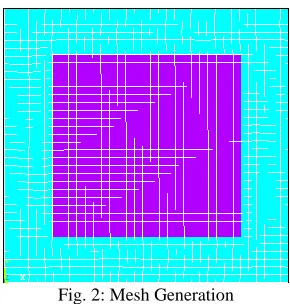
Fig. 2: Mesh Generation
Step 2: Define Material Properties: B.
Sand has constant properties irrespective of the temperature, while Aluminium properties are temperature dependent. Table 1
Temperature independent properties of sand [8] Conductivity (Range) 0.4 to 0.8 W/m K Specific heat 1172.304 J/kg K
Density 1495 kg/m3
Table 2
Temperature dependent properties of Aluminium [8] Temperature Conductivity Enthalpy
273 K 234.43 W/m K 0 J/m3
Step 3: Defining the Element: C.
For this study, PLANE 55 was used as the linear element. PLANE55 can be used as a plane element or as an axisymmetric ring element with a 2-D thermal conduction capability. The element has four nodes with a single degree of freedom, temperature, at each node.
Step 4: Mesh Generation D.
Fine mesh is generally used to obtain better results. However the overall time of obtaining a solution increases with the reduction of mesh size and it requires more space in memory for calculation.
Step 5: Apply Convective Load and Boundary Conditions for Analysis E.
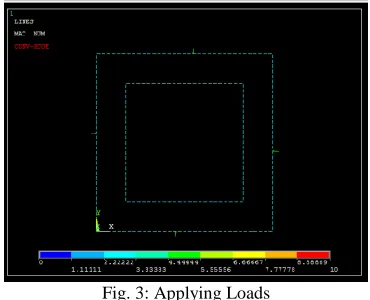
Convective load was applied on the lines of the solid model. These loads applied to the solid modeling entities are automatically transferred to the finite element model during the solution. Heat transfer coefficient applied to the boundary was 10 Wm-2K-1. Temperature at the boundary was room temperature i.e. 300 K.
Fig. 3: Applying Loads
Step 6: Define Initial Condition: F.
The mould is initially at ambient temperature of 300 K and the molten metal is at 1000 K, which is, pouring temperature. The initial conditions for both sand and pouring temperature are varied to obtain the required data for design of experiments.
Fig. 1: Defining Initial Conditions for Metal
Step 7: Post Processing: G.
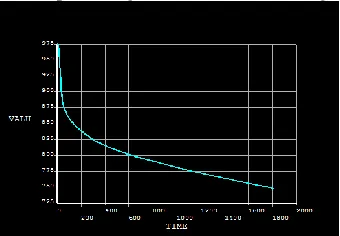
Temperature variation of any node in mould area can be found out with time-history post processing. The results were obtained for 30 minutes of duration. The hot spot temperature is obtained as a nodal temperature.
The temperature values of corresponding node are plotted against time, shown in Figure 6.
Fig. 6: Temperature Plot of Hot Spot
Fig. 7: Temperature Contours
Temperature contour shows colorful image of temperature ranges in part during the solidification. In complex geometry it is useful to identify which part solidifies last so that position of riser location can be decided.
IV.
M
ETHODOLOGYDesign of Experiment: A.
Design of Experiment (DOE) is a technique of defining and investigating all the possible combinations in an experiment involving multiple factors and to identify the best combination. In this, different factors and their levels are identified. DOE is also useful to combine factors at appropriate levels, each within the respective acceptable range to produce the best results and yet exhibit minimum variation around the optimum results. In this study, full factorial method of DOE is used. For a full factorial design, if the numbers of levels are same then the possible design N is given by N=Lm; where L=number of levels for each factor, and m=number of factors.
Input Parameters: B.
Sand conductivity (K), pouring temperature (TP) and sand temperature (TS).
Output Parameters: C.
Temperature of hot spot (TH).
Table 3
Casting Parameters and their Levels
Control factors Symbol Level 1 Level 2 Level 3
Sand conductivity (W/m K) K 0.4 0.6 0.8
Pouring metal temperature (K) TP 975 1000 1025
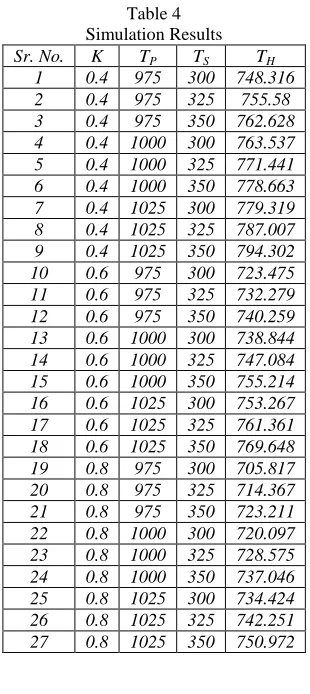
Table 4 Simulation Results
Sr. No. K TP TS TH
1 0.4 975 300 748.316
2 0.4 975 325 755.58
3 0.4 975 350 762.628 4 0.4 1000 300 763.537 5 0.4 1000 325 771.441 6 0.4 1000 350 778.663 7 0.4 1025 300 779.319 8 0.4 1025 325 787.007 9 0.4 1025 350 794.302 10 0.6 975 300 723.475 11 0.6 975 325 732.279 12 0.6 975 350 740.259 13 0.6 1000 300 738.844 14 0.6 1000 325 747.084 15 0.6 1000 350 755.214 16 0.6 1025 300 753.267 17 0.6 1025 325 761.361 18 0.6 1025 350 769.648 19 0.8 975 300 705.817 20 0.8 975 325 714.367 21 0.8 975 350 723.211 22 0.8 1000 300 720.097 23 0.8 1000 325 728.575 24 0.8 1000 350 737.046 25 0.8 1025 300 734.424 26 0.8 1025 325 742.251 27 0.8 1025 350 750.972
V.
A
NOVAThe analysis of variance is the statistical treatment most of the commonly applied to the results of the experiments to deter mine the percentage contribution of each factor. Study of ANOVA table for a given analysis helps to determine which of the factors need to control and which do not.
Table 5 ANOVA Table
Symbol Parameter DOF Sum of square Mean square P (%)
K Conductivity 2 8248.80 4124.40 61.66
TP Pouring temperature 2 3949.32 1974.66 29.52
TS Sand temperature 2 1165.61 582.80 08.71
K× TP Interaction 4 8.29 2.07 0.062
K× TS Interaction 4 4.07 1.02 0.030
TP × TS Interaction 4 0.11 0.03 0.0008
K× TP× TS Error 8 0.49 0.06 0.0172
- Total 26 13376.69 - 100.00
ANOVA results shows that the percentage contribution of sand conductivity is 61.66 %, followed by pouring temperature 29.52 % and sand temperature 08.71 %, in the heat transfer of casting during solidification. Hence sand conductivity is the most significant parameter affecting the solidification of casting, followed by Pouring temperature of metal and Sand initial temperature.
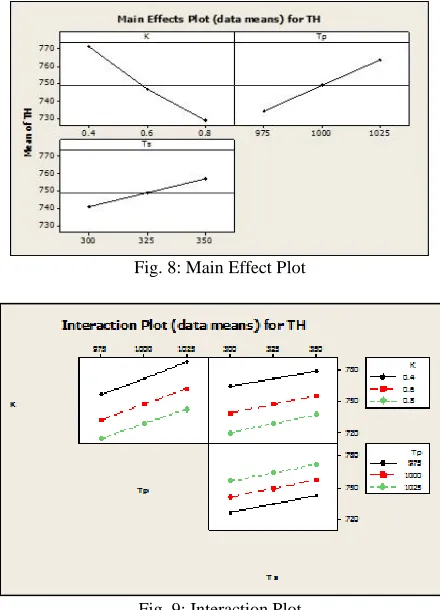
MINITAB software is used to plot Main effect plot and interaction plot.
Main Effect Plot: D.
Shows the effect of variation of range on hot spot temperature. More the slop, greater is the influence of factor on resulting parameter.
Interaction Plot: E.
Shows that there is no significant interaction among the parameters chosen for study. And each factor has its own influence on solidification. This is validated from ANOVA table also.
Fig. 8: Main Effect Plot
Fig. 9: Interaction Plot
VI.
C
ONCLUSION AND FUTURE SCOPEThe application of ANOVA is attempted to find out the significant parameters influencing the solidification of casting. According to the scheme of DOE, the transient thermal analysis using ANSYS software was carried out by changing parameters namely sand conductivity, initial molten metal temperature and sand temperature at three levels. Temperature of hot spot has been found for all experiments arranged using DOE. Results of experiments were analyzed using statistical tool ANOVA. From the results obtained by ANOVA, it was observed that the sand conductivity is the critical parameter which influences most in the solidification followed by pouring temperature and sand temperature. These results are consistent with the basic theory. This approach can be used further to identify the critical parameters and their contribution in heat transfer of various castings, which in turn helps in adjusting the critical system parameter to control the heat transfer during solidification process.
R
EFERENCES[1] C. M. Choudhari, B. E. Narkhede, S. K. Mahajan, , "A hybrid approach for casting process simulation by combining FEM and VEM for defect minimization with experimental validation", 62nd Indian Foundry Congress, Ahemadabad, India. 7-8-9 February, 2014.
[2] C. M. Choudhari, B. E. Narkhede, S. K. Mahajan “Modeling and simulation with experimental validation of temperature distribution during solidification process in Sand casting” International journal of computer applications, Volume 78-No.16, page 23-29, September 2013.
[3] B. Ravi and M. N. Srinivasan, “Casting solidification analysis by modulus vector method,” Int. J. Cast metals Res., 1996.
[4] Rabindra Behera, Kayal S., and Sutradhar G., “Solidification behaviour and detection of Hotspots in Aluminium Alloy castings: Computer Aided Analysis and experimental validation”, International Journal of Applied Engineering Research, Dindigul Volume 1, No 4, page 715-726, 2011.
[5] T. Nandi, R. Behera, S. Kayal, A. Chanda, G.Sutradhar, “Optimization Of Feeder Size Of Aluminium Alloy (LM6) Castings By Using Conventional Method And Computer Simulation Technique”, , International Journal Of Scientific & Engineering Research, Volume 2, Issue 11, page 1-6, Nov. 2011. [6] B. Ravi, “Computer-aided Casting Design and Simulation”, STTP, V.N.I.T. Nagpur, July, 2009
[7] ANSYS 12.0 Tutorial, ANSYS Inc., United States