Experimental Summary:
Very High Energy Cosmic Rays and their Interactions
Karl-Heinz Kampert1,a
1University Wuppertal, Department of Physics
Abstract.The XVII International Symposium on Very High Energy Cosmic Ray Interactions, held in August of 2012 in Berlin, was the first one in the history of the Symposium, where a plethora of high precision LHC data with relevance for cosmic ray physics was presented. This report aims at giving a brief summary of those measurements and it discusses their relevance for observations of high energy cosmic rays. Enormous progress has been made also in air shower observations and in direct measurements of cosmic rays, exhibiting many more structure in the cosmic ray energy spectrum than just a simple power law with a knee and an ankle. At the highest energy, the flux suppression may not be dominated by the GZK-effect but by the limiting energy of a nearby source or source population. New projects and application of new technologies promise further advances also in the near future. We shall discuss the experimental and theoretical progress in the field and its prospects for coming years.
1 Introduction
The Seventeenth International Symposium on Very High Energy Cosmic Ray Interactions has brought together high energy physicists from the domains of collider and fixed target experiments and from cosmic ray observatories. An impressive set of data has been collected since the previ-ous ISVHECRI in both domains and has advanced the field a lot. Accelerator experiments have started to give cru-cial information for the modelling of high energy hadronic interactions relevant for air shower simulations and have helped to reduce systematic uncertainties in reconstructing primary energy and mass from extensive air shower exper-iments. At the same time, cosmic ray experimenters have improved their measurements enabling them to see much more structure in the energy spectrum than just a simple power law distribution. These data come along with much better composition information so that the underlying as-trophysics is starting to be decomposed.
It is the first meeting in this series, where a plethora of new precision data from LHC has become available up to
√
s=8 TeV and for p+p, p+Pb, and Pb+Pb collisions. The discovery of a Higgs-like particle by CMS and ATLAS has been celebrated a lot and was reported extensively in pub-lic media. Congratulations to the two collaborations for this great achievement, also reported about at this meeting. However, low cross section processes, such as the Higgs or top-quark production are of secondary importance for cosmic ray interactions. Instead, the bulk processes
ob-served in minimum bias events with about 1010 times the
Higgs production cross sections are of prime interest, ticularly those leading to very forward (large rapidity)
par-ae-mail: [email protected]
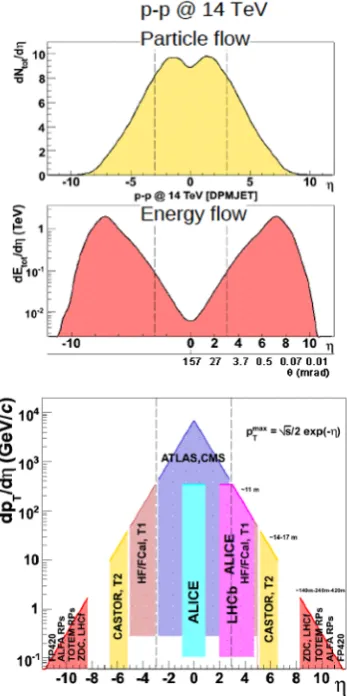
ticle production. This is because, different from the parti-cle flow which peaks at mid-rapidity, most of the beam en-ergy actually is observed close to projectile (and target) ra-pidities and remains mostly unobserved in the beam-pipes. This region of phase space is the one that drives the evo-lution of extensive air showers. It is thus of prime im-portance to extend the acceptance with dedicated detector subcomponents to as close to the beam pipe as possible. Figure 1 presents a compilation of the phase space accep-tances reached in current experiments at LHC.
Besides collider data from LHC and still from HERA, fixed target experiments continue to give valuable infor-mation about hadronic collisions in an energy domain where the majority of hadronic interaction take place dur-ing the development of air showers. Close cooperation and dialog between the communities is now especially timely, and it is gratifying to see the symposium equally well at-tended by high-energy physicists and model builders.
In this summary, we shall start with discussing recent data from accelerator experiments and with their implica-tions for simulaimplica-tions of extensive air showers (EAS), ad-dress the observed deficit of muons in EAS simulations, discuss news from emulsion experiments and then move on to latest results from air shower experiments and high energy neutrino detectors.
2 Accelerator Experiments
2.1 Particle and Energy Flow
Data from accelerator experiments have guided the devel-opment of hadronic interaction models from the early be-ginnings. A major step forward has now been taken with
DOI: 10.1051/
C
Owned by the authors, published by EDP Sciences, 2013
epjconf 201/ 35213001
This is an Open Access article distributed under the terms of the Creative Commons Attribution License 2 0 , which . permits unrestricted use, distributi and reproduction in any medium, provided the original work is properly cited.
Figure 1.Sketch of the particle and energy flow in pp collisions at √s=14 TeV and compilation of phase space acceptances by various LHC experiments [1, de Roeck].
the advent of LHC data. Properties of interest for the mod-eling of EAS are the overall particle and energy flow as a function of rapidity, which in absence of full particle identification is often approximated by the pseudorapidity
η=−ln(tanθ/2), shown in Fig. 1. The transverse
momen-tum, dσ/d p⊥, particle multiplicity distribution, dN/dM
(withM being the charged particle multiplicity), as well
as the total-, inelastic-, and diffractive cross sections,σtot, σinel,σdiffr, respectively, are further observables of prime
interest.
dNch/dηdistributions for non-single diffractive (NSD)
pp-interactions at √s=7 TeV are shown in Fig. 2 and are
compared to the most common HEP models PYTHIA and PHOJET (left) and to interaction models common in EAS modeling (right). While PYTHIA and PHOJET underesti-mate the pseudorapidity distributions by up to a significant amount, models applied in EAS simulations bracket the experimental data. Moreover, it should be stressed, that no extra tuning has been done in the latter case, i.e. the sim-ulated curves are predictions [2]. This comparison gives some confidence in the EAS models and also supports the general practice that the interpretation of EAS data with
different EAS interaction models provides an estimate of
-4 -2 0 2 4 -2 0 2 4 η
SIBYLL 2.1 QGSJET 01 QGSJET II EPOS 1.99
Figure 2. Pseudorapidity distributions of charged hadrons in NSD pp interactions measured by CMS at √s=7 TeV. The grey band indicates the systematic uncertainties. The data are com-pared to typical HEP and EAS models. (Adapted from [2].)
Figure 3. Evolution ofdN/dη|η=0 for NSD events as a function
of the cms energy. Large differences are seen for extrapolations into the GZK domain at√s'400 TeV [1, de Roeck].
the systematic uncertainties involved. However, looking at the energy dependence, we note that EPOS 1.99 grows too slowly and QGSJET II too fast with increasing cms
en-ergy. Thus, data at √s=14 TeV, hopefully available after
the long 2013/2014 shut down, will be of great interest. As
shown by A. de Roeck [1],dN/dη|η=0of NSD events
pre-dicted by EPOS 1.99 and QGSJET II exhibits differences
by a factor 2-3 when extrapolating into the GZK domain
at √s'400 TeV.
A very good description of the energy flow dE/dη
measured by CMS in Pb+Pb collisions up toη=6 and in
different bins of centrality is provided by EPOS 1.99 and
QGSJET II (see presentations by I. Katkov, D. Volanskyy and de Roeck [1]). However, EPOS and SIBYLL fail again in describing the very forward (9.2< η <9.4)π0 produc-tion measured by LHCf at large transverse momentum of
p⊥ >∼ 0.4 GeV/c (see presentation by Y. Itow [1]). Sim-ilarly, H1 data from HERA are still being analyzed and
the photon production (dominated byπ0-decay) up to large
Figure 4. Example of a high-multiplicity cosmic ray event in ALICE which fired most scintillator trigger modules (ACORDE) and yields a density of∼18 muons/m2 within the TPC volume
[1, Grosse-Oetringhaus].
poorly by EPOS and Sibyll (see A. Buniatyan at this con-ference [1]). These new results - even though still brack-eted by the models - indicate that EPOS and SIBYLL pro-duce too hardπ0spectra at forward rapidities.
At this stage we may conclude that the bulk data on energy and particle flow are fairly well described by EAS
models but more improvements are needed. This
re-quires joining forces between the CR and HEP commu-nity. Model builders of the CR-community need to iden-tify which data are most important for further tuning of their models and they also need to figure out, what level of
precision would be needed for different observables. Only
with such kind of information and prioritization, can ad-ditional measurements can be planned and detectors ap-propriately designed. A very useful study in this direction was recently performed by Ulrich, Engel and Unger [3]. It demonstrated that the interaction cross section, charged particle multiplicity, elasticity, and charge ratio influence
the EAS observables (Ne, Nµ, Xmax, and RMS Xmax) in
very specific correlated and anti-correlated ways.
2.2 Observation of Muon Bundles with Accelerator Experiments
Observations of muon bundles with very large muon mul-tiplicities were first reported by LEP experiments (see e.g. [4, 5]). These events were observed at a rate almost an order of magnitude larger than expected from simulations even when making extreme assumptions on the measured all-particle flux and assuming a pure iron composition and as such often were interpreted in terms of new physics.
An update on such measurements was presented by J. F. Grosse-Oetringhaus reporting data from the ALICE
TPC [1]. Again, muon densities up to 18 m−2were found
within the TPC volume yielding more than 270 muons
ob-served in single events during 11 days of effective data
taking in 2010/2011. Careful modeling with CORSIKA
using the all-particle spectrum as input and assuming an increasingly heavy composition beyond the knee (see be-low) recently demonstrated that such events are expected at the measured rate from iron dominated EAS reaching
energies near to 1017eV and landing some tens of metres
from the ALICE detector [6]. This still preliminary find-ing appears to eliminate the need of exotic physics and supports measurements of a very heavy composition be-yond the knee. However, as shall be discussed below, EAS observations at the highest energies still show a deficit of muons in EAS models which may reach a factor of 2 for a proton dominated composition and is reduced to about 30 % when assuming a iron dominated composition.
2.3 Measurements of Cross Sections
A very nice introduction to cross-section measurements was given by J. Pinfold [1]. Generally, the total cross sec-tion is disentangled into different components
σtot=σelastic+σinelastic (1)
with:
σinelastic=σnon−diff+σsingle−diff+σdouble−diff+σexcl+. . . (2)
It is probably fair to say that the TOTEM experiment, presented at this symposium by K. Eggert [1], performed the most advanced and precise measurements of the pp elastic, -total, -inelastic, and -diffractive cross sections at LHC energies. It employs two telescopes T1 and T2 at 3.1< η <4.7 and 5.3< η <6.5, respectively, for the mea-surements of the inelastic cross section and 24 Roman pots up to a distance of 220 m on both sides of the interaction
point for measurements of the elastic and diffractive pp
cross-section. From a very detailed analysis of the diff rac-tive pattern and extrapolation to|t| =0 witht =−p2·θ2
the integrated elastic cross section is found to beσelast =
25.4±1.0lumi±0.3syst±0.03statmb [7]. For the inelastic cross sectionσinel=73.7±0.1stat±1.7syst±2.9lumimb and
for the total cross section thenσtot = (98.3±2.0) mb is
reported [8]. Consistent results were reported by Pinfold, de Roeck, and Grosse-Oetringhaus [1].
Very interesting measurements of the pp inelastic and
total cross sections at √s=57 TeV, i.e. almost ten times
the LHC energy, were reported by R. Ulrich based on EAS data from the Pierre Auger Observatory [1]. This is done by selecting CR primaries at 1018 <E/eV <1018.5
and analyzing the exponential tail of theXmaxdistribution
dn/dXmax∝exp (−Xmax/Λ) for a total of 800 events
pass-ing all cuts. The attenuation parameterΛis then inversely
(Proton-Proton) [mb]
inel
σ
30 40 50 60 70 80 90 100 110
[GeV] s
3
10 104 105
ATLAS 2011 CMS 2011 ALICE 2011 TOTEM 2011 UA5 CDF/E710 Auger 2012 (Glauber)
QGSJet01 QGSJetII.3 Sibyll2.1 Epos1.99 Pythia 6.115 Phojet
Figure 5.Comparison of derivedσinel
pp from Auger to model
pre-dictions and accelerator data, discussed at this conference. The inner error bars of the Auger data represent statistical errors and the outer ones include systematic uncertainties [9].
2.4 Fixed Target Experiments
The fixed target program has almost vanished at CERN because of interests focussed strongly to the highest cms-energies and to tests of the standard model of particle
physics. However, NA61/SHINE is taking data at the SPS
with its science program – besides searching for the on-set of deconfinement and for the critical point of strongly interacting matter and providing valuable data for neu-trino experiments – being well aligned with the needs of the cosmic ray community. There is a full program still going on for another few years measuring a wide range of projectile-target combinations across a range of beam
energies from 13 - 160 GeV/nucleon. Its also
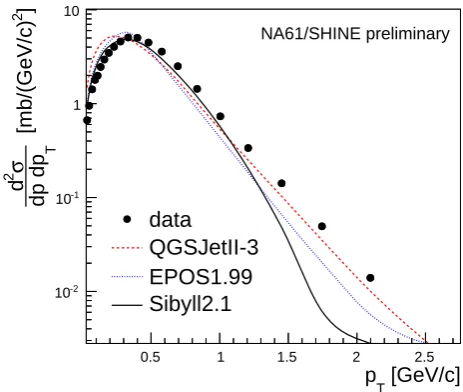
worth-while mentioning that the collaboration involves scientists from nuclear, particle, and cosmic ray physics. A report about recent measurements was given by M. Unger and M. Markariev [1]. Figure 6 shows an exemplary plot of
negatively charged hadron production in π−+C
interac-tions at 158 GeV/cbeam momentum athpi=10.4 GeV/c.
The data are compared to recent versions of high en-ergy hadronic interaction models employed in CORSIKA. Here, EPOS 1.99 and QGSJet II-3 show a very good
agree-ment while Sibyll 2.1 fails desribing the high p⊥-part of
the spectrum.
Comparisons ofπ+production data in p+C reactions at
31 GeV/cto the two commonly used low-energy
interac-tion models GHEISHA and Fluka exhibited severe prob-lems in GHEISHA [1, Unger]. This model has served for a long time e.g. in detector simulations with GEANT.
The statistics of the p+C data will be increased by
another factor of 10. Moreover, baryon and anti-baryon,
strange baryons, andρ0-mesons will be measured in the
near future, all of which will be of utmost importance for cosmic ray measurements, particularly in view of trying to solve the deficit of muons observed in comparison to EAS data (see next section).
[GeV/c]
T
p
0.5 1 1.5 2 2.5
]
2
[mb/(GeV/c) T
dp dp
σ
2
d
-2
10
-1
10 1 10
data
QGSJetII-3
EPOS1.99
Sibyll2.1
NA61/SHINE preliminary
Figure 6.Transverse momentum spectrum of negatively charged hadrons produced inπ−+
C interactions at 158 GeV/cbeam mo-mentum athpi=10.4 GeV/c[1, Unger].
3 The Muon Problem in EAS-Simulations
The so called muon-problem in EAS-simulations dates back more than a decade by now. It was reported first by the prototype HiRes telescope when operated at the MIA air shower array [11]. When comparing the muon density measured by MIA as a function of CR-energy determined in a calorimetric way by the HiRes-Telescope, a deficit of muons in the simulations was found with respect to MIA data when a composition lighter than Fe was assumed. A proton dominated composition, however, was preferred
from theXmaxmeasurement of the same HiRes prototype
telescope. Similar observations were later reported by the multi-detector array KASCADE and were reported for the successor experiment KASCADE-Grande at this meeting by A. Haungs [1]. He showed that the muon deficit around
1017eV can almost be neglected within the systematic
un-certainties for vertical showers but increases significantly
for larger zenith angles up to 40◦. Going to higher
en-ergies, P. Sokolsky in his review pointed out that there
is a 27 % difference in the reconstructed energy of the
Telescope Array (TA) dependent whether the calibration is based in the fluorescence telescopes or on simulations of the ground array [1]. Very similarly, J. Allen showed
the same effect increasing again for larger zenith angles
[1]. This is shown in Fig. 7 for events atθ >60◦ and
en-ergies ranging from 4·1018eV to 6·1019eV. Here, N
19
is defined as the ratio of the total number of muons, Nµ,
in the shower with respect to the total number of muons
at E = 10 EeV given by a 2-dim reference distribution,
N19 = Nµ(E, θ)/N map
µ (E =10 EeV, θ) which accounts for
p QGSJE T II Fe EPOS 1.99
Figure 7. Fit of a calibration curveN19 =A(E/10 EeV)B. The
constantsAand Bare obtained using the maximum-likelihood method. The contours indicate the constant levels of the p.d.f. integrated over zenith angle, corresponding to 10, 50 and 90% of the maximum value [12, H. Dembinski]. Calibration curves for protons QGSJETII (dot line) and iron EPOS1.99 (dashed line) are shown for comparison.
simulations done – still is too low by about 20 % compared to data.
Thus, all of the experiments and all of the different
analyses show a significant deficit in the number of muons predicted by simulations. This discrepancy cannot be ex-plained by the composition alone, although a heavy com-position reduces the relative excess of the data down to
Ndata
µ /Nmodelµ ∼ 1.3. Moreover, the observed zenith angle
dependence ofNrel
µ suggests that, in addition to the
num-ber, there may also be a discrepancy in the attenuation and lateral distribution of muons between the simulations and data [13].
The origin of this deficit is not yet understood and pos-sible reasons were discussed by S. Ostapchenko, L. Cazon, R. Conceicao and others (see theoretical summary by
S. Sarkar) [1]. Those include missingρ0 production, too
low (anti-)baryon and/or kaon production, a suppression
ofπ0production due to chiral symmetry restoration above
some threshold energy, etc.
4 Direct CR-Observations up to the Knee
4.1 Recent Results from Emulsion Experiments
Emulsions, due to their excellent spatial resolution and tracking capabilities along with information about the spe-cific energy losses of individual particles, look back to a long and successful history in cosmic ray and particle physics. However, when looking for rare events and trying to quantify their abundance, not only the average tracks need to be understood, but also their fluctuations on an event-by-event basis. Thus, the tool to be brought into place is detailed Monte Carlo simulations of the emulsion
0 20 40 60 80 100 120 140 160
0 2 4 6 8 10 12 14
<R>,CM
dN
/d<
R
>
*
N
pa
m
ir
/N
m
c
0
f
or
M
C
0
ALL, <R>=2.01+-0.03
P, <R>=1.79+-0.03
HE +LI, 2.43(2.37)+-0.09
C+O, <R>=2.91 +-0.19
Mg+S, <R>=3.86+-0.26i
V+Fe, <R>=4.15+-0.18
PAMIR, <R>=2.28+-0.06
ΣEγ = 100–400 TeV
Figure 8.Radial extension ofγ-families found in emulsions for data and different primary masses simulated and measured for 100<P
Eγ/T eV<400 [1, Borisov].
response to a flux of cosmic ray particles. This major step is now beginning to be taken and results were presented by A.S. Borisov and M. Tamada [1].
Borisov presented such studies for the radial exten-sion ofγ-families binned into intervals of total energy de-posited in the emulsions (Fig. 8) [1]. As demonstrated by
the figure, the observed radial spread hRdatai = (2.28±
0.06) cm can be described by a proton and He
dom-inated Galactic cosmic ray composition (open circles),
with hRpi = (1.79 ±0.063) cm and hRHei = (2.43±
0.093) cm. Another interesting development was
pre-sented by Tamada and Borisov where a hybrid
arrange-ment of an air shower array, burst detector, andγ-family
detector is operated. Thus, the correlations amongst the observables can be studied and compared with
COR-SIKA+GEANT simulations. While the energy deposited
in emulsions, P
Eγ, shows the expected correlation with
the electron shower size, Ne, of the array, deviations
be-tween data and simulations are found in the correlation of
PE
γwith the number of detected bursts,nb. Whether this
would point to new physics or to some yet unknown de-tector or simulation effect remains to be solved.
Very ambitious plans for a more complex hybrid exper-iment, named PAMIR XXI, were presented by Borisov [1]. The goal of the work done within the Pamir-Chacaltaya ISRC at a height of 4300 m a.s.l. is to study the event properties and cosmic ray composition up to the knee en-ergy. For this purpose, the air shower array is planned to
cover an area of 80×80 m2. It will be complemented by a
large calorimeter, open Cherenkov detectors, and imaging Cherenkov telescopes. More details will be worked out in a dedicated workshop planned in the near future at the Pamirs.
whereE is the energy-per-nucleon (including rest mass energy) andα (≡γ+ 1) = 2.7
is the differential spectral index of the cosmic ray flux and γ is the integral spectral
index. About 79% of the primary nucleons are free protons and about 70% of the rest are nucleons bound in helium nuclei. The fractions of the primary nuclei are nearly constant over this energy range (possibly with small but interesting variations). Fractions of both primary and secondary incident nuclei are listed in Table 24.1. Figure 24.1 shows the major components for energies greater than 2 GeV/nucleon.
Figure 24.1: Major components of the primary cosmic radiation from Refs. [1–12]. The figure was created by P. Boyle and D. Muller.
The composition and energy spectra of nuclei are typically interpreted in the context of propagation models, in which the sources of the primary cosmic radiation are located within the galaxy [13]. The ratio of secondary to primary nuclei is observed to decrease with increasing energy, a fact interpreted to mean that the lifetime of cosmic rays in the galaxy decreases with energy. Measurements of radioactive “clock” isotopes in the low energy cosmic radiation are consistent with a lifetime in the galaxy of about 15 Myr.
January 28, 2010 12:02
Figure 9.Compilation of energy spectra from direct experiments [15].
about the number of observed events and integrated ex-posure would be required. Moreover, full distributions of experimental observables are required after application of
acceptance cuts for measuredandfor (e.g. CORSIKA+
GEANT) simulated events so that the overall agreement of data and Monte Carlo can be verified and the fraction of observed events showing exotic features be quantified. This is a necessary step also for estimations of the cross section of such processes. Clearly, the first steps have been taken and this method deserves more thorough application.
4.2 Balloon and Satellite Observations
A comprehensive review of direct measurements of cos-mic rays was presented by R. Sparvoli [1]. Clearly, data from recent experiments have reached a new level of qual-ity and quantqual-ity, with PAMELA taking the lead. The en-ergy spectra of protons and nuclei start to exhibit structures
beyond simple power laws and also show different shapes
for different nuclei (c.f. Fig. 9). Perhaps most importantly, the hardening of He-spectra relative to protons at
rigidi-ties above some∼10 GV – discussed also by Di Sciascio
from CREAM [1] – seems to continue for heavier nuclei.
As a consequence, the He/p-ratio increases with possibly
the overall composition at the knee becoming significantly heavier than the standard Galactic cosmic ray composi-tion. This expectation is supported also by recent EAS data (see next section). PAMELA also reported an abrupt
hardening of the p- and He-spectra atR'235 GV with a
significance of 95 % CL. Since propagation effects should
be negligible above 100 GV, these findings - if confirmed - may provide clues about the underlying source spectra.
4
(E/eV) 10 log 16.4 16.6 16.8 17 17.2 17.4 17.6 17.8 18 18.2 18.4
) 1.7 eV -1 s -1 sr -2 (m 2.7
dI/dE x E
18 10
19 10
all-particle -- PRL 107 all-particle
heavy (sep. between He-CNO)
light (sep. between CNO-Si) -- PRL 107 light (sep. between CNO-Si) light (sep. between He-CNO) light (sep. on He)
FIG. 4. The all-particle and electron-rich spectra from the PRL107 analysis [8] in comparison to the results of this anal-ysis with the higher statistics. In addition to the light and heavy spectrum from the separation between He and CNO, the light spectrum from the separation on He is also shown.
between He and CNO should consist mainly of protons and helium, maybe with some additional, less abundant elements between helium and carbon, which are not sim-ulated. This can be seen in Fig. 3, where the combined simulated proton and helium component for QGSJet-II
175
is in good agreement with the reconstructed spectrum of light elements, which has been obtained by applying the QGSJet-II-based reconstruction and selection criteria to the data simulated using QGSJet-II-2. Assuming that the data simulated with EPOS are closer to real data,
180
then the measured spectrum of light particles is an al-most pure proton spectrum. This is also shown in Fig. 3. The simulated proton spectrum for EPOS is similar to the reconstructed spectrum of light primaries, which has been derived from EPOS generated events using again
185
the QGSJet-II-based reconstruction and selection crite-ria. According to QGSJet-II, the spectrum of heavy ele-ments for the same separation would contain carbon and primaries heavier than that. For EPOS it should also contain most of the helium component.
190
In Fig. 4 the results of the present analysis are shown. For cross-checking the results from [8] the all-particle spectrum and the spectrum of light primaries for the former used area and data are compared with the ones obtained with higher statistics from the present stud-ies. Both all-particle spectra and spectra of light ele-ments with the separation between CNO and Si are in good agreement. The spectra of light and heavy par-ticles with the separation between He and CNO were obtained using theseparation-line shown in Fig. 2. The heavy component, which now contains also the medium mass component, shows the change of the index atE = 1016.88±0.03eV and it therefore agrees inside the
corre-sponding error with the previous result, that the knee is atE= 1016.92±0.04eV. The hardening, or ankle-like
fea-(E/eV) 10 log 16.6 16.8 17 17.2 17.4 17.6 17.8 18 18.2
) 1.7 eV -1 s -1 sr -2 (m 2.7
dI/dE x E
19 10
light (sep. between He-CNO)
band of systematic uncertainty
0.08
±
/eV) = 17.08
break, light (E 10 0.08, log ± = -2.79 2 γ 0.05, ± = -3.25 1 γ 2506 1487 882 539 322 195 144 92 55 43 40 18 8
FIG. 5. The reconstructed energy spectrum of the light mass component of cosmic rays. Number of events per energy bin are indicated as well as the range of systematic uncertainty.
ture in the enriched spectrum of light primaries is more prominent compared to the one that includes the CNO component. Although the statistics get quite low for the spectrum of light elements with the separation on He (obtained by a fit to the meank-values for He in Fig. 2), it is obvious, that it cannot be described by one single power-law, only. Formula (4) [18] is used for fits to the light and heavy components.
dφ
dE(E) =φ0·E
γ1·[1 + (E Eb
)"](γ1−γ2)/",
φ0: normalization factor,
γ1/2: index before/after the bending,
Eb : energy of the break,
#: smoothness of the break
(4)
As shown in Fig. 5, a change of the spectral index from γ1 = −3.25 ± 0.05(stat)+0−0..0906(syst) to
γ2 = −2.79 ± 0.08(stat)+0−0..0001(syst) at an energy of
1017.08±0.08(stat)+0.03−0.01(syst)eV is observed in the light com-ponent. The dashed lines mark the systematic
error-195
band for the separation between He and CNO and they are obtained by using the dashed lines from Fig. 2. The measured number of events above the bending is Nmeas = 595. Without the bending we would expect
Nexp = 467 events above the ankle-like feature. The 200
Poisson probability to measure at least Nmeas events
above the bending, ifNexpevents are expected isP(N ≥
Nmeas) =!∞k=Nmeas(
Nk exp
k! e(−Nexp))≈7.23×10−09. This
corresponds to a significance of 5.8σ. If we shift the separation criteria for a cleaner proton sample (also
205
shown in figure 4) the slope difference even increase (γ1=−3.32±0.03 toγ2=−2.59±0.28 at an energy of
1017.16±0.19eV).
So far, possible uncertainties due to the underlying
Figure 10. The all-particle (full black squares) and electron-poor (=heavy) spectra (open squares) from [19] in comparison to electron-rich (=light) spectra (triangles) [20]. The lines repre-sent broken power law fits to the data.
Antiparticles are another interesting topic because they may provide information about annihilation of dark matter particles and also constitute stringent tests about Galactic propagation. Recent PAMELA data confirm the observed rise of the positron fractionφ(e+)/(φ(e+)+φ(e−)) to en-ergies up to about 200 GeV and are not described easily by Galactic propagation. Most recently, the AMS Collab-oration has released its first data with unprecedented sta-tistical accuracy [16] which confirm the general trend and agree very well with PAMELA. Antiprotons, measured by PAMELA, BESS and others do - on the other hand - not show any significant deviation from expectations based on Galactic propagation, i.e. they are well described as being produced by CR interactions with the interstellar medium.
This principal difference between positrons and
antipro-tons is a challenging puzzle to be solved. Besides being interpreted as DM annihilation, a more conventional as-trophysical interpretation of the positron excess may by
an emission from mature pulsars (O(105) years) [17]. The
continuation of the positron spectrum towards higher en-ergies should settle this question in the near future af-ter the advent of AMS data. Moreover, the signal from nearby pulsars is expected to generate a small but signifi-cant dipole anisotropy in the cosmic ray electron spectrum, potentially providing a method by which gamma-ray space telescopes would be capable of discriminating between the pulsar and dark matter origins of the observed high energy positrons. With no anisotropies having been found yet, the question about the origin of the positron excess remains to be answered.
5 Results from Air Shower Experiments
5.1 Two Knees in the CR-Spectrum
A. Chiavassa presented an overview of the latest results in the knee energy range [1]. As he pointed out, the knee is a
well established phenomenon of yet unknown astrophysi-cal origin rather than a feature of changing hadronic inter-actions. Measurements based on electron and muon num-bers, performed e.g. by EAS-TOP and KASCADE, have demonstrated an increasingly heavy composition above the knee. Furthermore, a 2d-unfolding of the KASCADE
Ne vs Nµ numbers suggests a dominance of p and
He-nuclei at the knee and an energy shift of the break in the
energy spectra of different mass groups which is
compati-ble with the assumption of a constant rigidity. The strong abundance of He at the knee has been a surprise, but this finding together with the increasingly heavier composi-tion above the knee is now well established and confirmed by other air shower experiments (see e.g. D. Di Sciascio’s report from ARGO-YBJ or S. Tilav’s report from IceTop [1]). Moreover, it agrees with extrapolations of the p- and He-spectra from direct measurements (Sec. 4.2). However, as reported by J. Huang [1], this finding appears in
contra-diction with data from Tibet-ASγwhich suggest a p-knee
already at 300 TeV so that the composition at the knee would be dominated by heavy primaries. The analysis of that data, however, is not straightforward: it combines
data from different experiments and experiment phases by
subtracting fluxes of different primaries, it assumes as in-put a heavy composition at the knee to which the data are compared [18], and the data selection imposes strong cuts which affect different primaries very differently.
Only recently, KASCADE-Grande reported the ob-servation of a steepening in the cosmic ray energy
spec-trum of heavy primary particles at about 8·1016eV [19]
(c.f. Fig. 10). This structure has a significance 3.5σand is seen also with smaller significance in the all-particle en-ergy spectrum. Thus, a heavy composition at the second knee in the all-particle spectrum can be concluded. The position of this “heavy knee” in the all-particle spectrum is well in line with a rigidity scaling from the light primary
knee at 3-5·1015eV. Tunka and IceTop continue to improve
their statistics but can already confirm a second knee just
below 1017eV. Yet, another important finding is reported
by KASCADE-Grande [20]: using their full data set and hard cuts on the selection of light primaries, an ankle-like
feature is observed at E ' 1017.1 with a significance of
more than 5σ (c.f. Fig. 10). Confirmation of this finding
would be of great importance, because the ankle-like fea-ture in the light primaries could indicate the expected re-covery of the light CR component below the ankle.
The techniques to reconstruct the composition of
pri-mary particles differ between experiments:
KASCADE-Grande uses electron and muon numbers at ground,
GRAPES in India uses muon multiplicity and Ne,
Ice-Top/IceCube uses the charged particle density at ground
from IceTop,S125, and the muon density near the shower
track from IceCube, K70. Tunka uses open Cherenkov
counters in which the steepness of the lateral distribu-tion within about 120 m from the shower core or the pulse width of the Cherenkov pulse is used to infer the
composi-tion. Despite this wide range of different observables and
different atmospheric depths and despite the very diff er-ent analysis techniques, the results more or less agree and
(E/eV)
10
log
18 18.5 19 19.5 20 20.5
))
2
eV
-1
sr
-1
s
-2
J /(m
3
( E
10
log
22.6 22.8 23 23.2 23.4 23.6 23.8 24 24.2 24.4 24.6 24.8
E[eV]
18
10 ×
2 1019 2×10¹⁹ 1020 2×10²⁰
1.102 )
×
Auger (ICRC 2011) (E 0.906 )
×
Telescope Array (E 0.561 )
×
Yakutsk (E 0.911 )
×
HiRes I (E 0.903 )
×
HiRes II (E
Figure 11. Published energy spectra, with the flux multiplied by E3, for Auger (combined Hybrid/SD), TA SD, Yakutsk SD,
HiRes I, and HiRes II after energy-rescaling as shown in the fig-ure has been applied. The reference spectrum is the average of those from Auger and TA. From [26] where also references to the respective data sets can be found.
provide the same overall picture. However agreeing on a quantitative level is still a long way to go.
The main obstacle in identifying Galactic CR-sources
is the diffusion of CRs in the Galactic magnetic field
(GMF), erasing directional information about the position of their sources. The GMF has a turbulent component that
varies on scales betweenlmin ∼1 AU andlmaxfew to 200
pc. Since CRs scatter on inhomogeneities with variation scales comparable to their Larmor radius, the propagation of Galactic CRs in the GMF resembles a random walk and
is well described by the diffusion approximation. Large
scale anisotropies observed by the Tibet Air-Shower ex-periment [21] in the northern hemisphere for CRs at en-ergies of a few to several hundred TeV and at angular
scales of 60◦ and below, thus came as a surprise. As
dis-cussed by P. Berghaus and D. Di Sciascio [1], these find-ings, also seen by Milagro [22], are now complemented by high statistics measurements from ARGO-YBJ and from IceTop in the southern hemisphere. Moreover, the struc-ture changes with energy and appears to persist to beyond PeV energies. This anisotropy reveals a new feature of the Galactic cosmic-ray distribution, which must be incorpo-rated into theories of the origin and propagation of cosmic rays. The origin of the anisotropies seen at different angu-lar scales and energies is still unknown but could in prin-ciple be accounted for by specific distributions (in space and time) and individual source energy spectra of nearby recent SNRs and as such is potentially most interesting.
5.2 The GZK Energy Region
At the highest energies, from the ankle to beyond 1020eV,
the Pierre Auger Observatory [23, 24] is the flagship in the field with an accumulated exposure of more than
30 000 km2sr yr (see talk by L. Perrone [1]). The
interest-E [eV] 15
10 1016 1017 1018 1019 1020
〉
lnA
〈
-1 0 1 2 3 4
p He N Fe
TA, preliminary HiRes HiRes/MIA CASA-BLANCA Yakutsk Tunka Auger
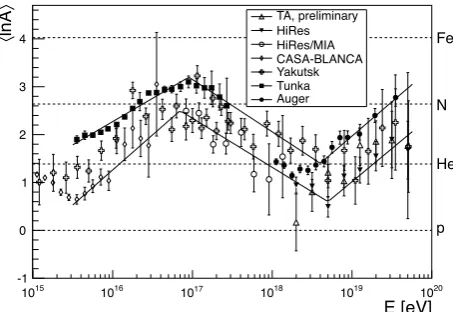
Figure 12. Average logarithmic mass of cosmic rays as a func-tion of energy derived fromXmaxmeasurements with optical
de-tectors for the EPOS 1.99 interaction model. Lines are estimates on the experimental systematics, i.e. upper and lower boundaries of the data presented [27].
ing comparisons can already be performed and were dis-cussed. A detailed comparison of the energy spectra of various observatories is presented in Fig. 11 [26]. As dis-cussed at great depth in [26], it is found that the energy spectra determined by the larger experiments are consis-tent in normalization and shape after energy scaling tors, as shown in Fig. 11, are applied. Those scaling fac-tors are within systematic uncertainties in the energy scale quoted by the experiments. This is quite remarkable and demonstrates how well the data are understood. Neverthe-less, cross-checks of photometric calibrations and atmo-spheric corrections have been started and as a next step, common models (e.g. of the fluorescence yield) should be used where possible. The data in Fig. 11 clearly exhibit
the ankle at∼5·1018eV and the flux suppression in
ac-cordance with the GZK-effect above∼4·1019eV.
The energy spectra by themselves, despite their high level of precision reached, do not allow one to draw con-clusions on the origin of the spectral structures and thereby
about the origin of CRs in the different energy regions.
Additional information is obtained from the mass com-position of CRs. Unfortunately, the measurement of pri-mary masses is the most difficult task in air shower physics as such measurements rely on comparisons of data to EAS simulations with the latter serving as reference [27]. Therefore, the advent of LHC data, discussed above, was of great importance to CR and EAS physics and has been awaited with great interest.
A detailed analysis of composition data from various experiments has been presented in [27] with a compila-tion depicted in Fig. 12. These data complement those of the energy spectrum in a remarkable way. As can be seen, the breaks in the energy spectrum coincide with the turning points of changes in the composition: it becomes increasingly heavier above the knee, reaches a maximum
at the 2nd knee, another minimum at the ankle, before it
starts to rise again towards the highest energies. Diff
er-ent interaction models provide the same answer
concern-ing changes in the composition but differ by their absolute
values ofhlnAi. It should also be noted that the rise of
the composition at the highest energies is not without dis-pute (see also talk by Sokolsky [1]). It has been looked at in great detail in [28]. At ultra-high energies, the Auger data suggest a largerhlnAithan all other experiments. The Auger results are consistent within systematic uncertain-ties with TA and Yakutsk, but not fully consistent with HiRes. When using QGSJet-II, HiRes is compatible with
the Auger data only at energies below 1018.5eV. When
us-ing the SIBYLL model, Auger and HiRes become com-patible within a larger energy range [28].
The importance of measuring the composition at the highest energy cannot be overstated as it will be the key to answering the question about the origin of CRs at the high-est energies. The same mechanism that causes the com-position of Galactic CRs to increase above the knee may work also for EG-CRs above the ankle. Thereby, the break
at ∼ 4·1019eV may mark the maximum energy of EG
CR-accelerators, rather than the GZK-effect. A mixture of
light and intermediate/heavy primaries at the highest
en-ergies may also explain the low level of directional corre-lations to nearby AGN. Enhancements, presently foreseen by the Auger Collaboration will address this issue.
Two models about the putative transition from Galactic- to EG-CRs have received much attention: In the classical ‘ankle model’ the transition is assumed to occur at the ankle. In this model, Galactic CRs above the second knee are dominated by heavy primaries before protons of EG origin start to take over and to dominate at the ankle. In the dip-model [29], on the other hand, the transition
occurs already at the 2nd knee and is characterized by a
sharp change of the composition from Galactic iron to ex-tragalactic protons while the ankle is due toe+e− produc-tion of protons in the CMB. A third, ‘mixed composiproduc-tion’, model has been suggested more recently [30] in which EG-CRs taking over are not considered protons but an EG mixed CR composition. Clearly, the dip-model requires a proton dominated composition essentially at all energies
starting somewhat above the 2nd knee. The answer may
be difficult to be given based onhXmaxiorhlnAialone. A
much better quantity, not yet looked at, would be the RMS of these quantities, such as studied at higher energies in [31]. A rather abrupt change of composition as required
by the dip-model near the 2ndknee vs a smooth change of
composition as expected near the ankle in the ankle model,
should become distinguishable by the RMS(Xmax)-values
already in the very near future. This has been a prime mo-tivation for the HEAT and TALE extensions of Auger and TA, respectively.
6 High Energy Muons and Neutrinos
More great news was presented from IceCube (T. Gaisser, E. Middel, P. Berghaus [1]) with the detection of two elec-tron neutrinos with estimated energies of 1-2 PeV energy
at an expected background of 0.14 events (2.36σ). The
Figure 13. Pictorial view of one of the twoνe events seen in IceCube with an energy at the PeV scale [1, Middel].
atmospheric neutrino fluxes, but before claiming an ex-traterrestrial origin, more checks are to be done.
As J. Brunner pointed out in his overview talk [1], large high energy cosmic neutrino telescopes are now
quite mature. IceCube, for example, observes about
50,000 well-reconstructed single atmospheric neutrino
events/year, with energies above 100 GeV. Although the
neutrino detection probability is small, current detectors are large enough so that it is possible to study their fluxes in great detail for comparison to EAS simulations. T. Gaisser specifically addressed the question about sig-natures of enhanced prompt charm production and asked the question whether the use of seasonal variations could help to see prompt leptons from charm decay. Moreover, the muon charge ratio is another topic of importance for EAS simulations and due to the enormous statistics avail-able now, there is even potential to observe the knee of the CR spectrum in the neutrino energy spectrum (see also Fe-dynitch and Honda). The HE neutrino telescopes may also serve the study of neutrino oscillations as was pointed out by Brunner. These are just a few examples, where high en-ergy muons and neutrinos may provide a link to hadronic interactions and to possibly new physics.
7 Outlook and Conclusions
Motivated by the large body of important experimental findings and new insights, the field continues to evolve very dynamically with new projects being planned or
ex-isting ones to be upgraded. In TeVγ-astronomy, reviewed
by G. Maier,CTAis the flagship for the next decade. In
the study of low energy CRs,AMSis the by far most
com-plex instrument in the orbit and it has been launched on May 16, 2011. It will measure light CR isotopes from about 500 MeV to 10 GeV and is hoped to improve our understanding of CR propagation in Galaxy. First data on
the positron/electron ratio have been released with more
data promised to come soon. TheCALET
(CALorimet-ric Electron Telescope) project is another large Japanese led international mission being developed as part of the utilization plan for the International Space Station (ISS) and aims at studying details of particle propagation in the Galaxy, by a combination of energy spectrum mea-surements of electrons, protons and higher-charged
nu-clei. Similarly, Gamma-400 is planned to be flown on
a Russian satellite and will combine for the first time pho-ton and particle (electrons and nuclei) detection aiming at an angular resolution and sensitivity about 5 times
bet-ter than Fermi-LAT. The idea of ISS-CREAMis to put
the CREAM detector, developed as a long duration bal-loon experiment, onboard the ISS, at the Japanese Exper-iment Modules Exposed Facility (JEM-EF) KIBO where
will have good chances to reach up to 1015eV energy.
In Siberia, the German-Russian project HiScore is
planned to be constructed at the Tunka site. This project will use open Cherenkov counters for CR measurements around the knee and will be complemented by radio
an-tennas to explore this new detection technology.HAWKis
being constructed in Mexico with the prime goal of
study-ing theγ-ray sky above 100 GeV. It will also contribute to
measuring CR anisotropies at TeV-energies. LHAASO,
mostly driven by the Chinese community and much larger and more complex than HAWK, serves the same scientific goals and looks forward to funding.
At the highest energies,AugerandTAplan upgrades
in performance and size, respectively, and started to join
efforts for a Next Generation Ground-based CR
Observa-tory NGGO, much larger than existing experiments and aiming at good energy and mass resolution and exploring particle physics aspects at the highest energies. Four pro-posed and planned space missions constitute the roadmap
of the space oriented community: TUS, JEM-EUSO,
KLPVE, and Super-EUSOaim at contributing step-by-step to establish this challenging field of research. They will reach very large exposures at the expense of composi-tion measurements and particle physics capabilities. Given the resources of funding available in the next decade or two, it is unlikely that all of the above mentioned projects can be realized. Thus, priority should be given to comple-mentarity rather than on duplication.
of scaling effects from pp to AA collisions at the highest energies.
It is a pleasure to thank the organizers of the ISVHECRI Symposium for inviting me to this vibrant and perfectly organized conference at which many new and exciting
results have been presented. I am very grateful for
careful reading of the manuscript by Carola Dobrigkeit
and Roger Clay. Financial support by the German
Ministry of Research and Education (Grants 05A11PX1 and 05A11PXA) and by the Helmholtz Alliance for Astroparticle Physics (HAP) is gratefully acknowledged.
References
[1] To be published in EPJ (Web of Conferences), this volume (2013)
[2] D. d’Enterria et al., Astropart. Phys.35, 98 (2011).
[3] R. Ulrich, R. Engel, M. Unger, Phys. Rev D 83,
054026 (2011).
[4] V. Avati et al., Astropart. Phys.19, 513 (2003). [5] J. Abdallah et al., [Delphi-Collaboration], Astropart.
Phys.28, 273 (2007).
[6] B. Alessandro [ALICE-Collaboration], talk pre-sented at the Astroparticle Forum CERN, Feb. 2013. [7] K. Eggert, this volume (2013)
[8] G. Antchev et al., [Totem-Collaboration], EPL96,
21002 (2011).
[9] P. Abreu et al., [Auger-Collaboration], Phys. Rev.
Lett.109, 062002 (2012).
[10] N. Abgrall et al., [NA61/SHINE-Collaboration],
Phys. Rev. C84, 034604 (2011).
[11] T. Abu-Zayyad et al., [Hires/Mia-Collaboration],
Phys. Rev. Lett.84, 4276 (2000).
[12] The Pierre Auger Collaboration, 2011, Proc. 32nd
ICRC, Beijing, China. arXiv:1107.4809.
[13] K.-H. Kampert for the The Pierre Auger
Collab-oration, 2011, Proc. 32nd ICRC, Beijing, China.
arXiv:1207.4823.
[14] R. Acquafredda et al., JINST4, P04018 (2009)
[15] K. Nakamura et al. (Particle Data Group), J. Phys.G
37, 075021 (2010)
[16] M. Aguilar et al., [AMS Collaboration], Phys. Rev.
Lett.110, 141102 (2013).
[17] D. Hooper, P. Blasi, and P. D. Serpico, JCAP01, 025
(2009)
[18] M. Amenomori, et al., [Tibet ASγ Collaboration],
Adv. Space Research47629 (2011).
[19] W. D. Apel et al.,
[KASCADE-Grande-Collaboration], Phys. Rev. Lett. 107, 171104
(2011).
[20] W. D. Apel et al.,
[KASCADE-Grande-Collaboration], Phys. Rev. D (rapid comm.)
(2013) in press.
[21] M. Amenomori, et al., [The Tibet ASg
Collabora-tion], Science314, 439 (2006).
[22] A.A. Abdo et al., [Milagro Collaboration], Phys.
Rev. Lett.101(2008) 221101
[23] J. Abraham et al., [Pierre Auger Collaboration],
Nucl. Instr. Meth.A523, 50 (2004).
[24] J. Abraham, et al., [Pierre Auger Collaboration],
Nucl. Instr. Meth.A620, 227 (2010).
[25] T. Abu-Zayyad, et al., [Telescope Array Collabora-tion], Nucl. Instr. Meth.689, 87 (2012).
[26] B.R. Dawson et al., Proc. to UHECR2012 Sympo-sium, EPJ web of conferences, 2013.
[27] K.-H. Kampert and M. Unger, Astrop. Phys.35, 660
(2012).
[28] E. Barcikowski et al., Proc. to UHECR2012 Sympo-sium, EPJ web of conferences, 2013.
[29] V. Berezinsky, and S. Grigorieva, Astronomy &
As-trophysics199, 1 (1988).
[30] R. Aloisio, V. Berezinsky, and A. Gazizov,
arXiv:1211.0494 (2012).
[31] J. Abraham et al., [Pierre Auger Collaboration],
Phys. Rev. Lett.104, 091101 (2010).
![Figure 4. Example of a high-multiplicity cosmic ray event inALICE which fired most scintillator trigger modules (ACORDE)and yields a density of ∼ 18 muons/m2 within the TPC volume[1, Grosse-Oetringhaus].](https://thumb-us.123doks.com/thumbv2/123dok_us/8747968.1434975/3.595.84.264.81.280/figure-example-multiplicity-scintillator-acorde-density-grosse-oetringhaus.webp)
![Figure 8. Radial extension of γ-families found in emulsions fordata and different primary masses simulated and measured for100 < � Eγ/TeV < 400 [1, Borisov].](https://thumb-us.123doks.com/thumbv2/123dok_us/8747968.1434975/5.595.63.282.84.272/figure-extension-families-emulsions-dierent-simulated-measured-borisov.webp)
![Figure 24.1: Major components of the primary cosmic radiation from Refs. [1–12].Figure 9](https://thumb-us.123doks.com/thumbv2/123dok_us/8747968.1434975/6.595.62.286.83.345/figure-major-components-primary-cosmic-radiation-refs-figure.webp)

![Figure 13. Pictorial view of one of the two νe events seen inIceCube with an energy at the PeV scale [1, Middel].](https://thumb-us.123doks.com/thumbv2/123dok_us/8747968.1434975/9.595.66.278.81.286/figure-pictorial-view-events-inicecube-energy-scale-middel.webp)
