Identification of connexin gene
mutations in a linkage study of
inherited cataract
Donna S. Mackay
B.Sc.
A thesis submitted to the University o f London for the Degree of
Doctor o f Philosophy
Department o f Molecular Genetics
Institute o f Ophthalmology
University College London
University o f London
Bath Street
All rights reserved
INFORMATION TO ALL USERS
The quality of this reproduction is dependent upon the quality of the copy submitted.
In the unlikely event that the author did not send a complete manuscript and there are missing pages, these will be noted. Also, if material had to be removed,
a note will indicate the deletion.
uest.
ProQuest U642187
Published by ProQuest LLC(2015). Copyright of the Dissertation is held by the Author.
All rights reserved.
This work is protected against unauthorized copying under Title 17, United States Code. Microform Edition © ProQuest LLC.
ProQuest LLC
789 East Eisenhower Parkway P.O. Box 1346
Dedication
Dedication
Clan Mackay
Declaration
I declare that this thesis submitted for the degree of Doctor of
Philosophy is my own composition and save as otherwise stated
the data presented herein is my own original work.
Abstract
Abstract
Autosomal dominant cataract (ADC) is a clinically and genetically heterogeneous disease. Families with ADC were collected from Moorfields Eye hospital, London and separated into eight phenotypic groups. The most common phenotypic group was the pulverulent cataract, an opacity dust-like in nature. The aim o f this study was to identify the genes responsible for the pulverulent phenotype.
Genetic linkage analysis using microsatellite markers was used to perform a whole genome search to map a new locus (CZP3) to chromosome 13q, near the candidate gene
GJA3. Families A and E mapped to CZP3. The entire coding sequence o f the human
GJA3 gene was identified so that mutation analysis could be performed. Analysis of the coding region in family A identified an A -^G transition, predicting an asparagine to serine change at codon 63 (N63S) and introducing a Mwo 7 restriction site that segregated with the disease. Sequence analysis in family E showed the insertion o f a C at position 1137 (1137insC), predicted to cause a ffameshift leading to the extension of encoded peptide by 31 amino acids, creating a novel stretch of 87 amino acids at the end of the peptide. This sequence change caused the introduction of a Bst X I restriction site that segregated with the disease.
Families O and C were identified as descendants of the original family used in the identification of the first locus for ADC, CZPl. Microsatellite markers were used to genetically refine CZPl to chromosome lq21, near the candidate gene GJA8. Mutation screening of this gene identified a C—>T transition segregating with the disease in these two families, predicting a proline to serine change at position 88 (P88S). This sequence change caused the introduction of a Mnl I restriction site. A third family (CCT) mapped to CZPl. Mutation analysis identified a G->A transition in codon 48 changing an gukvn.cG^to a lysine (E'48K) and removing a FoA: 7 restriction site.
Acknowledgments
I always find this sort of thing very hard to write. O f course I have to thank my family, who have supported me throughout this Ph.D., especially my parents and my two sisters. Living with me after a bad day in the lab could not have been easy. I big thank you also has to go to my friends who had to listen to me moaning at the weekends and were always afraid when they heard the question “What do you do for a living?” directed at me! !
I would like to thank Prof. Shomi Bhattacharya for allowing to do my Ph.D. in his department. I have to thank Alex lonides, for making me so welcome when I first arrived. O f course, I can now admit, that I never found his jokes funny, and his contribution to science was better made by removing himself from the lab. Although I want to thank everyone in the department, I am not going to list all the names, there’s too many. I especially want to thank Neil (for putting up with my questions on how things work), Steph (for reading this thesis and of course for the gossip) and Marcela (the best person to share an office and a lab bench with). I would also like to mention people who have passed through the lab while I was there and taught me so much, Ro (a great person, who I hope is happy with her new life!) and Jess (a really fun person who brightened up the lab on her visit).
I also need to thank my American colleagues in the Cataract Research Center in the department of Ophthalmology, Washington University Medical School in St. Louis. Firstly for talking to a strange and slightly mad foreigner with a funny accent, who did not know about the war of 1812. Secondly for letting me into a different world, where the lens is the centre of the eye, if not the universe! ! ! !
Publications
Publications
Papers
lonides AC, Berry V, M ackay DS, Moore AT, Bhattacharya SS, Shiels A. (1997) A locus for autosomal dominant posterior polar cataract on chromosome Ip. Hum. mol
Genet., 6(1), 47-51.
M ackay D, lonides A, Berry V, Moore A, Bhattacharya S, Shiels A. (1997) A new locus for dominant “zonular pulverulent” cataract, on chromosome 13. Am. J. Hum.
Genet., 60(6), 1474-1478
Shiels A, M ackay D, lonides A, Berry V, Moore A, Bhattacharya S. (1998) A Missense Mutation in the Human Connexin50 Gene (GJA8) Underlies Autosomal Dominant "Zonular Pulverulent" Cataract, on Chromosome Iq. Am. J. Hum. Genet.,
62(3), 526-532
M ackay D, lonides A, Kibar Z, Rouleau G, Berry V, Moore A, Shiels A, Bhattacharya S. (1998) Mutations in the connexin46 gene underlie autosomal dominant cataract. Nature Genetics, In review.
Abstracts
lonides ACW, Berry V, M ackay DS, Moore AT, Bhattacharya SS, Shiels A. (1997) An autosomal dominant posterior polar cataract is linked to the short arm of human chromosome 1. Invest. Ophthalmol. Vis. Sci., 38(4), 4347.
M ackay DS, lonides ACW, Berry V, Moore AT, Bhattacharya SS, Shiels A. (1997) Autosomal dominant “zonular pulverulent” cataract linked to chromosome 13. Invest.
Ophthamol. Vis. Sci., 38(4), 2721.
Shiels A, M ackay D, lonides A, Berry V, Moore A, Bhattacharya S. (1997) A missense mutation in the GJA8 gene underlies autosomal dominant cataract on human chromosome \q.Am . Soc. Hum. Genet., 61(4), 104.
Table of Contents
Declaration
Page no.
2
Dedication 3
Abstract 4
Acknowledgements 5
Publications 6
Table of Contents 7
List of Figures 12
List of Tables 15
List of Abbreviations 16
Key to pedigree symbols 17
C h a p te r 1 18
In to d u c tio n 18
1.1 Genetic linkage analysis and eye disease 18
1.2 The lens 19
1.2.1 Embryology of the lens 19
1.2.2 Structure o f the lens 21
1.3 Transparency of the lens 24
1.4 The lens and Disease 25
1.4.1 What is a cataract? 25
1.4.2 Cataract as a genetic disease 25
1.4.3 Causes of cataract 27
1.4.4 Other lens defects 28
Table o f Contents
1.5.3 Candidate gene cloning 31
1.5.4 Positional cloning 31
1.5.5 Positional candidate cloning 32
1.5.6 Physical mapping 3 3
1.5.7 Mutation analysis 3 5
1.6 Genetic linkage analysis 37
1.6.1 Theory o f genetic linkage analysis 37
1.6.2 Types of genetic markers 38
1.6.3 Linkage analysis 39
1.6.4 Multipoint linkage analysis 40
1.7 Linkage analysis and ADC 41
1.7.1 lp36 locus 43
1.7.2 Gamma crystallin cluster on 2q32-q36 45
1.7.3 16q22.1 locus near Haptoglobin 46
1.7.4 CTAA2 locus on 17pl3 48
1.7.5 CCZ^locus on 1 7 q ll-q l2 49
1.7.6 CCAl locus on 17q24 50
1.7.7 CRYAA locus on 21q22.3 50
1.7.8 CCA2 locus on 22q 51
1.8 Aim of study
53
Chapter 2
54
Methods & Materials
54
2.1 Extraction of DNA 54
2.1.1 From Blood Samples
2.1.2 Small scale preparation of plasmid DNA using the alkaline 54 lysis mini-prep method.
2.2 Polymerase Chain Reaction (PCR) 55
2.2.1 Standard PCR protocol 55
2.2.2 Design o f PCR primers 56
2.3 Fractionation of DNA 57
2.3.1 Agarose gel electrophoresis 57
2.3.2 Denaturing polyacrylamide gel electrophoresis 58
2.4 Purification of DNA 58
2.4.1 Ethanol precipitation 58
2.5 Microsatellite analysis 60 2.5.1 Radioactive detection by 5’end labelling o f primer 60
2.5.2 Microsatellite PCR 61
2.5.3 Genetic linkage analysis 61
2.6 Digestion of DNA with restriction enymes 62
2.7 Subcloning PCR fragments using the pGEM vector kit 63
2.7.1 Ligation o f insert into vector 63
2.7.2 Transformation of competent E. Coli 63
2.7.3 Growth media and selection of recombinants 63
2.8 Sequencing using the Sanger dideoxy chain termination 64 method (Sanger et al. 1977) and the fluorescent ABI sequencer.
2.9 General solutions and media used 66
2.10 Electronic databases used 66
Chapter 3
67Genetic Linkage Analysis of the Pulverulent Cataract
673.1 Project overview 67
3.2 Experimental design 68
3.2.1 Use of a candidate region map 68
3.2.1.1 Phase 1 68
3.2.1.2 Phase 2 70
3.2.1.3 Phase 3 72
3.2.1.4 Phase 4 73
3.2.1.5 Phase 5 73
3.2.2 Choice of microsatellite markers 73
3.3 Family S 74
3.3.1 Introduction 74
3.3.2 Historical outline 74
3.3.3 Results o f new genetic linkage analysis 79
3.3.4 Sequence analysis of CCL 82
3.3.5 Conclusion 82
3.4 Families O & C, and the CCT family 86
3.5 Family A 90
Table o f Contents
3.8 Summary 98
Chapter 4
99C Z P l locus and
GJA8 on chromosome Iq
99
4.1 Historical overview 99
4.2 Aim of Study 101
4.3 Connexin S^IGJAS 101
4.4 Confirmation of linkage to lq2 103
4.4.1 Linkage analysis of CZPl 103
4.4.2 Haplotype and multipoint analysis of CZPl 103
4.5 Screening for mutation in GJA8 107
4.5.1 Preliminary screening for mutation 107
4.5.2 Sequence changes identified, different to the published 109
GJA8 sequence
4.5.3 Identification of P88S mutation in CZPl 111
4.6 Linkage analysis of a second family 114
4.6.1 Linkage analysis of the CCT family 114
4.6.2 Screening GJA8 for mutation in CCT 118
4.7 Summary 120
Chapter 5
122
CZP3 locus and
GJA3 on chromosome 13q
122
5.1 Aim of Study 122
5.2 Connexin 4 6IGJA3 122
5.3 Genetic linkage analysis of family A 123
5.4 Haplotype and multipoint analysis of CZP3 132
5.7 Cloning of human GJA3 142
5.8 PI clone 144
5.9 Identification of mutations in GJA3 147
5.9.1 Family A 147
5.9.2 Family E 149
5.10 Summary 152
Chapter 6
153Discussion
153
6.1 Summary of results 153
6.2 The connexin gene family 154
6.3 Connexins and Gap junctions 157
6.3.1 What are Gap j unctions? 15 7
6.3.2 Connexin and Gap junction structure 159
6.3.3 Study of connexin function 160
6.3.4 Formation of gap junctions 161
6.3.5 F actors affecting connexin function 162
6.4 Targeted disruption of connexin genes in the mouse 163
6.5 Connexins and human disease
6.5.1 Cx32 and X-linked Charcot-Marie-Tooth disease 165
6.5.2 Cx43 and Visceroatrial heterotaxia (VAH) syndrome 169
6.5.3 Cx26 and non-syndromic deafness 170
6.5.4 Connexins and cataract 173
6.6 Future work 179
6.6.1 Use of m v/Yro expression systems 179
6.6.2 Expression in a whole lens 179
6.6.3 Future linkage analysis 180
References
181
List o f Figures
List of Figures
Page No.
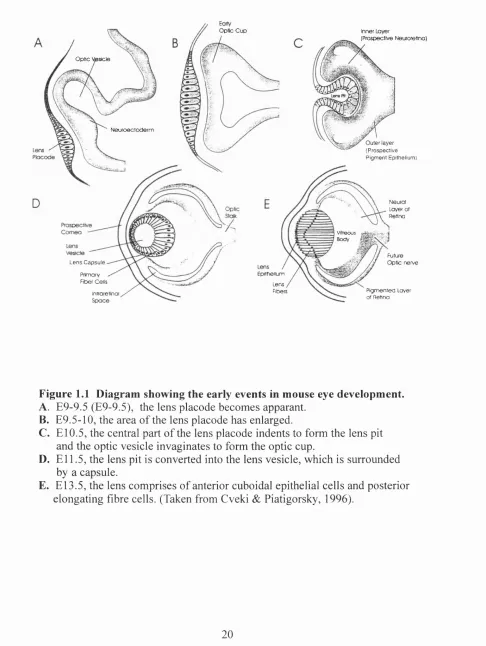
Figure 1.1 Diagram showing the early events in mouse eye 20 developement.
Figure 1.2 The lens. 22
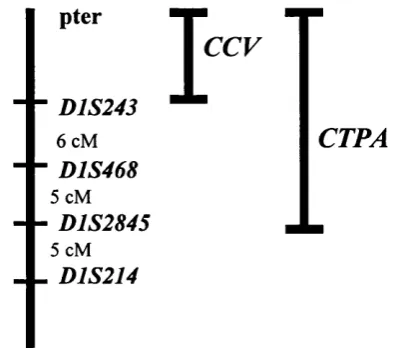
Figure 1.3 The lp36 locus. 44
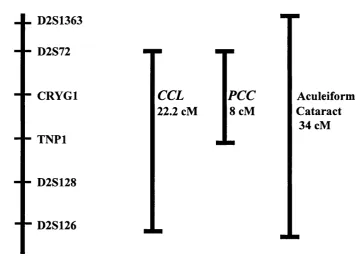
Figure 1.4 The gamma crystallin locus. 45
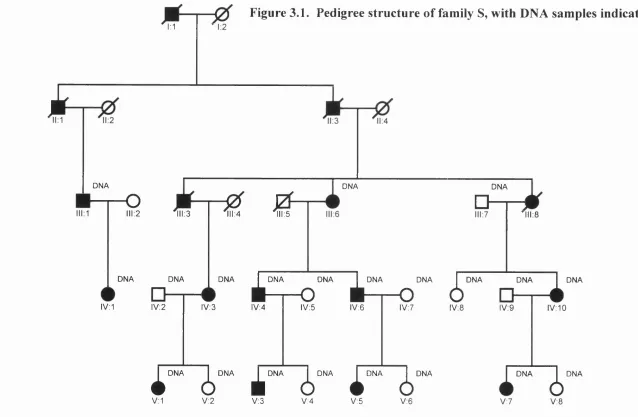
Figure 3.1 Pedigree structure of family S, with DNA samples 75 indicated.
Figure 3.2 A photograph showing an example of the pulverulent 76 cataract seen in family S.
Figure 3.3 Haplotype analysis showing the segregation of seven 81 chromosome 2 markers with the disease in family S.
Figure 3.4 Multpoint linkage analysis between family S and 83 chromosome 2 markers.
Figure 3.5 yE crystallin pseudogene sequence. 84
Figure 3.6 Sequence analysis of the yE crystallin pseudogene 85 in family S.
Figure 3.7 Families O & C, with DNA samples indicated. 87 Figure 3.8 Diagrammatic representation of the CZP7 phenotype. 88 Figure 3.9 Pedigree structure of the CCT family, with DNA 89
samples indicated.
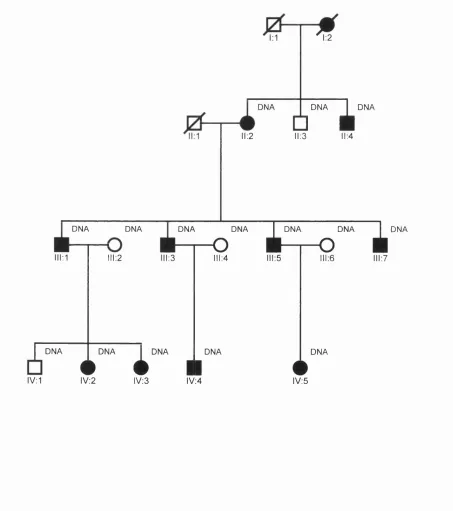
Figure 3.10 Pedigree structure of family A, with DNA samples 91 indicated.
Figure 3.11 A photograph showing an example of the pulverulent 92 phenotype seen in family A.
Figure 3.13 A photograph showing an example of the pulverulent 95 phenotype seen in family E.
Figure 3.14 Pedigree structure of family Z, indicating DNA 97
samples.
Figure 4.1 Original Ev. Pedigree as published by Renwick & Lawler 102 in 1963.
Figure 4.2 A diagram showing the position of chromosome 1 104 markers in relation to each other and the position of
disease intervals for CZPl and the CCT family.
Figure 4.3 CZPl pedigree showing the segregation of six markers 106 on chromosome Iq.
Figure 4.4 Multipoint linkage analysis between the CZPl family 108 and chromosome 1 markers.
Figure 4.5 Human GJA8 sequence showing both mutations, 110 restriction sites for M nl I, Sfi I, and Fok I, sequence
changes and primer positions.
Figure 4.6 Restriction analysis of the enzyme SJi I'm individuals 112 from the CZPl family.
Figure 4.7 Sequence analysis of GJA8 in the CZPl family. 113 Figure 4.8 Haplotype analysis showing the segregation o f seven 115
chromosome 1 markers with disease in the CCT family.
Figure 4.9 Multipoint linkage analysis between the CCT family 117 chromosome 1 markers.
Figure 4.10 Sequence analysis of GJA8 in the CCT family. 119 Figure 5.1 Haplotype analysis o f seven chromosome 13 markers 134
showing segregation with disease in family A.
List o f Figures
Figure 5.3 Idiogram of human chromosome 13 showing the genetic 137 distances in cM between the linking markers and the
calculated position of the CZP3 locus.
Figure 5.4 Haplotype analysis of eight chromosome 13 markers 140 showing segregation of disease in family E.
Figure 5.5 Multipoint linkage analysis between family E and 141 chromosome 13 markers.
Figure 5.6 Human GJA3 sequence. 145
Figure 5.7 Amino Acid alignment between the human GJA3 and 146 other GJA3 amino acids sequences.
Figure 5.8 Sequence analysis of GJA3 in family A. 148
Figure 5.9 Sequence analysis of 5 in family E. 150
Figure 5.10 Human GJA3 sequence showing both mutations (N63S 151 and 1137insC), restriction sites for Mwo I and Bst XI.
List of Tables
Page No.
Table 1.1 A search o f OMIM using keywords. 18
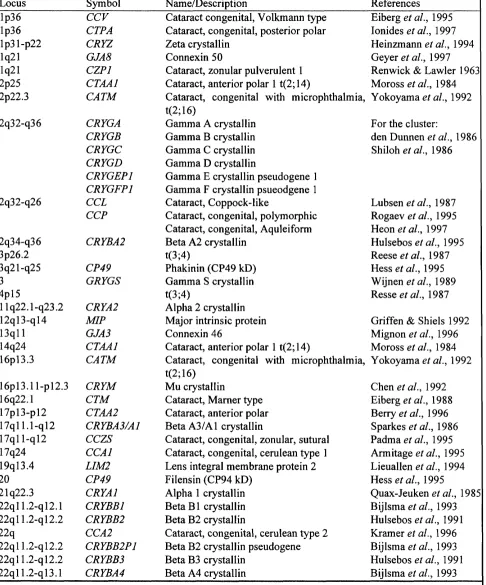
Table 1.2 Known genetic loci mapped by linkage analysis for ADC. 42
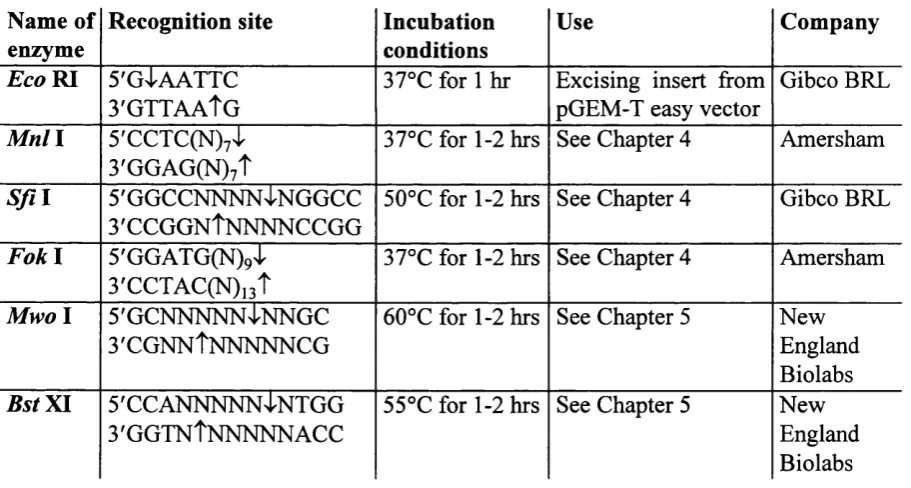
Table 2.1 Restriction enzymes used. 62
Table 3.1 Candidate region list for Autosomal Dominant 69 Cataract (CATMAP)
Table 3 .2 Two-point lod scores (Z) for family S and markers 80 from chromosome 2q.
Table 3.3 Primers used in the amplification of the CCL 84
mutation in family S.
Table 3 .4 Two-point lod scores (Z) between family Z and the 96 pulverulent candidate regions.
Table 4.1 Two-point lod scores (Z) for linkage between 105 chromosome 1 markers and CZPl.
Table 4.2 Primers used in amplification and sequencing 109
of GJA8.
Table 4.3 Two-point lod scores (Z) for linkage between CCT 116 family and chromosome Iq markers.
Table 5.1 Exclusion lod scores for family A. 124
Table 5.2 Two-point lod scores (Z) between family A and 133 chromosome 13 markers.
Table 5.3 Two-point lod scores (Z) between family E and 139 chromosome 13 markers.
Table 5 .4 Primers used in cloning and mutation screening G /4 5. 143 Table 6.1 Summary of different connexins found on Genbank. 155 Table 6 .2 Summary of the effects o f homozygous targeted deletion 164
of connexin genes in mice.
List o f Abbrevations
List o f Abbrevations
ADC
bp
C-terminus
Cx
CZPl
CZP3
DNA
GDB
GJA3
GJA8
OMIM
N-terminus
RNA
PI
YAC
PAC
BAC
SSCP
PCR
VNTR
Autosomal dominant Cataract
base pairs
Carboxy terminus
Connexin
Cataract Zonular Pulverulent 1
Cataract Zonular Pulverulent 3
Deoxyribonucleic acid
Genome Data Base
Gap junction alpha 3
Gap junction alpha 8
Online Mendelian Inheritance in Man
Amino terminus
Ribonucleic acid
Bacteriophage PI
Yeast artificial chromosome
PI artificial chromosome
Bacterial artificial chromosome
Single strand conformation polymorphism
Polymerase chain reaction
I
Key to Pedigree Symbols
Normal female and male, respectively.
^ 0 Affected female and male, respectively.
Dec eased individuals.
Non-consangmneous union.
Dizygotic twins.
Normal chromosome.
Disease chromosome.
Introduction
Chapter 1
Introduction
1.1 Genetic linkage analysis and eye disease
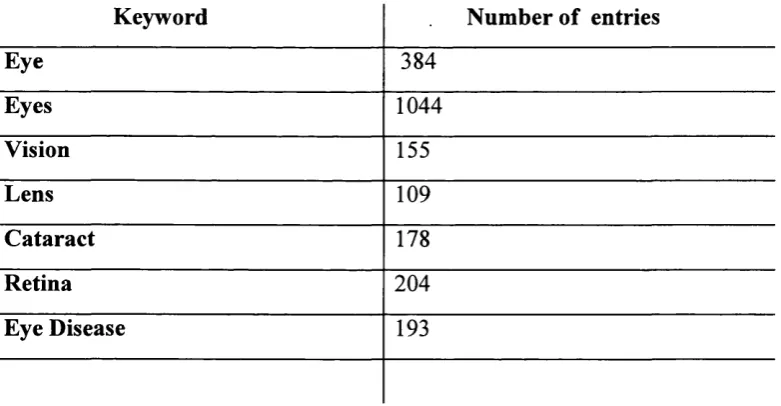
In the intense research effort to identify the genes responsible for inherited diseases, the eye as an organ has become an area of great activity. The eye is a complex organ, made up o f many different cell types, leading to the possibility of a large number of genetic diseases associated with it. Checking the database Online Mendelian Inheritance in Man (OMIM) (http://www.ncbi.nlm.gov.omim/) with keywords shows how important the eye is in human genetic disease (Table 1.1).
Table 1.1 A search of OMIM using keywords.
Keyword Number of entries
Eye 384
Eyes 1044
Vision 155
Lens 109
Cataract 178
Retina 204
Eye Disease 193
be on the X chromosome by Wilson in 1911), the first textbook of human genetics (by Waardenberg in 1932), the linkage of one human disease to another trait (haemophila to colour vision deficiency in 1947) the first human disease linkage to an autosome (autosomal dominant cataract linked to the Duffy blood group in 1963) and the first human disease to show digenic inheritance (mutations in two genes appeared to be necessary to cause one type of retinitis pigmentosa) (Damji & Allingham, 1997).
In recent years, research into retinal disease has been frenzied, but research into the anterior segment diseases especially those of the lens, has lagged behind. Diseases of the lens, especially inherited cataract, are now being studied due to advancement of genetic linkage analysis techniques.
1.2 The lens
To understand the phenotypic descriptions of inherited cataract, a basic knowledge of the embryology and structure o f the lens is needed.
1.2.1 Embryology of the lens
Introduction
Inner Layer
(Prospective IMeuroretinc) O ptic C u p
O p tic Vesicle
l^ e u r c e c to d e r m
O u te r la y e r (P ro s p e c tiv e P ig m e n t E pithelium )
Neurol Layer of Retina
Vitreous Body
Future
L e n s C a p s u le O ptic n erve
tpithieilum Primary
Fiber Cells Lens
Fibers
Introretlnoi P ig m e n te d Layer
ot Retina
Figure 1.1 Diagram showing the early events in mouse eye development. A. E9-9.5 (E9-9.5), the lens placode becomes apparant.
B. E9.5-10, the area of the lens placode has enlarged.
C. El 0.5, the central part of the lens placode indents to form the lens pit and the optic vesicle invaginates to form the optic cup.
D. E l l .5, the lens pit is converted into the lens vesicle, which is suiTounded
by a capsule.
and begin to fill the cavity of the lens vesicle. These cells are called the primary lens fibre cells. This is completed by the seventh week of fetal development. These cells form the part of the adult lens called the embryonic nucleus (Figure 1.2b).
Cells at the anterior of the lens vesicle do not form primary fibre cells, they form the epithelial layer. These cells only divide at a narrowly defined area lying anteriorly to the lens equator. These cells begin to undergo mitotic division, becoming elongated and moving in both directions. At the anterior side, they move beneath the undifferentiated epithelial cells, whereas at the posterior side they insert themselves just below the posterior capsule. These are the secondary fibre cells. As each cell elongates, its base that faces towards the capsule becomes broader and the result is that the cell orientation changes by 90 degrees. This allows the basal end of the cell to grow and extend towards the capsule while the head grows towards the lens epithelium.
1.2.2 Structure of the lens
The lens is an avascular, transparent biconvex structure situated behind the iris and pupil, separating the aqueous humour from the vitreous body. The lens is held in place by the zonular ligaments. As it is avascular, the aqueous humour is the source of nutrients for the lens and accepts its waste products. The function of the lens is to focus light onto the retina and for good vision the lens must be transparent. The equatorial diameter for the adult lens is about 9-10 mm and its thickness is 3.5-4 mm and not perfectly spherical (Donaldson, 1976). The anterior surface is more flattened, while the posterior surface is more curved. At the exact centres of each surface are the anterior and posterior poles with the line joining these poles called the axis (Donaldson, 1976).
F ig u re 1.2 T h e lens
Introduction
Cortex
Equator
Nucleus
Epithelium Anterior capsule
Sutures Posterior capsule
Figure 1.2a Diagrammatic section through the lens. (Taken from Harding, 1991)
E q uator
E m b ryon ic n u c le u s
- Inner portion O uter portion
Infantile n u c le u s
A dult n u c le u s
C ortex
C a p su le
Fetal n u c le u s
Figure 1.2b. Diagrammatic representation of a partially dissected adult lens (cross section) showing its various anatomic components.
and a product of the lens. It is a transparent basement membrane (a basal lamina) surrounding the lens. Part of its function is to control the shape of the lens as well as allowing the passage of small molecules. The major components of the lens capsule are collagen type IV, laminin, entactin, heparan sulphate proteoglycan and fibronectin.
The lens epithelium is a single layer of epithelial cells located immediately behind the anterior capsule. These cells, cuboidal in shape, are only found on the anterior surface. These cells divide at the equator, and become columnar in shape. They elongate and migrate throughout life to form lens fibre cells. Lens fibre cell differentiation is characterised by the loss of the nucleus and other cell organelles (Bassnett & Beebe, 1992). The fibre cells make up the major cellular component of the lens. The region of the lens composed of fibre cells that have lost their organelles is called the organelle-free zone (OFZ) (Bassnett & Mataic, 1997). Lens fibre cell differentiation is also characterised by the massive accumulation o f soluble crystallins and the synthesis of major intrinsic protein (MIP), lipids and other components of the lens (Berman, 1991). Lens fibre cells are long ribbon like cells that are slightly tapered at their anterior and posterior ends. New fibre cells are laid down in concentric layers, burying the older cells. No cells are lost from the lens.
Introduction
make up the cortex and the last three nuclei. The cortex continues to grow throughout life. Both the weight and the thickness of the lens increase steadily with age.
The fihre cells extend from the anterior to the posterior surface. As the cells are not long enough, the junctions of the ends of the lens fibres form the sutures. Sutures start to appear at 8-9 weeks of fetal life. The sutures of the lens extend from the inner portion o f the fetal nucleus out to the lens capsule. Until birth, the addition o f lens cell layers creates a suture plane with a symmetrical Y pattern in the anterior section and a symmetrical inverted Y pattern at the posterior section. After birth, suture formation pattern becomes very complex and irregular. During childhood, it is seen as a ‘simple star’ suture pattern (six branches). A nine branch pattern is generated by young childhood with a 12 or more complex pattern generated after that (Garland et al.,
1996). Each nucleus as well as the cortex has its own unique pattern that can be used to identify each region as there are no distinct morphological markers or barriers between the regions (Berman, 1991). These sutures are visible by slit lamp biomicroscopy, due to the slight scattering o f light that they cause.
1.3 Transparency of the lens.
There are many interdependent factors responsible for maintaining lens transparency, among them the packaging of crystallins, the maintenance o f ion pumps and membrane permeability. The arrangement o f the lens fibres is also important to give the minimum amount of extracellular space. The total lens extracellular space is only 1.3% (Phelps Brown & Bron, 1996). Increased separation of the fibres would cause light to scatter.
1.4 The Lens and Disease
1.4.1 What is a cataract?
The most common lens disease, is a cataract. Simply, a cataract is the clouding of a lens, changing it from a clear transparent lens to an opacity. A cataract can be any light-scattering opacity of the lens, not necessarily having an effect on vision.
Cataract is still a major cause of blindness worldwide in spite o f the existence of cataract surgery for thousands of years. About 40% of the estimated 42 million blind people are blind from cataract: 13 million in developing countries and 4 million in developed countries (Hym?n, 1987). It is a condition usually associated with old age in the developed world, treatable by surgery. In developing countries it is the major cause of blindness, due to the lack of effective treatment, malnutrition and infectious diseases. O f interest in the developed world is the effect of cataract on the visual system in childhood. Infantile cataracts not only blur the retinal image, but also disrupt the development of the visual pathways in the central nervous system. The prevalence of infantile cataract has been reported to be as high as 6 to as low as 1.2 cases per 10,000 births (Lambert & Drack, 1996).
1.4.2 Cataract as a genetic disease
Introduction
All three modes o f inheritance, autosomal dominant, autosomal recessive and X- linked inheritance can be found for cataract, although autosomal dominant inheritance accounts for most of the cases. To date, there are ten independent genetic loci for autosomal dominant cataract (ADC) that have been mapped using genetic linkage analysis in a family with an inherited form of cataract and no other clinical symptoms. As well as these loci (section 1.7) autosomal dominant cataracts have been associated with high serum ferritin levels (Bonneau et al, 1995) and microcomea (Polomeno & Cummings, 1979). Mutations in homeobox genes have also been associated with ADC. The homeobox gene PAX6 is known to cause autosomal dominant aniridia and maps to 1 lpl3 (Jordon et al, 1992). Cataracts are often seen in aniridia patients. In one family with two PAX6 mutations segregating, affected members either had the very severe phenotype, anophthalmia, or aniridia or just cataract. Analysis of this family showed that this was due to a gene dosage effect, with cataract affected individuals inheriting the less severe mutation (Glaser et al., 1994). A mutation in the
PAX6 gene has also been shown to cause autosomal dominant keratitis, of which cataract is a symptom (Mi&ayans et a l, 1995). The P1TX3 homeobox gene has been shown to be involved in anterior segment mesenchymal dysgenesis in one family and ADC in another (Semina et a i, 1998)
Recessive forms are rare, but have been identified in inbred communities, such as the juvenile cataract in Hutterites (Pearce et al., 1987). A recessive form of cataract has been mapped to the li blood group locus, where the cataract phenotype is associated with the I phenotype in the Japanese population (Ogata et al, 1979). The I blood group maps to 9q21 (OMIM). Deficiency of enzymes such as galactokinase (Stambolian et a l, 1995) have manifested themselves as recessive congenital cataract.
posterior Y-sutural cataracts. Other cataract pedigrees with males more severely affected than females are thought of as showing X linked inheritance, but no linkage analysis has been undertaken (OMIM).
Cataracts are often seen as a feature of many other genetic conditions. Cataracts occur at a higher rate in diabetic patients and in many metabolic disorders (homocystinuria, Lesch-Nyhan syndrome). In the renal disorder, Lowe’s oculocerebrorenal syndrome, total cataracts are seen. Cataracts are also commonly seen in Alports syndrome. In myotonic dystrophy, cataracts are a prominent feature and may be the first and only evidence of disease in a family. Cataract is associated with a number o f skin disorders. The association is not unexpected since the lens is of ectodermal origin. Icthyosis, Wemer syndrome and Cockayne syndrome all have cataract as a symptom. Central nervous system disorders with cataracts include Neurofibromatosis type II and Marinesco-Sjogren syndrome.
Cataracts are also associated with chromosomal disorders. Chromosomal disorders occur in about 1 in 160 newborn infants (Thompson & Thompson, 1980). Cataracts are a feature of trisomy 13, 18 and 21. Opacities have also been associated with deletions of the short arm of chromosome 4 and 5, o f the long arm of chromosome 13 and either the short or long arm of chromosome 18 (Phelps Brown & Bron, 1996). Inherited translocations are also associated with autosomal dominant cataract and will be discussed later (Chapter 3).
1.4.3 Causes of cataract
Introduction
drugs (Phelps Brown & Bron, 1996). Accumulation of metal ions such as calcium, copper and iron also cause cataract. Chemicals found in cigarette smoke are thought to increase the risk for nuclear cataract (Flaye et al., 1989). Epidemiology studies have also indicated that moderate alcohol consumption is a risk factor (Harding, 1988). Other epidemiological studies have suggested that nutrition plays a role in the development of cataract. There is also contradictory data for the involvement of UV light from exposure to the sunlight in cataract formation (Harding, 1991). Trauma is another major cause of cataract. This can include physical damage caused by concussion, penetration of the lens by a sharp object or by a high velocity foreign body. Electric shock and radiation also damage the lens and lead to cataract (Phelps Brown & Bron, 1996).
1.4.4 Other lens defects
1.5. Identifying disease genes
1.5.1 The human genome
The human haploid genome is 3 x 10^ bp, the DNA separated into 22 autosomal chromosomes and a sex chromosome. The human genome is complex. It is thought that only 5-10% of the genome codes for functional genes. The rest of the genome is repetitive DNA of unknown function. The complexity of the genome increases with evolutionary complexity. This means that the search for a disease gene is a difficult task and an understanding of the organisation of the human genome is important.
Repetitive DNA can be separated into groups depending on the type o f repeat, the number of copies and location (tandem or interspersed) in the genome.
Tandemly repeated DNA is known as satellite DNA and is found in the centromeric and heterochromatic regions o f chromosomes. Highly repetitive tandem repeats such as the alphoid sequences (171 bp satellite) make up the bulk of heterochromatin. The telomeres consist of tandem repeats of TTAGGG (Tyler-Smith & Willard, 1993). The 33 bp minisatellite can be tandemly repeated covering up to 30,000 bp. This repeat is originally derived from an intron in the myoglobin gene. This minisatellite is polymorphic and can be used in DNA fingerprinting. Other tandem repeats include microsatellites. Dinucleotide repeats (AC„) are used in genetic linkage analysis, and trinucleotide repeats are associated with genetic disease.
The interspersed repetitive elements are separated into two groups by size. SINE’s are short interspersed elements and the Alu repeat is an example. The Alu repeat is 300 bp and there are several thousand copies in the human genome (Houck et a l,
Introduction
Some gene families can be considered as moderately repeated DNA. Genes encoding abundant products are often tandemly repeated. Few hundred copies of ribosomal RNA genes (rRNA) are found on the short arms of acrocentric chromosomes. rRNA genes are not translated. Translated gene families that are tandemly repeated include the haemoglobins, actins, and the crystallins.
As well as repetitive DNA, human genes consist of exons and introns. Only exons are translated, and the number and size of the introns vary. Human genes also have 5' and y untranslated regions. Pseudogenes are also present. Pseudogenes are closely related to functional genes, but are non-functional due to accumulations of mutations following duplication of the gene or lacking the introns and regulatory elements of the functional gene (processed pseudogene).
Therefore in the human genome, functional genes cover a very small amount of DNA surrounded by different types of repetitive DNA, pseudogenes and regulatory elements. Many techniques have been designed to focus on the identification of expressed sequences in the genome.
The search for the genes involved in inherited cataract does not differ from mapping the genes responsible for any other genetic disease. For any disease with a genetic component, after identification of affected families, the next stage is to identify the gene(s) responsible for the condition. Mapping strategies used in the identification of a disease gene depend on the available information the investigator has on the disease. Depending on the biochemical evidence, the availability o f affected individuals and affected families and other indications on what might be the cause of the condition,
1.5.2 Functional cloning
The earliest disease genes were identified using functional cloning techniques. Functional cloning identifies the gene based on the biochemical defect associated with the disease. At no point is the chromosomal location of the disease gene needed for the gene’s identification. Classic examples are the haemoglobinopathies, and inborn errors of metabolism, where the defective blood group or enzyme has been identified by standard biochemical means. Once the protein was known, the gene and its chromosomal localisation could be ascertained. Unfortunately apart from conditions caused by an obvious biochemical defect, functional cloning has a limited use.
1.5.3 Candidate gene cloning
This method also depends on partial functional information about the disease, not enough to identify the disease gene immediately, but enough to create a list of likely candidates. These candidates can then be screened at the biochemical level or at the nucleotide level for the identification of the mutation. A recent example of this is the demonstration that the dominantly inherited familial cancer syndrome of Li & Fraumeni is due to germline missense mutations in the p53 gene (Malkin et al., 1990). In the candidate gene approach, no gene position information is utilised.
1.5.4 Positional cloning
Introduction
some regions of the genome. In a gene rich region this can contain up to 50 genes (Martin-Gallardo et ah, 1992), thus presenting a formidable task. Therefore the smaller the disease interval, the smaller the amount of DNA in which the disease gene could reside. This step can be aided by chromosomal rearrangements that can position the disease locus to as little as hundreds of kilobases (Collins, 1995).
The next step is to search the disease interval for genes. This can be done by making a physical map of the interval (section 1.5.6) and/or by looking for positional candidate genes that map to the region (section 1.5.5). The first success in positional cloning was the identification of the gene responsible for X-linked chronic granulomatous disease (Royer-Pokora et al., 1986).
1.5.5 Positional candidate cloning
The positional candidate approach is becoming the most common and productive way to identify disease genes. It relies on using genetic linkage analysis to map the disease to the smallest genetic interval. A search of the databases can identify genes already known to be mapped to this region. An ideal candidate gene is one that not only maps to the disease interval, but is also expressed in the tissue the disease affects.
1.5.6 Physical mapping
If there are no candidate genes in the region, or a mutation cannot be found in the candidate genes identified, the next step is to physically map the region in an attempt to identify new genes in the region. Human genomic DNA from the region can be isolated and cut using restriction endonucleases into small fragments of DNA, which can be cloned into a vector. A collection o f clones covering a genome is known as a library. Clones containing DNA mapping to the disease interval are identified by screening the library, with a fragment of DNA known to map to the interval. In most cases, the fragment of DNA used is one of the microsatellite markers known to be linked to the disease. Any fragment of DNA for which the sequence is known is called a sequence tagged site (STS). Every time a clone is identified, human DNA sequenced from the clone can be used as the STS for the next round of screening the library. A set of overlapping clones is called a contig (Davies & Read, 1992).
Introduction
Clones containing DNA of interest can be mapped back to the region of linkage by a variety of techniques. The cloned fragment can be radioactively labelled and hybridised directly to a spread of metaphase chromosomes {in situ hybridisation). Its cytogenetic localisation can be worked out by examining the spread under a microscope. Fluorescent labelling has largely superseded radiolabelling. Fluorescent
in situ hybridisation (FISH) is a powerful technique for physical mapping.
Somatic cell hybrids are another widely used mapping technique. When rodent and humans cells in culture are fused in the presence o f polyethylene glycol, the resulting heterokaryons are unstable and tend to lose the human chromosomes in a random way. Eventually stable cell lines are produced which contain a full set of rodent chromosomes plus a few human chromosomes. Once the human chromosomes present have been characterised, these stable cell lines can be used to test where a cloned piece of DNA maps (Davies & Read, 1992). Radiation hybrids are even more useful for mapping. They are produced in the same way as somatic cell hybrids except that before fusion the human cells are irradiated to fragment their DNA. After fusion, fragmented human DNA integrates into the rodent genome, producing a much finer mapping tool (Wicking & Williams^ 1991).
The most difficult part of any positional cloning project is the identification o f coding regions in the critical interval. A variety of strategies have been used in the past. These techniques include random sequencing of the clones from the contig. Analysis of this sequence can then take place looking for sequences that may belong to genes. Various computer programs have been designed for this use (Mallon & Strivens, 1998). The GRAIL program is one exon prediction program (Uberbacher et al.,
1991).
regions of immethylated DNA with a high frequency of CpG dinucleotides relative to the whole genome. They are associated with 5' ends of almost all housekeeping genes and 40% of tissue specific genes (Bird, 1986). Exon trapping takes advantage of the fact that all mammalian genes are interrupted by introns removed from RNA transcripts by the process of splicing. This method involves the detection of splice sites and is useful for the identification of genes not characterised by CpG islands or where the level o f expression is low (Duyk et al., 1990, Buckler et al., 1991).
Other methods used are based on the identification of cDNAs mapping to the region. Direct sequencing of cDNA libraries use the genomic clones identified as radioactive hybridisation probes. This method is useful when the candidate region is large, and was used to isolate cDNAs from the Huntington disease region (Snell et al., 1993). Direct cDNA selection (Lovett et al., 1991) utilises genomic DNA to capture cDNA via hybridisation, and PCR to identify transcription products. This allows cDNAs from the disease interval to be identified.
None o f these techniques used in modem cloning would be possible without the polymerase chain reaction. The polymerase chain reaction (PCR) since its discovery (Mullis & Faloora, 1987) has made a profound effect on molecular biology and can be considered the foundation of many modem molecular biology techniques.
1.5.7 Mutation analysis
Once a candidate gene has been identified, the gene must be screened for a mutation. Many techniques have been developed for this purpose.
Introduction
Sequence analysis is always used whatever the method of mutation detection, as it is the only method that can directly identify the single base change, deletion or insertion.
Other methods of mutation analysis are based on the mutation causing some structure/conformational change to the DNA, RNA or protein.
Single strand conformation polymorphism analysis (SSCP) is based on the fact that ssDNA tends to fold up into complex structures (Orita et al., 1989). These structures are dependent on nucleotide sequence. Any sequence change would produce ssDNA with a different structure which on a non denaturing gel would have a different mobility to the wild-type. It is rapid, simple and nonradioactive, but is less efficient than other methods in detecting changes. Denaturing gradient gel electrophoresis (DGGE) takes the wild-type and mutant dsDNA, denatures (by high temperature or a chemical dénaturant) and mixes the DNA. Theoretically, homoduplexes and
c
heteroduplexes (one strand of wild-type, one of mutant) should be formed (Fisher & Lerman, 1980). When these duplexes are run on a denaturing gel with a gradient, the hetro- and homoduplexes separate. It is a rapid, efficient (95% detected), non radioactive way to look for sequence changes. Both SSCP and DGGE can only test small fragments of DNA (200-500 bp) and cannot localise the site of the mutation. Heteroduplex analysis is a variation on SSCP (Keen et al., 1991). Small fragments of DNA are amplified, denatured and allowed to renature. Any mismatches in the heteroduplex cause a slower migration on polyacrylamide gel. Heteroduplex analysis has the same drawbacks as SSCP and DGGE.
1.6 Genetic linkage analysis
1.6.1 Theory of genetic linkage analysis
The use of genetic linkage analysis to map disease genes is based on Mendel’s law of independent assortment that states that genes on different chromosomes show 50% recombination. Genes or loci that are physically linked do not obey Mendel’s 2nd law. Loci that are physically linked on a chromosome can become separated if the distance between them is large enough for a recombination event to occur. Recombination, the basis of linkage, occurs at meiosis. Chiasmata form between the homologous chromatids at given points along the tetrad (Mange & Mange, 1990). The number of chiasmata per tetrad ranges between 1-4 with an average o f 2 per autosome in males (Sturt, 1976). Each chiasmata represents a place where non-sister chromatids have broken and rejoined in a criss-cross fashion. This exchange of DNA between non-sister chromatids is called a crossover (a recombination event), and it is this process that allows linkage analysis to map disease genes.
Introduction
1.6.2 Types of Genetic markers
A genetic marker is essentially any inherited character used to track the inheritance of a particular segment of DNA. For linkage analysis, the marker must be easily studied on a readily available material (e.g., DNA extracted from a blood sample), be inherited in one o f the simple Mendelian patterns and be polymorphic (Davies & Read, 1992).
The informativeness of a marker is given by it's PIC (polymorphic information content). The PIC measures the probability that the marker will be heterozygous in the parent so that it will be informative in the children. Informativeness is maximised if the marker has many alleles and each allele is relatively common in the general population. For genetic linkage analysis a PIC of above 0.70 is useful.
The first genetic markers to be used in linkage analysis were blood groups e.g., Rh, Duffy, but these are not highly polymorphic and the numbers limited. Blood groups only allowed limited linkage analysis, i.e., linkage to a chromosome. Protein polymorphism’s were also used in early linkage studies, but like blood groups their usefulness was limited. Now, DNA polymorphism’s are used. The first was RFLP’s (Restriction Fragment Length Polymorphisms) (Bdstein et al., 1980). They were discovered when genomic DNA was cut with bacterial restriction enzymes and the size of the fragments produced were found to differ between individuals.
1.6.3 Linkage analysis
Linkage is the measurement of the non-random assortment of genes at meiosis. This is detected as non-random segregation of loci in offspring. Two genetic loci are said to be linked if they segregate together in pedigrees more often than by random chance. This happens if they lie close together on the same chromosome. The results of a linkage study are lod scores (known as Z scores) for a pair of loci with a range of different recombination values (Davies & Read, 1992).
Lod stands for the logarithm to the base 10 of the odds that the two loci are linked at that recombination fraction rather than unlinked. At a recombination fraction (0) of zero, the two loci are linked, but 0=0.50 is equal to independent assortment. The theory of the lod score method was worked out by Morton in 1955 (Morton, 1955). Computer programs such as MLINK (Lathrop et a i, 1984) calculate the overall likelihood of the data based on two alternative assumptions, either that the two loci are linked at a given recombination fraction, or that they are unlinked. The ratio of these two likelihoods is the odds that the loci are linked. The logarithm to the base 10 of these odds is the lod score. The lod score (denoted as Z) is calculated for various recombination fractions (0), with the maximum lod score (Z^ax) occurring at the most likely recombination fraction
(Omax)-A lod score of zero means that the assumptions of linkage or no linkage are the same
(logio (1)=0). A positive lod score favours linkage whereas a negative lod score
provides evidence against linkage.
Introduction
about a 1 in 50 chance that two randomly chosen loci will happen to lie close enough on the same chromosome to show linkage.
One o f the advantages of using lod scores is that they can be added together. The likelihood of two independent sets of data is the likelihood o f the first multiplied by the likelihood of the second, and multiplying likelihoods corresponds to adding logarithms. This means that the lod scores from different families with the same phenotype can be added together.
1.6.4 Multipoint linkage analysis
1.7 Linkage analysis and ADC
The identification of patterns of inheritance in cataract families has led to the possibility of collecting these families to identify genes involved in cataract. The lens as a tissue is made up of one cell type, and many genes have already been described as having a lens-specific or lens-preferred expression. This observation means that there are already good candidate genes for inherited cataract. These genes will be discussed in chapter 3.
Introduction
Table 1.2 Known genetic loci mapped by linkage analysis for ADC.
Disease gene is listed if known.
Locus
Phenotype
Gene
Symbol
Gene
Reference
lp36
Volkmann
CCKEiberg
et a l,
1995
Posterior Polar
lonides
et al.,
1997
lq21
Zonular
Pulverulent
CZP7
Gap junction
alpha 8
Renwick & Lawler, 1963
Shiels
et a l,
1998
Chapter 4 of thesis
2q32-36 Coppock-like
C C IyE crystallin
pseudogene
Lubsen
et al.,
1987
Brakenhoff
et al.,
1994
Chapter 3 of thesis
Congenital
polymorphic
fC C
Rogaev er a/., 1996
Aculeiform
Héon
et al.,
1997
1 3 q ll
Zonular
pulverulent
CZP3
Gap junction
alpha 3
Mackay
et al.,
1997
Mackay
étal.,
1998
Chapter 5 of thesis
16q22.1
Posterior polar
CCDAMaumenee, 1979
Progressive
C/tMEiberg
et al.,
1988
17pl3
Anterior Polar
Berry
et al.,
1996
1 7 q
ll-q l2
Zonular and
Sutural
CCZ^
(3A3/A1
crystallin
Padmaeta/., 1995
Kcoinabiran
et al.,
1998
17q24
Cerulean
Armitage
et al.,
1995
21q22.3
Zonular Sutural
aA crystallin
Litter a/., 199822q
Cerulean
CC/12[3B2
crystallin
1.7.1 lp36 locus
This locus was first identified in 1995. It is a clinically heterogeneous locus with two clinically different phenotypes mapping to it. There are no obvious candidate genes already mapped to lp36.
This locus is known as the Volkmann locus, after the Volkmann family from Denmark. The family with congenital cataracts was first described in the early 1900’s and could be traced back to a Mr. Volkmann, bom in 1730. A description of the family now spanning 10 generations with 426 individuals and preliminary linkage analysis was published in 1992 (Lund et a l, 1992). Linkage was not found to 18 polymorphic blood group and serum markers or to gamma crystallin. The Volkmann cataract (CCV) is characterised by a progressive central and zonular cataract, with opacities both in the embryonic, fetal and juvenile nuclei and around the anterior and posterior Y-sutures. The cataract was transmitted as a dominant Mendelian trait, with a highly variable expression ranging from hardly recognisable opacities in the lens to dense cataracts. A penetrance of 0.90 was calculated from skipped generations in the pedigree.
This investigation was extended on the introduction of microsatellite markers (Eiberg
et al, 1995). After excluding -95% of the autosomal genome using 300 polymorphic
markers in 91 family members, linkage was found to D1S214 (Zmax=4.87). This located CCV in the telomeric region of chromosome lp36 and placed the locus by multipoint in the interval lpter-CCT-(18.2 cM)-DlS214.
Figure 1.3 The lp 36 locus.
Introduction
pter
■D1S243
6 cM
■D1S468
5 cM
■D1S2845
5 cM
. D1S214
T
c c fCTPA
The second phenotype mapping to this region is a posterior polar cataract {CTPA).
The posterior polar cataract is a clinically distinct opacity located at the back of the lens. Because of its proximity to the optical centre of the eye this opacity can have a marked effect on visual acuity. This phenotype is commonly seen in age-related cataract (Klein et al., 1992) as well as inherited conditions such as neurofibromatosis type 2 (Ragge et al., 1995) and some of the retinal degenerations (Heckenlively,
1982).
Linkage analysis was performed on a three generation family of English descent, with ten affected and three unaffected members (lonides et al, 1997). The opacity was bilateral in all cases and consisted of a well defined plaque confined to the posterior pole of the lens that varied from 0.5-3 mm in diameter. After excluding a number of candidate regions, positive lod scores were found with markers from lp36. The maximum two-point lod score was with the marker D1S508 (Z^ax^S.M at 6max^ 0.00). With haplotype analysis the interval was given between D1S2845 and Ipter. The CTPA locus overlaps with the CCL locus (Figure 1.3). Although mapping to the
1.7.2 Gamma crystallin cluster on 2q32-q36
The gamma crystallin cluster has been associated with ADC in humans since the linkage of the Coppock-like cataract (CCL) to the cluster in 1987 (Lubsen et al.,
1987). A mutation was identified in the yE crystallin pseudogene that segregated with the cataract in the original family (Brakenhoff et a l, 1994). The history of this linkage is discussed in chapter 3 (Section 3.3), along with new data refining this locus. Since the original linkage, two other very different phenotypes have been mapped to this region (figure 1.4). The candidate genes for these two phenotypes include the six gamma crystallin genes and the beta A2 crystallin gene.
Figure 1.4 The gamma crystallin locus
_ _ D2S1363
D2S72
- - CRYGl
TNPl
- - D2S128
- - D2S126
CCL
22.2 cM\PCC
cMAculeiform Cataract
34 cM
Families used in the PCC (polymorphic congenital cataract) linkage (Rogaev et al.,
Introduction
periphery between the fetal nucleus of the lens and the equator. The form of the opacity was irregular and looked similar to a bunch of grapes or a lump of cotton. The opacity was located simultaneously in the different lens layers with the colour of the opacity varying from shining crystal-like to snow-white. The cataract was non progressive and non-nuclear.
Linkage was found to the glucagon gene on chromosome 2q. Since the y crystallin cluster mapped nearby, additional markers were then studied. A polymorphic marker in the yA crystallin gene, CRYGl, showed no recombination (Z^ax^ 10.62 Omax^O.OO). Multipoint analysis placed the PCC gene within or near CRYGl between TNPl and
D2S72. No mutation has yet been identified.
A third phenotype mapping to the gamma crystallin cluster is the aculeiform cataract. This phenotype is characterised by fibre-glass or needle-like crystals projecting in different directions but always through the axial region of the lens and originating from the core. Several abstracts (Héon et al., 1997, Billingsley et al., 1997, Billingsley et al., 1998) have documented linkage in three families with this phenotype to 2q32-q36. A maximum two-point lod score of 6.12 at D2S389 was found. A genetic interval of 34 cM flanked by markers D2S1363 and D2S126 has been identified. The most recent abstract reported a region of shared disease haplotype between the two families that could reduce the interval to 7 cM.
1.7.3 16q22.1 locus near Haptoglobin
Two early linkages to the haptoglobin locus (HP) for two different phenotypes have been published. Both of the linkages were performed before the introduction of microsatellite markers. There are no obvious candidate genes in the region.
dominant trait over four generations. When tested with 13 polymorphic blood groups and enzymes as markers, no recombinants were found between CCDN and HP. A lod score of 1.8 was obtained. A later abstract reported a lod score of 2.109 at Omax^O. 10 (Richards e/n/., 1984). This was the second locus identified for ADC.
A second linkage to this locus gave yet another example o f genetic heterogeneity. This progressive cataract (gene symbol CAM) was first described by Mamer (1949) in a very large family, mainly situated in the Koge region, south of Copenhagen. The cataract was autosomal dominant with complete penetrance. The morphology was described as zonular, central, stellate, or with an anterior polar opacity (Mamer, 1949). Mohr (1954) found no linkage with seven blood group systems (including Duffy).
Linkage was found using nine generations of the family with 104 affected and 85 non-affected individuals (Eiberg et al., 1988). A positive lod score was found with
HP (Haptoglobin) of 8.31 at Omax^0.05. For most members CAM followed allele HP*1. HP is located on 16q22, placing the C4M locus nearby (McGill et al., 1984).
Introduction
1.7.4 CTAA2 locus on 17pl3.
Anterior polar cataract is a clinically well recognised opacity located at the front of the lens and represents 3-14% of all congenital cataract (Jaafar & Robb, 1984). It is also associated with other genetic eye diseases including aniridia and Peter’s anomaly. Congenital anterior polar cataract has also been shown to segregate with an unbalanced 3; 18 translocation (Rubin et al., 1994) as well as dysmorphic features, and as an isolated symptom in a balanced reciprocal 2; 14 translocation (CTAAl)
(Moross et al., 1984).
The family used in the linkage to 17pl3 consisted of 28 family members in a 4 generation family with 16 affected individuals. The anterior polar cataract varied in size from 0.5 to 4 mm in diameter and was bilateral in all but one case. The cataract was usually present at birth or developed within the first few months of life, but did not progress. Inheritance was autosomal dominant and fully penetrant. There was no evidence o f other ocular or systemic abnormalities.
Eleven loci known to be involved with cataract were excluded before positive lod scores were obtained with the markers D17S799 and D17S798. Multipoint linkage analysis gave a maximum lod score of 5.2 placing the disease locus (CTAA2) in a 13 cM interval between D17S849 and D17S796. (Berry et al., 1996). There are no obvious candidate genes in the region. This region seems to be a hotspot for ocular disease with at least four retinal diseases mapping to this region. Cone-rod dystrophy, Leber’s congenital amaurosis. Central areolar choroidal dystrophy and Retinitis Pigmentosa all map to 17pl2-pl3 (Kelsell et al., 1997, Camuzat et al., 1995, Lotery
1.7.5 CCZSlocus on 17q ll-q I2
A three generation family (Padma et al., 1995) with isolated autosomal dominant cataract with both zonular and sutural opacities was used in linkage analysis. Zonular cataracts show opacification in a discrete layer of fibre cells whereas sutural opacities show opacification of the sutures. Opacities seen in this family varied from a uniform dense opacity to a collection of fine dots forming a hazy cloud. All affected members showed a zonular cataract that measured 3.5-4 mm in diameter, an erect Y-shaped anterior sutural cataract and an invert Y-shaped sutural cataract. The fetal and embryonic nuclei within the zonular cataract were clear except for a few dust like white opacities.
After excluding Duffy, y crystallins and haptoglobin, glutathione reductase, alpha-A and beta-B2 and B3 crystallins, linkage was found to two markers near the beta- A3/A1 crystallin gene on 17q. Lod scores greater than 3 were found with the markers D17S805 and N FL Multipoint linkage analysis places the locus near
D17S805. The locus was localised to a 17 cM region on 17ql l-q l2 with the crystallin
genes as good candidates.
Introduction
1.7.6 CCAl locus on 17q24
Cerulean cataract (CCA) is an autosomal dominant early onset, progressive cataract characterised by blue or white opacifications in the nucleus and cortex o f the lens and inherited with complete penetrance. A cerulean cataract was first described by Vogt (1922). This type is best described as a developmental cataract as they appear after birth. The opacity progresses throughout the adult lens nucleus and the cortex forming concentric layers.
The family used in this linkage was first described by Kivlin et al., (1985) who excluded linkage to a number of markers. The family of 41 affected and 37 unaffected individuals were later used in a whole genome search for the CCAl locus. Linkage was found to D17S784 (Armitage et al., 1995). Multipoint linkage analysis gave a lod score o f 13.71 for the region flanked by D17S802 and D17S836 mapping
CCAl to 17q24. The gene for the enzyme galactokinase maps to the region and is known to be involved in autosomal recessive cataract (Stambolian et al., 1995) Levels o f the enzyme in this family were found to be normal.
CCAl maps to a 6 cM interval on 17q24, with no other obvious candidate genes.
1.7.7 CRYAA locus on 21q22.3
A 4 generation family with a congenital zonular central nuclear opacity mapped to chromosome 21q22.3 (Litt et al., 1998). Markers D21S212 and D21S171 gave two- point lod scores above 5.0. The a A crystallin gene was known to be flanked by
D21S212 and D21S171 on the yeast artificial chromosome based physical map of
chromosome 21q (Chumakov et al., 1992). Primers were designed from published partial genomic sequence and full length cDNA to amplify the coding regions of the