4140
The Effect Of Helical Size On Uplift Pile Capacity
Dhevi Mulyanda, Maulid M.Iqbal, Ratna Dewi
Abstract: The helical pile as foundation has been widely used for light application load. It consists of helically or multiple shaped plate attached to a central shaft with diameter ranging from small to large in both shaft and helix. When helical pile is installed on proper soil layer, it can resist the load for both compressive and tension load. The sum of capacities gained from each individual helical plate then defined as the total capacity of helical pile. This paper is aim to study the uplift capacity of helical pile on the helical size effect. Uplift loading test were performed on two different types of helical piles, uniformly sized plate and tapered sized plate installed on clay soil soil. Diameter of plate used are 15 cm, 20 cm, and 25 cm spaced far enough apart about S/D < 3 of the largest helix diameters. The results of this study indicate that the rate of capacity is variable, considering the helical size configuration. Various helix diameter attached on the shaft in the helical pile increased the uplift capacity up to 50%. The effect of helical size to uplift capacity is briefly demonstrated on this study.
Index Terms:helical pile, uplift capacity, helical size, uniform sized plate, tapered plate, load test. clay
—————————— ——————————
1
INTRODUCTION
Pile foundation is an important part of structure in transferring the structural load to the bearing ground located at some depth. There are two mechanisms presented to transfer the loads to the layered soil, namely the load distribution on the entire surface and the load distribution through the end points of the piless. Generally, both friction and end bearing have become the supports of the uplift capacity of piles foundation. In pile foundation planted on the soft soil conventionally, the causes of a weighty foundation are the uniformity of the cross-sectional area of the pile along the foundation as well as a large diameter of the foundation itself. Furthermore, the layered soil will be able to hold the uplift capacity relatively deeper if the soft soil is relatively thick. This could impact the use of the long piles foundation as it is an uneconomic condition. Regarding this, a floating type foundation can be used as the alternative. However, a failure relatively arises due to the low friction arisen between the piles and the layered soil. Therefore, a modification on the pile surface can be done to increase the frictional resistance by loading a helical pile installed at a certain distance. The helical pile is defined as a foundation element formed by numbers of helical plates attached to shaft. Perko H.A [1] indicated that the more the number of helixes, the more uplift capacity increased. The shaft shape can be square or circular like other type of pile but its diameter is quite smaller than the normal diameter used in other piles. Kurian and Shah [2] showed that the diameter of the shaft is varied between 50 to 965 mm, while helix diameter varies between 150 to 1219 mm. The piles could be installed to any depth and at any angle provided the tolarable soil condition [3]. Although helical piles have been used as supports for a long time, there have been several studies about helical pile on their performance in compare to other piling industry [4].
Therefore, more study on characteristics and compile records of helical piles behavior and performance are needed to be observed. Research about helical pile was carried out both experimental test and numerical modelling. Javad[4], Demir[5], Fatnanta[6], Hamdy et al[7] showed that there was a greater bearing capacity on the helical pile pile compared to the non – helical pile. The helical geometry played a big role in affecting the bearing capacity of helical pile. The distance of helical pile, the diamater of helical pile, and the configuration are those factors affected. The percentage of pull out capacity was reported by Sakr[8] about 80% from the tense capacity or when the ultimate pull out capacity met the 8% deflection of the biggest number of helical plates plus the number of elastic conversion value [9]. Based on studies, there were two theoritical methods to predict the pull out capacity of helical pile, namely cylindrical shear and individual bearing. The cylindrical shear is occurred if helical plates are close enough to each helical plate. All plates will be working together formed a cylindrical-shaped between the uppermost and lowermost plate. The bearing capacity is simply the combination of the shear resistance along the entire cylinder of soil and the bearing capacity on the base of helical plate. As the plate spacing is increased, the soil flow mechanism becomes gradually localized around each individual plate. Each helical plate is able to act individually as end bearing holder. Therefore, the bearing capacity of the helical pile foundation is the sum total of individual capacity from each plate. In case of this mechanism is often called individual bearing. Mitsch and Clemence [10] stated that the estimation of ultimate pile capacity is depend on the helical spacing, the pile embedment, and the soil condition. While Zhang[11] stated that the ultimate pile capacity is the embedment ratio (H/D) and the spacing ratio (S/D). The spacing ratio is defines as the ratio of helix plate and the average diameter of the plates. In the literature, the spacing ratio affect the failure mechanism. The change from the cylindrical shear method to individual bearing method occurs at a spacing ratio of 3. Tappenden et al[12] accentuate that the utilisation of the cylindrical shear model were spaced at 1.5D. Similary, Rao [13] argue that a spacing ratio under 1.5D is categorized into cylindrical shear method. However, Lutenegger[14] shows that up to a spacing ratio of 2.25, the cylindrical shear method is seen to control the pile behaviour, whereas the ratio more than 2.25 is controlled by the individual bearing method. Conversely, Nasr[15] suggests that a spacing ratio greater than 2 should be defined as the individual bearing method. From the aforementioned review, it is clear that the geometry ————————————————
• Dhevi Mulyanda is master student in Civil Engineering, Faculty of Engineering, Sriwijaya University, Indonesia. Email : [email protected]
• Maulid M. Iqbal is Lecture in Civil Engineering Department, Faculty of Engineering, Sriwijaya University, Indonesia. Email : [email protected]
4141 parameter affected the bearing capacity of the pile. In view of
this, an experimental work using helical piles in soft clay has been carried out. The details of which are presented in the next section.
2
EXPERIMENTAL
WORK
In this experimental study, it has been attempted to develop helical piles suitable for clay considering the helical size. The uplift capacity of helical piles has been measured to study the behaviour of helical pile under different sequences of helix geometry.
2.1 Soil Parameter
The soil used in this research were taken from Kp. Pulo Gintung, Tangerang. The soil parameter obtained in this study was investigated using CPT and boring. Two points of CPT was tested until the soil resistance reached a maximum amount of 250 kg/cm2 and a point of boring was bored into 6
m of depth. Based on CPT results, the soil resistance of two points are in depth of 10.40 m. While according to boring results, the top of 2.00 m is reddish brown clay with organic matters and high plasticity that extends to 5.00 m of thickness. Underlaying the clay layer is a clayey silt with some of fine sand that extends to 6.00 m. In addition, the Standard Penetration Testing (SPT) was also conducted. The SPT number ranging between 8 to 15 for soil along tested depth.During boring, undisturbed samplings were taken to identify soil paramater in laboratory. Samples were taken in depth of 2.00 m – 2.50 m and 4.00 – 4.50 m. The soil properties test is summarized in Table 1.
Table 1. Soil properties
Properties UDS - 1 UDS -2
Unit Weight 2.631 2.617
Wet Density 2.6 2.09
Water Content (%) 51.59 51.28
LL (%) 81 91
PL (%) 40 34
IP (%) 41 38
Gravel (%) 0 0
Sand (%) 13.4 3.4
Silt (%) 20.2 14.2
Clay (%) 66.4 82.4
Clay <0.075 (%) 60.4 74.7
From the table above, the average of plasticity indices is measured 40%. The average of natural water content is 51%. The soil used for testing (-2.5 m depth) consists of 66.4% clay, 20.2% silt, and 13.4% sand. Clay fraction < 0.075 m is 60.4%. Through a detail test accordance with ASTM procedure, the soil used in this study could be classified into clay soil.
2.2 Pile Parameter
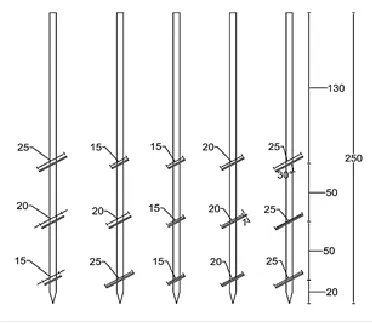
The investigations are conducted on helical pile fabricated from steel pipe round-hollow with diameter 50 mm for shaft and 4 mm in thickness of a plate used as helix plate. The helix attached to shaft has diameter of 150 mm, 200 mm, and 250 mm. It is installed respectively with height of 2500 mm on clayey soil. In each pile, three plates are attached from top to
bottom as D1, D2, and D3. The plate are spacing about S/D ≤ 3 of largest helix diameter or minimum distance of 500 mm to each helix. The detail of helical piles used are given in Fig.1. By varying the diameter of helix plate, it is possible to create optimum configuration in resisting the uplift capacity.
If the helical pile is identified as U3S – 15, this means the pile was attached with 3 plates with the same plate diamater used from top section to bottom section with a distance between each plate of 50 cm, as it can be observed on Fig 1. If the helical pile is mentioned as U3TS – 252015, this means the pile has 3 plates with the top section use large diameter (25 cm) , the middle section use medium diameter (20 cm), and the bottom section use small diameter (15 cm). Each plate has a gap of 50 cm. The recapitulation of helical pile models can be seen in Table 2. The general experimental set-up for uplift test is shown in Fig 2. The piles were installed using a rotating drive head manually. The test pile were installed approximately 2.5 m length. The reaction system for the test pile was composed from two helical piles of 2.5 m length. The reaction piles were spaced at 1.0 m centre to centre or 4 times the helix diameter to minimize interaction between test pile and reaction piles.
Table 2. Nomenclature of helical pile
Helix Diameter (top to bottom) (mm)
Interhelix Spacing (mm)
Shaft Diameter
(mm) Pile Identity
150; 150; 150 500 50 U3S - 15
200; 200; 200 500 50 U3S - 20
250; 250; 250 500 50 U3S - 25
250; 200; 150 500 50 U3TS - 252015
150; 200; 250 500 50 U3TS - 152025
In reaction system, two piles was located on each side of main beam. During loading, the test load was transferred to the reaction piles through the main reaction beam using steel bars with 16 mm diameter and 1.5 m length. The head of test pile
4142 then covered by 200 x 200 x 40 mm steel plate. It was placed
centered on the test pile and welded. On the top of the plate, a 5T calibrated hydraulic jack was placed to measure the load that applied to the test pile. Then uplift loads and movements were recorded until failure.
2.3 Loading Procedure
Load testing of the helical pile was conducted in accordance to ASTM D 3689-07, following the Quick Load Test Method. The following specific test procedures using Procedure A for Quick Tests for piles under uplift loads were applied:
a. The load was applied in increment of 5% of the anticipated failure loads with a constant time interval for 5 minutes. Monitoring movements was recorded using four dial gauges at time interval 0 minutes, 2.5 minutes, and 5 minutes. The pile was loaded until failure
b. When the pile reach the failure load, maintain the load for longer period of time about 60 minutes with a constant time around 10 minutes.
c. Unloading test pile in increments of 25% until reach 0% with same monitoring intervals as for loading. When reaching 0% loads, the load monitoring was maintained for 60 minutes to assess the rebound behaviour.
During the test, the settlement is noted then the result is represented as a load – settlement curve on graph. Methods for determining the ultimate pile capacity from a load test are Davisson’s criterion, Mazurkiewich’s method, and Chin’s method. The criterion to estimate the pile capacity for each method are also discussed in this study. The Davisson criterion establishes a load through an equation which corresponds to the total displacement being equal to the elastic deflection of the pile. Chin assumes that the relationship between load and settlement is hyperbolic so Chin’s method is affected by the limit of loading. Chin’s method also considered factor of safety to assess the pile capacity. Another method is Mazurkiewich criterion. This method is based on the assumption that the load-settlement curve is approximately parabolic. To estimate the pile capacity, a series of equal pile head settlement is chosen using equal intervals and 45-degree line is drawn to intersect with the next
vertical line running through the next load point. The intersection of this line defines as the ultimate load.
3
RESULT
AND
DISCUSSION
The data obtained from testing then represent as a load – settlement curv. The results of field data for each type of helical pile are shown in Fig 3.
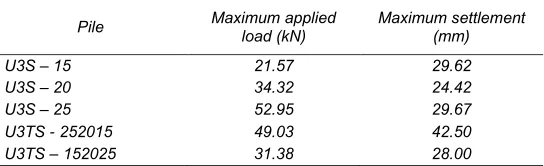
In Fig 3, a typical load - settlement curve obtained from the test generally shows three distinct regions: initial linear-elastic region; transition nonlinear region where the settlement is largely disproportional to the load increment; and final linear region that shows a small slope (reduced stiffness). The onset of failure is located somewhere near the start of the nonlinear region. It is common in the helical pile industry to use a failure criterion equal to 5%D for helix diameter greater than 610 mm and 10%D for helix diameters less than 305 mm or at the plunging failure, whichever occurs first. For the piles used in this test, a failure criterion might slighlty different. The acceptable displacement for all piles is limited to 10%D. The maximum applied load and settlement for all piles are summarized on Table 3. The maximum uplift load is noted ranging from 21.57 kN to 52.95 Kn. The maximum settlement varies from 24.42 mm to 42.50 mm.
Table 3. Summary of loading test
Pile Maximum applied load (kN) Maximum settlement (mm)
U3S – 15 21.57 29.62
U3S – 20 34.32 24.42
U3S – 25 52.95 29.67
U3TS - 252015 49.03 42.50
U3TS – 152025 31.38 28.00
The curve above is the result of field test which is need to be interpreted using some methods to get the ultimate uplift capacity. A representative curve using Davisson method is presented in Fig 4.
Fig. 2. Typical setup for uplift load test
4143
Fig. 4. Estimation load of U3S – 15 using Davisson
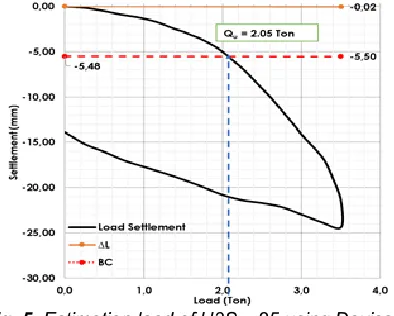
Fig. 5. Estimation load of U3S – 25 using Davisson
From Fig 4, it shows the offset limit criterion crosses the load at 1.09 ton. It also defined that acceptable gross movement equals 10% of the diameter helix. A similar estimation load criterion was obtained for other piles. Like the interpretation of U3S – 25 which is presented in Figure 5. It shows the uplift capacity is about 2.05 ton with the gross movement equals to 10% of the diamater helix. Each helical pile will shows a different settlement even the failure criterion which is identified as 10% of helix diameter is similar. It indicates that displacement of helical pile are taken to very high values. The ultimate uplift capacity of pile which is interpreted using Chin’s method is presented in Figure 6. The ultimate load estimation is calculated by dividing the slope values on the equation obtained on the curve. For U3S – 25, the slope value is 0,1538 so the ultimate uplift capacity is 5.00 ton.
Fig. 6. The ultimate load using Chin’s method
The interpretation using Mazurkiewicz suggested that the ultimate load estimation based on the assumption that load – settlement curve is approximately parabolic. The interpretation result of the U3TS – 252015 is presented in Figure 7.
Fig. 7. The ultimate load estimation using Mazurkiewicz
The equal pile head settlement lines are arbitrary chosen using equal intervals and the corresponding loads are marked on the abscissa, as shown in Figure 7. Based on the assumption, the ultimate load estimation is 4,91 ton. All methods stated above will be applied to all pile load test. The recapitulation results of interpretation are shown in Table 4.
Table 4. Summary interpretation of piles
From Table 4 above, it can be seen that Davisson’s method tend to be conservative compare to others method. The result of Chin always tend to be larger than the test load. For this reason, the allowable load must be divided by a factor of safety, 1.2. While the ultimate load values from Mazurkiewich are almost similar to Chin’s method. In general, the predicted uplift capacities using Chin and Mazurkiewicz are fairly close to the field result (Table 3). In this study, parametric analyses were also performed. The objective is to understand how variations in helix geometry affect the uplift capacity and find the optimum configuration for spesific study cases. The specific parametric analyses are given below.
3.1 Helical Pile Diameter
Variation in the diamater of pile were simulated in two ways, piles with uniformly sized plates and piles with diameters decreasing with increasing depth (tapered plates). Table 5 summarize the uniform and tapered plate configuration respectively along with the capacities to Chin’s method.
Table 5. Plate configuration and uplift capacity
Piles Qult by Chin
U3S – 15 2.26
U3S – 20 3.41
U3S – 25 5.00
Piles Ultimate Uplift Capacity (ton)
Davisson Chin Mazurkiewicz
U3S – 15 1.09 2.26 2.02
U3S – 20 2.05 3.41 3.26
U3S – 25 3.20 5.00 5.07
U3TS – 152025 2.13 2.74 2.96
4144
U3TS – 152025 2.74
U3TS – 252015 4.48
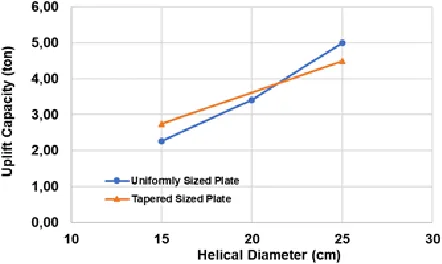
It can be observed that the uplift capacity increases as the diameter helix increases. The increase of uplift capacity for piles with uniformly plates ranges from 2.26 ton to 5.00 ton, while for tapered plate configuration, the ranges of uplift capacity is 2.74 ton to 4.48 ton. The data from Table 4 is then plotted in Figure 8 with linier fitting to indicate the relationship between helix diameter and uplift capacity. It shows that increase in uplift capacity with diameter is virtually linear.
Fig. 8. Comparison between both configuration
Figure 8 also compares the uplift capacity for both configurations. It shows tapered configurations expected to produce higher capacities due to less disturbance during installation. However, the unknown level of disturbance was not presented during the experimental. A possible explanation for why tapered configuration could be much optimum than the uniform configuration is due to the efficiency of helical plate located on the top and the bottom of the pile. The position of these plates are subjected to higher stress while the middle plate is moderately loaded. Between both helices, the top helix was much more loaded than the bottom helix. The greater helix diameter, the larger angle of local failure tends to increasingly accommodate the soil mass. Therefore, the pile U3TS – 252015 produces higher load than U3TS – 152015. As the diameter of helix increases, it should be expected that the distribution load between the shaft and helix changes. The contribution of shaft and helix may be different depending on the failure criterion of ultimate capacity. If the ultimate capacity for U3S – 15 is defined at relative displacement of 10% of helix diameter, the ultimate capacity will be obtained 2.26 ton and the shaft load is only 0,26 ton, so the helix contributes 2.06 ton. The calculated distribution of load for test pile is shown in Table 6.
Table 6. Distribution of uplift capacity
Pile Shaft Helix
U3S – 15 0.20 2.06
U3S – 20 0.16 3.10
U3S – 25 0.16 4.91
U3TS – 152025 0.14 2.82
U3TS – 252015 0.22 4.69
The results from table above shows that the helix plate gives the significant contribution to the pile capacity. Around 90% of the total uplift capacity is affected by helix interaction between
soil. Furthermore, the interaction between helical plates can affect the failure mechanism that will be discussed later.
3.2 Interhelix Spacing Ratio
In this analysis, the failure mechanism model on helical piles is greatly affected by the spacing ratio. The spacing ratio (s/D) is defined as the spacing between helical plates divided by the diameter of the lower helix. The ratio of the pile is known between 2 and 5. The effect of the spacing ratio in uplift capacity is presented on Fig 9.
Fig. 9. The effect of s/D to uplift capacity
The figure shows that the greater the ratio s/D, the smaller the uplift capacity of the pile. At a distance of s/D < 3 (s/D = 2.0 – 2.5), the soil mass trapped between the plates causes the soil to be more rigid so that the mechanism of shear failure model will be occurred. At a distance of s/D = 3, the soil mass trapped between the plate is not rigid enough so that the working shear stress is concentrated closer to the plate. It causes the failure mechanism occurred is the transition of cylindrical shear to individual bearing. That causes the failure mechanism that is formed is the transition of cylindrical shear to individual bearings.
4
CONCLUSION
Based on the experiment and subsequent discussions, the conclusions are as follows:
(i) There is a significant impact on variation of helical size to uplift pile capacity.
(ii) The uplift capacity increases as the diameter helix
increases. The relationship between this two parameter is virtually linier. The uplift capacity of U3S – 25 will produce higher capacity than the uplift capacity of U3S – 15 and U3S – 20.
(iii) The tapered configurations produces higher capacities than uniform size plate. It is due to the efficiency of helical plate located on the top and the bottom of the pile.
(iv) The uplift capacity is also affected by the spacing ratio. The greater s/D, the smaller the uplift capacity. The closer the distance of each plate, the greater uplift capacity will be obtained.
5
REFERENCES
4145 [2] Kurian N.P., Shah S.J. 2009. Studies on the Behavior
of Screw Piles by The Finite Element Method. Canadian Geotechnical Journal., 46, 627 - 638. [3] Bushra S. Albusoda., Hassan O. Abbase. 2017.
Performance assessment of single and group of helical piles embedded in expansive soil. International Journal of Geo Engineering.
[4] Javad Khazale., Abolfazl Eslaml. 2016. Behavior of Helical Piles – As a Geoenvironmental Choice By Frustum Confining Vessel. Advances in Science and Technology Research Journal Vol. 10, No. 31, Sept 2016 pg 8 – 22.
[5] Demir Ahmed., Ok Bahadir. 2015. Uplift response of muti – plate helical anchors in cohessive soil. Geomechanics and Engineering, Vol. 8, No. 4 (2015) 615 – 630.
[6] Fatnanta F., Satibi., Muhardi. 2015. Bearing Capacity of Helical Pile Foundation in Peat Soil from Different Diameter and Spacing of Helical Plates. IOP Conference Series : Material Science and Engineering, Volume 316, Conference 1
[7] Hamdy H.A. Abdel-Rahim. 2013. The Compression and Uplift bearing capacities of helical piles in cohesion less soil - Journal of Engineering Sciences, Vol.41, No.6.Pages. 2055-2064.
[8] Sakr.M. 2010. High Capacity Helical Piles – A New Dimension for Bridge Foundations. Proceedings of 8th International Conference on Short and Medium Span Bridges, Niagara Falls, Canada.
[9] Livneh B., El Naggar MH. 2008. Axial testing and numerical modelling of squrae shaft helical piles under compressive and tensile loading. Canadian Geotechnical Journal 45 (8): 1142 – 1155
[10]Mitsch, M.P., Clemence, S.P., 1985. The uplift capacity of helix anchors in sand. American Society of Civil Engineers, New York, pp. 26–47.
[11]Zhang, D.J.W. 1999. Predicting capacity of helical screw piles in Alberta Soils. University of Alberta, Edmonton, Alta
[12]Tappenden, K., Sego, D., 2007. Predicting the axial capacity of screw pilesinstalled in Canadian soils. In: Proceedings of The Canadian GeotechnicalSociety (CGS) Conference, OttawaGeo 2007, pp. 1608–1615 [13]Narasimha Rao, S., Prasad, Y.S.V.N., Shetty, M.D.,
1991. The behaviour ofmodel screw piles in cohesive soils. J. Soil Found. 31 (2), 35–50.
[14]Lutenegger, A.J., 2009. Cylindrical shear or plate bearing? Uplift Behavior of multi helix screw anchors in clay. In: Comtemporary Topics in Deep Foundations. American Society of Civil Engineers, USA, pp. 456 – 463.