U N IV E R S IT Y C O L L E G E L O N D O N
MANAGING SPACE UTILISATION
By
G A R Y S P R IN G
A D IS S E R T A T IO N S U B M IT T E D IN P A R T IA L F U L F IL M E N T O F T H E
R E Q U IR E M E N T S F O R T H E A W A R D O F T H E D E G R E E O F M A S T E R O F S C IE N C E
T H E B A R T L E T T S C H O O L O F G R A D U A T E S T U D IE S
ProQuest Number: U642170
All rights reserved
INFORMATION TO ALL USERS
The quality of this reproduction is dependent upon the quality of the copy submitted.
In the unlikely event that the author did not send a complete manuscript and there are missing pages, these will be noted. Also, if material had to be removed,
a note will indicate the deletion.
uest.
ProQuest U642170
Published by ProQuest LLC(2015). Copyright of the Dissertation is held by the Author.
All rights reserved.
This work is protected against unauthorized copying under Title 17, United States Code. Microform Edition © ProQuest LLC.
ProQuest LLC
789 East Eisenhower Parkway P.O. Box 1346
TABLE OF CONTENTS
ACKNOWLEDGEMENTS
ABSTRACT
LIST OF FIGURES
Chapter
Page
1
INTRODUCTION
1.1 Background 1
1.2 Scope and Purpose o f the Study 2
1.3 Structure 6
1.4 M ethodology 6
2
CONCEPTS OF INITIAL ALLOCATION
2.1 Basic space requirem ents 9
2.2 Sources o f space standards 12
3
CONCEPTS OF REALLOCATION
3.1 Types o f and reasons for change 19
3.2 Space m anagem ent 21
4
CURRENT PRACTICE
4.1 Space standards 27
4.2 A udit 28
4.3 U tilisation 28
4.4 Planning for change 29
4.5 Space m anagem ent 29
4.6 A bility to respond to change 30
5
FUTURE PRACTICE POSSIBILITIES
5.1 Change 31
5.2 Space U tilisation 31
5.3 Tim e U tilisation 33
5.4 D irection o f change 34
5.5 Sum m ary and conclusions 37
APPENDICES
A Extract from Exem plar Estate Strategy
B Backgrounds o f 8 organisations and opinions o f Interview ees C Blank structured interview
ACKNOWLEDGEMENTS
The author would like to form ally acknow ledge his thanks to the follow ing people and groups for their help, forbearance and guidance during the research, preparation and presentation phases o f this dissertation:
My Bartlett tutors; Bev N utt for his inside know ledge and constant application o f pressure and D avid Kincaid for his real w orld viewpoint.
All eight interview ees for giving up their tim e and opening up their thoughts.
My em ployer for providing the opportunity and tim e to study,
A B ST R A C T
A n investigation o f the challenges fa ced by Facilities Management in
occupied buildings when trying to match existing physical supply and
varying demand fo r space. It reviews the historical basis o f space
LIST OF FIGURES
Page
1.1 O ffice Utilisation 4
1.2 Elem ents o f Organisational Support 4
1.3 C hanging utility values o f a facility over tim e 5
1.4 M ethodology utilised 7
1.5 Key questions 8
2.1 Status and space standards 9
2.2 Space budgets for two firm s o f differing standards 11
2.3 Total space budget 11
2.4 Schedule o f A ccom m odation for an E.N.T. clinic 13
2.5 Treatm ent Room plan 14
2.6 N otional layout plan for an E.N .T. clinic 15
2.7 Traditional space standards 17
3.1 Sources o f change 19
3.2 Reasons for change 20
3.3 Role o f the A ccom m odation M anager 21
3.4 Supply and dem and o f facilities space 22
3.5 "Pendulum Forces" : Finance v ’s O perations 23
3.6 Space m anagem ent model 24
3.7 Typical office w orkplace footprints 25
3.8 Influences on Space m anagem ent 26
5.1 Results o f office user survey 32
5.2 Some directions o f change in space utilisation m anagem ent 35
5.3 Relative m erits o f in-house space m anagem ent 36
C H A P T E R O N E
INTRODUCTION
UJ
.1/
■ ( 3 3 o ~n g m ■ f l i - Œ ^lid
W i n s f o r d C o t t a g e H o s p i t a l . Ha l wi i l J u n c t i o n N o r t h I ( A r c h i t e c t C F A V o y s e y 1 8 9 9 )
CHAPTER ONE
INTRODUCTION
1.1
Background
The allocation, configuration and rearrangem ent o f workspaces is som ething that individuals undertake for them selves as an integral part o f their hom e life w ith quiet acceptance. The location o f activities; the decision o f w here to read a new spaper, prepare a meal, w here to eat and socialise is resultant on an individual’s investm ent decisions w hen selecting their home.
The same is true o f an organisation; investm ent decisions determ ine initial allocation and change through the period o f occupation. The process is more com plex but the principles are the same. The difference is that the acceptance o f com prom ise is less readily accepted by the same individuals w hen imposed by others in the workplace.
Com prom ise is a natural accom panim ent to change. In the case o f an individual, teaming up w ith a spouse, plus the frequent consequence o f children, means that the initial m odest space allocation becom es im practical and, w ithout space to expand, the fam ily unit moves to a new location and takes a fresh set o f investm ent decisions about space utilisation. The parallel o f an organisation in its initial grow th phase is similar. As revenue increases w ith increased business, the need for larger prem ises requires change at the w orkplace. Unless adjoining space is available, the organisation w ill relocate to larger and usually better quality prem ises.
It is at this stage that the parallels diverge. The couple in the fam ily unit will usually chose to stay in the sam e hom e when the children leave it because they enjoy the surplus space and the flexibility to be able to accom m odate their children and friends for
occasional visits. There are, o f course, m any other factors involved in dom estic housing w hich explain why people d o n ’t necessarily relocate w hen their children leave home. The
couple’s income is usually at its highest and the costs o f occupation are less im portant than the com forts o f an established hom e.
A com m ercial organisation is rarely able to afford the luxury o f "two spare bedroom s"; a building capable o f accom m odating tw ice as many personnel as regularly use it. External com petition and pressures require that space usage is optim ised w ithin the b rief o f current need and future expectations. Stakeholders require that overheads are reduced in order that returns are greatest. The individual answ ers to their own conscience about the proportion o f income spent on accom m odation and the enjoym ent o f its relative qualities. W hen this process transfers to the w orkplace, a good balance is essential to contribute to the viability o f the organisation and appropriate working conditions are im portant to m aintain staff m orale and perform ance.
1.2
Scope and purpose of the study
The subject o f M anaging Space U tilisation has been chosen for investigation because although it appears that com paratively little has been published on how to effectively manage the space occupied by an organisation, the process has the potential to restrict an organisations ability to respond to change in a cost effective m anner. Logical theories o f how to determ ine initial allocation have been published (reviewed in C hapter 2) but the process o f how to m aintain utility and utilisation in the post occupation period appears to be under reported. This m anagem ent process is usually an in-house, revenue funded activity carried out to avoid significant disbeneflts and may be view ed by the organisation as an overhead that yields little benefit. The value o f a property, or facility in an
organisation lies in its utility and ability to support business needs. The average return on capital invested in property in the 5 years to 1996 was 8.5% com pared w ith 16.1% on the U.K. equities m arket (1). As a result, Ernst & Young is advising businesses to provide their space through leasehold rather than freehold properties. This approach runs counter to the current preference for ow ning and occupying property.
that part o f the organisation. These three processes can be high profile with dem onstrable before and after perform ance characteristics; made clearer by a lack o f hum an and fiscal investment in the old space during the gestation period o f the new scheme. Such
expenditure can be justifiable to an organisation using cost : benefit analysis. It can also be used as a vehicle for change and thus serve alternative agendas. M anaging space utilisation can appear to be an unglam orous, low profile activity, unsuited to the
involvement o f external consultants and thus a topic unpublished because there is little to be gained by the usual stock o f authors and little researched for the same reasons.
Healthcare and O ffice accom m odation in the Public and Private sectors have been selected for consideration to see if best practice guidelines can be established.
Public Sector Healthcare (the N .H .S.) is the largest single em ployer in the U.K. with approxim ately 1 m illion staff. It covers 20,000 ha in England. Land and buildings w ere valued at £18,000m in 1991. (2) Private Sector H ealthcare is often held to be a good exam ple to the public sector. M ost hospital wards aim at occupancy levels o f near 100%. (Occupancy levels vary according to the length o f stay o f the m edical speciality).
Occasionally levels o f over 100% are som etim es achieved because beds are used by day patients w hilst the overnight occupant is receiving treatm ent elsew here w ithin the H ospital or a new patient is adm itted to the bed on the day that the old patient is discharged. 90% time utilisation equates to 365 days x 24 hours x 0.9 = 7884 hours per year.
Office work now involves about h a lf o f the population in w estern econom ies. (3)
IOOt
9 0 . .
% % :
a v a i l a b i l i t y 6 0 . . 6 0 . . 4 0 . . 3 0
20. .
10. . 0 100 71 6 3 21 16
1. OHice availa bility
A fter allow ing fo r;
2. Five day w o rk in g w e e k
3. A n n u a l/ bank holidays
4. Eight hour a day o p e ra tio n s
5. L u n c h / illness etc
6. S o c ia l/o rg a n is a tio n a l a c tiv itie s .
Leaving real releva n t work at 5%
Fig 1.1 Office Utilisation
There appears to be an emphasis in space planning literature on reducing the space allocation per workstation and the total number o f workstations available if the workforce is mobile and thus driving down occupancy costs. One issue this paper seeks to address is "What level o f capacity do organisations consider desirable in order to avoid lost
opportunity costs by not being able to respond adequately to changing circumstances? - Is it linked to the stability o f the market being operated within?"
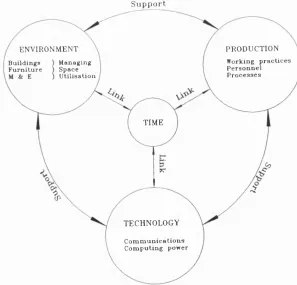
S u p p o r t
Fig 1.2
PRODUCTION
W o rk in g p r a c t i c e s P e r s o n n e l P r o c e s s e s
ENVIRONMENT
M a n a g in g S p a c e U til i s a t i o n B u ild in g s
F u r n i t u r e
TIME
TECHNOLOGY
C o m m u n i c a t i o n s C o m p u tin g p o w e r
An organisation is supported by the physical environm ent it occupies, the technology available to it and the method by w hich it deploys hum an resources to deliver the end product required. Figure 1.2 The connection betw een these elem ents is tim e and tim e equates to change. W orking practices evolve over tim e to incorporate new technologies. Such change places different requirem ents on the physical environm ent.
Element
Effect
Tim e = change
Environment
adjustm ent / churn (short term ) m odification (long term )
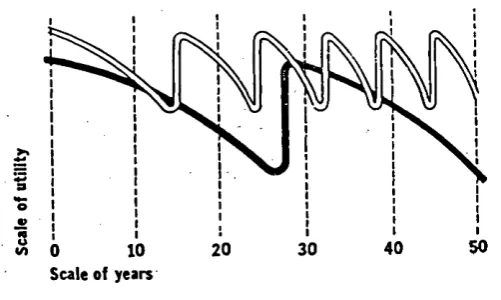
Perform ance w ithin a space is dependant on how effectively the environm ent supports the task being undertaken. Tasks and occupancy change over tim e and therefore perform ance usually declines as functionality is lost. There are three tiers o f design w hich contribute to a building’s utility; shell design, scenery design and set design.(5)
Shell
refers to the "permanent" structure, cores and service routes.Scenery
describes the building services, ceilings, partitions and furniture system s.Set
refers to the w ay in w hich the m anager o f the facility arranges the scenery to m atch the current needs o f the occupants.Scale of years
O ffice scenery utility
-replacement at shorter intervals w ith
each new lease
B uilding shell utility with refit after 25
years
Successful m anagem ent o f churn and small scale adjustm ent should m aintain effectiveness and thus prolong the period until significant m odifications are required to a workplace. These m odifications can be in the form o f reconfiguration, refurbishm ent and relocation, often in the ascending order o f im pact upon the organisation. If change is managed successfully, an organisation should be better able to decide w hen it wants to invest to suit its ow n circum stances rather than being forced to com m it at an inappropriate time.
1.3
Structure
The analysis and findings o f this study are presented in three parts:
Part 1 Chapters 2 and 3 describe theoretical m ethods o f allocating and reallocating space in order to m eet business needs.
Part 2 C hapter 4 discusses current practice, as established through interview s w ith practitioners in contrasting sectors.
Part 3 Chapter 5 describes conclusions draw n from the interview process and suggests some potential changes in approaches to m anaging space.
1.4
Methodology
Three key questions present them selves for consideration:
H ow should space be m anaged? (Past theory) H ow is space managed? (C urrent practice) H ow could space be better managed? (Future potential)
Initial investigations into the subject did not answer the above questions. Research was therefore needed. O f the two basic approaches to research,(7) Scientific / Positivistic and Interpretive / Q ualitative, the latter was though most appropriate.
Interpretive / Qualitative > Enquiry in the field o f interest
> Data collection
> A n alysis & H ypothesis generation
> Focused enquiry and data collection
> A n alysis and cy cle repeats
Research strategies can be described under three headings; Experim ent, Survey and Case Study, equating to Exploratory, D escriptive and Explanatory respectively. The case study approach was selected as being m ost appropriate for the purposes o f this paper because o f the understanding o f a range o f current practice that w ould em erge from discussion with individuals in the organisations studied.
In order to be able to com pare and contrast exam ples from O ffice and H ealthcare Facilities M anagement, it was decided to interview tw o practitioners from public and private sector organisations for both fields; giving a total o f eight. Tw o exam ples o f each sector were considered necessary to im prove statistical representation.
R E S E A R C H T H E O R Y P R A C T IC A L A P P L IC A T IO N S O U R C E / A C T IV IT Y
Literature R eview Enquiry /
Data C ollection
A nalysis &
H ypothesis Generation
Sector selection & Interview structure
Focused enquiry Interviews
A nalysis A nalysis
Findings C onclusions
Fig 1.4 M ethodology utilised
FEM lecture notes
UCL Papers / FEM M sc D issertations Published B ooks
A rticles in professional journals
Target areas o f study
Formulate interview questions to test lit. review
2 F. M anagers x sector x accom m odation type
Establish w hether issu es addressed Draw out best practice
Six topics were developed in order to extract appropriate inform ation from the interview s to inform the data collection process;
Background information on the organisation
Space Standards
A u d i t
U t i l i s a t i o n
Planning
Space M anagem ent
R esponse to change
D iscussion topics
What are the source(s) o f your space standard(s)? H ow w ould you describe your use o f space standards? H ow rigorously are standards applied?
H ow long have the current space standards been in place? H ow are the space standards view ed?
H ow are records kept o f space occupation?
Are Space Audits conducted? What is the frequency o f Audit?
What is the your approach to Space Auditing? Is the organisation activity / headcount changing? Is the area o f the estate changing?
H ow are expectations o f space utilisation expected to change? H ow is % space utilisation changing?
H ow is % tim e utilisation changing?
What factors drive change in space utilisation?
D o you have a formal Estate Strategy? T ypically how far ahead do you look?
D o you have contingency arrangements to address change?
W ho is responsible for the configuration o f space Is there anyone responsible for m anaging utilisation? Are there formal space charging system s?
H ow is the space used by a group funded?
What are considered to be key indicators to major change?
H ow foreseen have recent space changes been? H ow formal are your provisions for change? W hat % w ould be desirable to allow for change? What % does the organisation actually keep for change?
W hat w ill happen regarding space utilisation? What should happen regarding space utilisation?
Fig 1.5 Key Q uestions
C H A P T E R 2
CONCEPTS OF INITIAL ALLOCATION
2.1 Basic S pace R e q u ire m e n ts
Every organisation starts its existence with some sort o f decision on w here it w ill operate from. This is inevitably on a small scale because o f the em bryonic nature o f the
organisation but as business expands, a tim e com es w hen a significant num ber o f staff will transfer from w hat has becom e an overcrow ded space into a "new" facility; either purpose built, speculatively built or previously occupied. A series o f decisions have then to be taken to determ ine how big the new facility should be. In sim plistic term s, the space required for an organisation to perform a task can be defied as:
workspace output x time
=number o f workspaces
output required
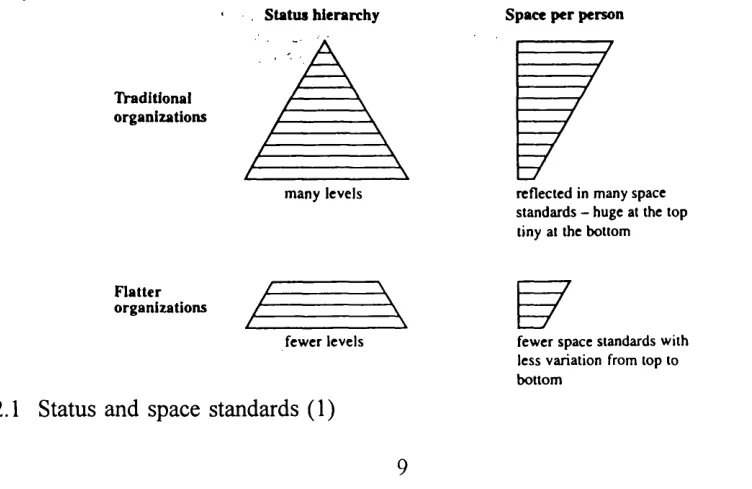
The total area required is a com bination o f the size o f the w orkspace(s) appropriate for the tasks and the num ber o f each type o f workspace required. The area o f an individual workspace is a com bination o f functionality and status. These factors contribute to the establishm ent o f space standards in some organisations, typically grow ing in area as seniority increases.
IVaditional organizations
Status hierarchy
m a n y lev els
Space per person
re fle c te d in m any space sta n d a rd s - huge at the to p tiny at th e b ottom
Flatter organizations
fe w e r lev els
Fig 2.1 Status and space standards (1)
An organisation must be able to state the type and number o f w orkplaces it requires to meet its current and future needs in order to for a space budget to be calculated. Purpose designed buildings should be able to exactly match the space budget. H ow ever, existing buildings require a percentage "fit Factor" to be applied in order to com pensate for the physical characteristics o f a building that has been built to address the requirem ents o f a different brief. It can be argued that a % factor for flexibility should be added to a design brief to allow for unknow n change in order that a facility can support the organisation over time. This % w ould apply to planning grids, structural capacities and layout as well as building services and their routes through the building.
A benchm arking survey o f banking and non-banking I.T. departm ents (2) found that despite the vast m ajority o f respondents saying that they used space standards and form al procedures for allocating space, only 43% o f banks and 25% o f non-banks claim ed to have a w ritten m anagem ent strategy. The survey also found that approxim ately h a lf o f the organisations recognised the need to control space by the use o f space standards. A pproxim ately h a lf did so by applying a universal footprint and an increasing num ber allocated space on the basis o f jo b function rather than organisational grade.
Flexibility o f layout in open plan offices has been available for som e tim e through the use o f raised floors to distribute building services. Additional capital costs are offset by reduced churn costs per person moved. Such flexibility is possible in healthcare buildings. N ew pathology laboratories at G reat O rm ond Street Hospital have been designed w ith a service strategy to enable m axim um flexibility for possible changes o f function. (3) W ithin the first year, open plan offices w ere converted to laboratories and a num ber o f existing laboratories upgraded to clean room status. This reportedly an easy and
econom ical procedure because o f the initial design specification but only possible because o f higher initial funding.
A c d o n
E x a m p le 1 A c c u m u la tin g a r e a a llo w a n c e p e r p e r s o n —m*
N u m b e r o f p e r s o n n e l
A c c u m u la tin g t o ta l a r e a r e q u ir e d
E x a m p le 2 A c c u m u la tin g a r e a a llo w a n c e p e r p e r s o n — m ’
N u m b e r o f p e r s o n n e l
A c c u m u la tin g to ta l a rea r e q u ir e d
1 Take sum o f workplace areas 10 m* per person 862 8620 m* 5 m* per person 525 2625 m'
2 Add 10% for access to workplaces (circulation
within departments)
1 0 m ' + l0% = 11 m* per person
862 9482 m* 5 m '4-10%
= 5 5 m* per person
525 2887 m*
i Add area for special, within-department facilities ;
eg m eeting and conference rooms, display or exhibition areas etc
11 m ' + 2 5 m* (say) = l3 5 m* per person * 1
882 (additional 20 serving special facs)
11 907 m' N one provided -
-4 Add 15% for inter departmental circulation 13 5 m '4-15%
= 15 5 m* per person
882 13 671 m' 5 5 m '+ 1 5 %
= 6 3 m’ per person
525 3318 m'
5 Add area for support facilities to office areas —filing
registries, archives, vending machines etc
15 5 m' + 3 3 m' (sa y )= 18-8 m’ per person *2
882 16 581 m' 6 3 m' + 2 2 m*
(say) = 8 5 m' per person
525 4462 m*
6 Add areas for special facilities—computer rooms,
restaurants etc. Provision varies so much from company to company that no general rules apply. Areas must be determined by preparing rough layouts
Special facility A
Special facility B
18 8 m ’ + 1 5 m ’ = 20 3 m' per person *3 20 3 m '+ 1 3 m' = 2 1 6 m* per person *4
882
882
17 904 m'
19 051 m*
Non provided
8 5 m'-t-O 75 m' = 9 25 m* per person
525 4856 m*
N et usable area INU A) 21 6 m'
per person 21 6 m ' + 20" = 25 9 m* per person
882
882
19 051 m ’
22 844 m'
9 25 m* per person 9 25 m ' + 2 0 “
= 111 m'
per person
525
525
4856 m '
5827 m>
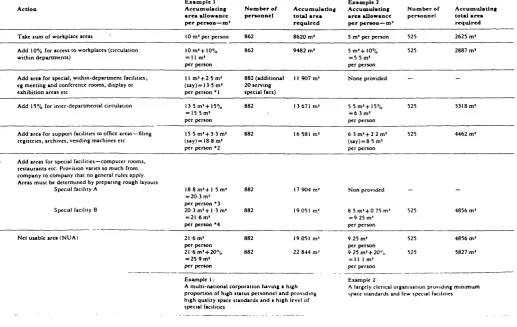
Example 1 ;
A multi-national corporation having a high proportion o f high status personnel and providing high quality space standards and a high level of special facilities
Example 2 :
A la r g e l y c l e r i c a l o r g a n i s a t i o n p r o v i d i n g m i n i m u m s p a c e s t a n d a r d s a n d f e w s p e c i a l f a c ilitie s
Fig 2.2 Two space budgets o f 25.9 and 11.1 sq m per person reflect the disparity in provision between a large corporation w ith high standards and a "back office".(4)
The im portance o f the space budget is highlighted by its relative proportion o f the overall budget o f the organisation; approxim ately 5% for each o f premises costs, I.T. and business support. (5) 80% o f the prem ises costs are relatively fixed property costs and 20% are variable operating costs. Prem ises costs are a direct result o f the area occupied, subject to tenure agreements. A space budget can be calculated for a typical em ployee. A n
individual w orkstation o f 7.0 sq m including secondary circulation becom es a gross external area o f 20.5 sq m. The w orkstation being only 35% o f the total space budget.
Total = 20.5 m 2 0 .5 m V person g ro s s external a re a 0.5 4.0 3.0 3.0 3.0 7.0
Fig 2.3
E x tern al w alls 20 m V person g ro s s internal a re a C ore, structure, plant, etc.
16 m V person n e t internal a re a Prim ary circulation 14 m V person m axim um u sab le a re a 13 m V person d e sig n e d u sab le a re a S u p p o rt
10 m V person d e sig n e d office a re a Ancillary
7 m V person w orkplace a re a
W orkplace S e c o n d ary circulation
C ore
Support
W orkplace
2.2 S ources o f S p ace S ta n d a rd s
Space standards can serve at least two useful purposes, they enable the pre-occupancy space budget to be calculated and establish a fram ew ork o f expectations. The latter is more im portant follow ing occupation w hen individuals com plain o f inequalities w hen com pared with others and inadequate provision for their ow n needs. An individual is most unlikely to say that their w orkspace is too big but dissatisfaction regarding the opposite is common.
2.2.1 H e a lth c a re
Public healthcare in the form o f the N .H.S. is a very large and regulated body. The Departm ent o f H ealth publishes detailed guidance via an executive agency (N .H .S. Estates) on all aspects o f the physical environm ent required to deliver a health service. This includes The Capital Investm ent M anual w hich sets out the process and checks required to be undertaken in order to deliver a new facility. It is a largely prescriptive and form alised process targeted at cost control; avoiding failure rather than achieving success.
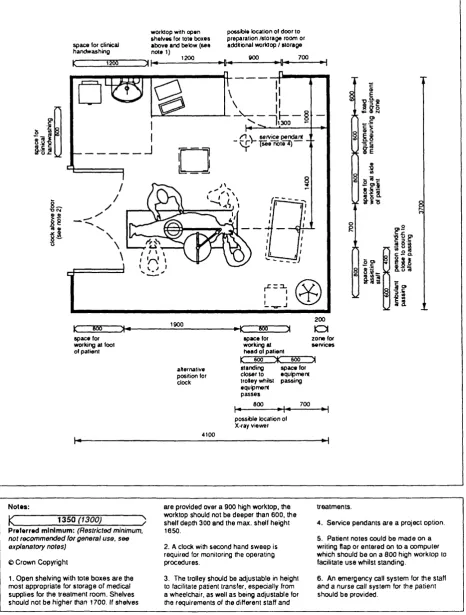
Health Building N otes (H .B .N .’s) set out the type, num ber, layout and size o f room s for the full range o f healthcare activities and how they m ight be arranged w ithin the "Nucleus" standardised briefing and planning system for health buildings. Figures 2.4, 2.5 & 2.6
It was felt that form al guidance on room sizes was inappropriate at the end o f the 1980’s and schedules w ere om itted from H .B .N .’s. It was said that areas should be based on functional analysis rather than slavish adherence to published sizes. (7) H ow ever, this did not stop the practice and room areas w ere reintroduced w ith a stronger direction against their misuse.
Schedules of accommodation
Para n o
ENT clinic
Activity sp a ces
N um ber o f con su ltin g exam in ation room s
Three Six
S p a ce area
sq m Qty
Total area
sq m Qty
Total area sq m Entrance an d reception
4 .0 3 R eception desk 4 .0 7 W aiting area 4 .1 2 Children's play sp ace 4 .1 4 W C /w ash /n ap p y ch a n g e 4 .1 4 D isabled w c /w a sh
6.00
10.00
3 .0 0 4 .5 0
6.00
20.00
10.00 6.00
4 .5 0
6.00 3 0 .0 0
10.00
9 .0 0 4 .5 0
Patient areas
4 .1 8 C on su ltin g/exam in ation room 4 .2 1 T reatm ent room
4 .2 5 Preparation room 4 .3 6 Recovery room 4 .3 7 Staff b ase 4 .3 8 Sub-w ait
1 5 .0 0 1 3 .0 0 7 .0 0
6.00
4 5 .0 0 2 6 .0 0 7 .0 0 8.00 6.00 5 .0 0
9 0 .0 0 3 9 .0 0 7 .0 0
10.00
6.00 7 .0 0
Utility/support sp a ces 4 .4 0 Nursing/adm inistration o ffice
B everage bay
4 .2 8 C lean sin g/d isin fectin g room Sw itch cupb oard
4 .4 1 Interview room
9 .0 0 3 .0 0 5 .0 0 2.00 8.00
9 .0 0 3 .0 0 5 .0 0 2.00 8.00
9 .0 0 3 .0 0 5 .0 0 2.00 8.00
Storage/su p p lies 4 .4 3 Clinic store
N et total Circulation etc
Total
D epartm en tal areas
5 .5 0
1 7 6 .0 0 6 9 .8 0
2 4 5 .8 0
2 4 5 sq m
6.00
2 5 1 .5 0 9 9 .7 0
3 5 1 .2 0
3 5 0 sq m
Figure 2.4 Schedule o f A ccom m odation - EN T clinic HBN 12 Supplem ent 3 p23
space (or clinical handwashing
worklop with open shelves for tote boxes above and below (see note 1)
1200
possWe location of door to preparation /storage room or addkiortal world op / storage
900 700
/ I \ service pendant " Tiee notiT )
I W t
ill
if
If!
5? 8 §
Ill
H uu
f!f
l i t
If
W 1900
space for working at foot of patient
alternative position for clock
200
< -KÜ O I
space for zone for working at services head of patient
C 600 600 standing space for closer to equipment troley whilst passing equpment passes
800 , _ 700
— h j possible location of
X-ray viewer
Notes:
1350 (1300)
Preferred minimum: (Restricted minimum, not recom m ended tor general use. se e explanatory notes)
© Crown C opyright
1. O p e n shelving with tote b o x e s a re the m ost ap p ro p riate for sto ra g e of m edical su p p lies (or the treatm en t room . S h e lv e s should not b e h ig h er than 1700, If sh elv es
a re provided over a 900 high w orktop, the worktop should not be d e ep e r than 600. the shelf d epth 300 and the m ax. shelf height 1650.
2. A clock with seco n d hand s w e e p is required for monitoring the operating pro ced u res.
3. The trolley should be ad ju stab le in height to facilitate patient transfer, e s p e d a lly from a w heelchair, a s well a s being a d ju stab le for the requirem ents of the different staff a n d
tre a tm e n ts.
4. S erv ice p e n d an ts a re a project option. 5. P atien t n o te s could b e m a d e on a writing Map or e n te re d on to a co m p u ter which should b e on a 8 0 0 high worktop to facilitate u s e whilst stan d in g .
6. An em e rg e n cy call sy ste m for th e staff a n d a n u rse call sy stem for the p atien t should b e provided.
Figure 2.5 Treatm ent Room Plan - HBN 12 Supplem ent 4 p62
h o s p i t a l S T P C E T
S e c r e t a r i a l O f f i c e
S n r C o n s
J ) j n i o r S t a f f O f f i c e
C linic
Entrance W c
<h
C ln r B e v W c W c s W c
F i r e E x i t
W a i tin g A r e a
R e c e p t i o n P l a y S p a c e
J u n i o r S t a f f O f f i c e C o n s
O f f i c e C o n s O f f i c e
C o n s O f f i c e
C o n s O f f i c e
S u b - W a l t
CIn &
iaR "
Room N u r s i n g / A d m in n t e r v
R o o m T r e a t
C / E R e c o v
C / E T r e a t T r e a t
F i r e E x i t Wc
C / E C / E C / E C / E
Lim ited capital availability w ithin the N HS had an influence on the overall size o f new facilities. Capital funding was centrally controlled and form ula based. A service treating a given num ber o f patients w ould be described as a Functional Unit. M ultiples o f
functional units attracted an index linked allow ance w hich was geographically adjusted to give a total budget. Budgets w ere incapable o f building the schedules o f accom m odation arising from H .B .N .’s to the standards required. The system was forced to w ork in reverse with Project Teams adjusting areas to m atch the budget at detailed design stage. This also resulted in schemes w ith little design capacity to respond to change, built to m inim al quality specifications so that areas could be achieved.
A change in the practice o f space allocation arose w ith the opening up o f the N .H .S. to com petition. In services w hich w ere com peting directly with the private sector for incom e, com m ercial pressures brought dow n overall areas. One N .H .S. pathology laboratory redevelopm ent was built 40% sm aller than H.B.N. schedules to keep
accom m odation costs down because o f strong local com petition from the private sector for a large portion o f its w orkload.(9)
N .H .S. reform s introduced the concept o f Capital Charges in order to stop space being considered a "free good". Capital Charges and notional depreciation am ount annually to an approxim ate 10% o f property value charge on individual hospital trusts.
The Private Finance Initiative (P .F .l.) is causing the public sector to seek private sector funding for facilities on a lease basis over long (25 - 30yr) periods. This m eans that life cycle costings are produced for every square m etre. Project Team s are forced to closely consider how facilities are utilised in order to keep w ithin the available revenue.
Private sector healthcare space standards are based on N .H.S. publications.
A nthropom etric and ergonom ic data is equally applicable and can be seen as a m inim um standard when defending against litigation. Capital is available on a com m ercial / business case basis and expended on criteria set by individual organisations. A dditional space allocation is related to income generation, either linked to efficiencies behind the scenes or patient expectations in more public areas.
2.2.2 O ffices
Ergonom ic considerations apply equally to office tasks and functions. The minim um area required for a person working at a desk could be considered to be 1.2m w ide x (0.8m desk + 0.5m chair depth + 0.6m o f shared circulation) = 2.3 sq m. In the U nited Kingdom, the Health and Safety Executive’s 1993 guidance is a m inim um provision o f 11.0 cu m per person, equating to about 4.6 sq m in an office with a 2.4m headroom and a minim um o f 3.7 sq m w here ceilings are equal to or higher than the 3.0m threshold. Such guidance determ ines the low er limit o f office space standards. The interpretation o f an
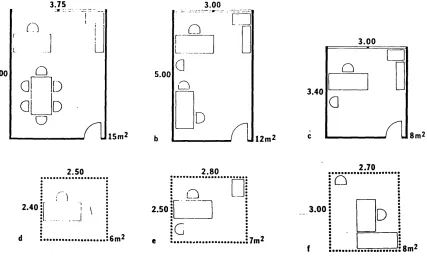
organisation’s functional requirem ents usually result in open plan space standards larger than 4.6 sq m. M anagerial duties and a need for confidentiality increase standard areas.
3.75 5.00 Û
ai
DD
o U 2.40/ I
15m22.50 3.00 5.00 Û
a
D
2 .8 0
2.50
G
12m2
□
7m2
3 .0 0
3.40 n Û
a
n i 2.70Û
3 .0 0
D
f
8m2
8m2
Solid lines represent enclosed rooms; dotted lines indicate workplaces in an open plan,
a manager b division head c senior research leader d research leader e research officer f secretary
Fig 2.7 Traditional space standards (10)
The design o f Call Centres provides an insight into the practical provision o f office space. This sector currently em ploys 1% o f the w orking population and is expected to double by 2001. The function o f a call centre operative can be contained w ithin the 2.3 sq m discussed above. O range, the Telecom s group, have found that w orkers tend to "burn out" after 18 months because o f the m onotonous w ork and poor w orking environm ents (11). S taff recruitm ent and training costs are forcing im proved space provision at the w orkplace, ranging from 5 to 8 sq m depending on the em ployer, and im proved "break out" areas where staff can escape from the telephones. The organisation is thus choosing to increase space provision beyond the ergonom ic and statutory m inim um s for its own com m ercial reasons o f staff recruitm ent and retention.
Space standards for offices are becom ing increasingly open plan based. The new M inistry o f Defence, 130,000 sq m office com plex at Abbey W ood has only 2% o f staff in cellular offices. (12) The approach appears to im prove team spirit and com m unications.
CHAPTER THREE
CONCEPTS OF REALLOCATION
Knchen
C o n j u lt
CHAPTER 3
CONCEPTS OF REALLOCATION
3.1 Types an d reaso n s fo r ch an g e
It can be suggested that the functional content o f a building usually changes betw een the com pletion o f the b rief and occupation. This is one o f the m ajor reasons for im m ediately post-occupation m odifications. The degree to w hich physical m odifications are needed is resultant on the design’s capacity to absorb change and thus the building’s use flexibility. Open plan layouts w ith standardised furniture systems and accessible services should require only individuals to m ove and desks to be adjusted to facilitate reorganisation. Cellular layouts w ith non-standard furniture are more costly to adjust. These
considerations continue through the subsequent life o f a facility.
Change can be initiated by a range o f sources:
Individuals w ithin their ow n workspaces Individuals effecting adjacent workspaces G roups or D epartm ents
Senior M anagem ent A ccom m odation M anager
External forces - Political, environm ental, contextual, etc. Fig 3.1 Sources o f change
The reasons for change arise from many sources including:
R E A S O N E X A M P L E
Tenure lease expires
Business grow th occupancy rises above capacity Business contraction potential for partial disposal
Shift in business activity relative change in D epartm ent sizes N ew technology + or - space requirem ent
Em ploym ent patterns proportion o f full v ’s part time new w orking practices
change in "trading" hours
Fashion / Im age relocation o f "high tech" firm s to high profile new buildings
O rganisational change hidden agenda - m eans o f achieving change that w ould not otherw ise be acceptable Fig 3.2 Reasons for change
A BIFM survey o f Facilities M anager’s responsibilities in Septem ber 1997 established that average chum in 1996 had been:
H ealthcare 7%
O ffices 33%
The rate o f office chum in b oth the office and healthcare sector is probably fairly equal given that most healthcare space has a specific clinical function, is therefore specialised, expensive to m odify, grouped w ithin a departm ent and thus rarely relocated.
It may be o f interest to note th at 47% o f respondent’s organisations had space charging arrangements. O f these, the basis o f charging was:
A rea occupied 67%
P ersonnel headcount 10%
Functional identity 5%
O verhead contribution 4%
O ther 4%
3.2 S pace M a n a g e m e n t
"Space M anagem ent may be defined as the skill o f m atching user requirem ents to managem ent objectives within the constraints o f built form. It is a continuous process throughout the life o f the user organisation." (1) John W orthington w ent on to suggest that there are tw o levels of space m anagement, H ousekeeping and Strategic Space M anagement.
H o u sek eep in g S trategic S p a ce M a n a g em en t
Carried out by the A ccom m odation M anager A ccom m odation M anager’s A dvice
D ay to D ay issues Effects o f changing sta ff numbers
Location o f staff Total amount o f space needed
U se o f reserves o f space Leasing o f additional space
M inor changes to lighting, partitions, etc. C om m issioning o f a new building
Fig 3.3 Role o f the A ccom m odation M anager
The role o f A ccom m odation M anager is not always clearly defined, it varies betw een organisations and depends on circum stances such as size, grow th, change, geographical distribution and budgetary control. In practice, there m ay be a range o f individuals w ith an input into space m anagem ent: Individuals, an A ccom m odation M anager, D epartm ental heads and the O rganisation at Board level.
Space m anagem ent requires facilities provision to respond to the peaks and troughs o f organisational dem and for space. Demand varies increm entally but supply is a step function. It is not a practical possibility for m ost Facilities team s to be able to acquire space on a room by room basis. There are at least three exceptions to this rule. Firstly, the hire o f true hotel facilities from a local establishm ent w ith conference facilities such that the specialist needs o f infrequent training and large m eetings are provided on a specific need basis w ithout incurring fixed costs. Secondly, arrangem ents w ith local organisations to pool and share surplus resources. Thirdly, the use o f fully serviced facilities on short term leases such as those proposed by O liver Jones o f Regis (2).
DEMAND CURVE
O ’
TIME
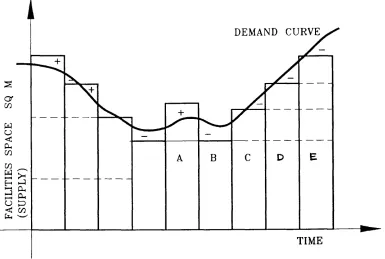
Fig 3.4 Supply and dem and o f facilities space
Fig 3.4 illustrates the zones o f shortfall and overcapacity encountered by a notional organisation as it passes through a cycle o f decline and expansion. T here a re zones o f under and over provision identified by the + and - symbols. The role o f strategic space m anagem ent is to m ake the step changes as smooth as can be afforded w hilst the role o f housekeeping is to m anage utilisation in the + and - zones to m inim ise the disbenifits associated w ith overcrow ding and excessive churn. This hypothetical illustration shows that supply was probably expanded too far at point "A" and then reduced too far at point
"B". A better m atch has been achieved at points "C", "D" and "E". The short term cost reduction at point "B" could have had serious m edium term im plications resulting from a constraint o f potential. Thus the m edium and long term risks o f short term space
provision must be considered as part o f strategic space m anagem ent.
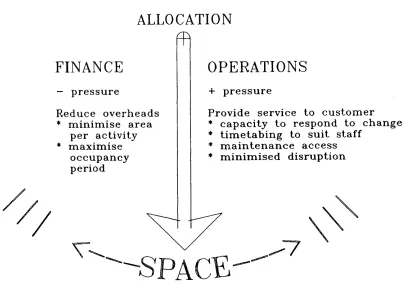
Experience suggests that practical space managem ent is traditionally addressing the conflicting requirem ents o f the financial and operational elem ents o f an organisation. Financial Directors strive to reduce fixed costs and overheads. A lthough occupancy costs are usually a m inority o f the total budget, they can be easier to reduce and offer recurrent savings when com pared w ith staffing costs. Operational issues relating to space revolve
around adequate space to operate effectively, to be able to m ake changes with minimal disruption to ongoing operations and to be able to m aintain facilities w ithin the budget available.
ALLOCATION
F I N A N C E
— p r e s s u r e
R ed u c e o v e r h e a d s * m i n i m i s e a r e a
p er a c t iv it y ♦ m a x i m i s e
o c c u p a n c y p erio d
O P E R A T I O N S
+ p r e s s u r e
P rovid e s e r v ic e to c u s t o m e r * c a p a c i t y t o r e s p o n d to c h a n g e * t i m e t a b i n g to s u i t s t a f f
* m a i n t e n a n c e a c c e s s * m i n i m i s e d d is r u p t io n
Fig 3.5 "Pendulum" forces: Finance v ’s O perations
Bernard W illiams (3) has suggested that there are tw o types o f space M anagem ent; w ith a capital M and w ith a small m. Capital M is w here people knew w hat was good for the users and im plem ented it, w here they really understood the relationship between space, its managem ent and its usefulness to the organisation. The rem aining 90% o f space
management was "by people who ju st fight fires and squeeze people into space that is ju st totally inappropriate to their needs" on the basis that they had inadequate space or w ere saving money for the organisation. W illiam s questioned w hether they were really saving money. There is a logical link betw een inappropriate space allocation and inefficient working practices but form al p ro o f appears to lacking.
It is not ju st the A ccom m odation M anager that m anages space. Everyone involved in the process as an influence on the managem ent at different levels. Their degree o f
involvem ent is illustrated in Fig 3.6. Richard W atts suggests that the form ation o f User Groups is an effective way o f increasing end user involvem ent and increasing satisfaction levels am ongst those who have gone through the change processes. (4)
ISSU E D E G R E E O F C O N T R O L / IN V O L V E M E N T L O W 1 < --- > 5 H IG H
Central M anagement
F.M . / Estates
Department Group Ind
A llocation 5 3 3 2 1
Internal relocation 3 3 4 2 1
Utilisation space 3 3 5 3 1
time 3 2 5 3 3
Planning for change 5 3 3 1 1
Facility Shell 5 4 2 1 1
D esign Scenery 3 5 4 2 1
Set 1 3 4 5 3
Workstation configuration 1 1 2 3 5
T O T A L S 29 27 32 22 17
Fig 3.6 Space M anagem ent M odel
Figure 3.6 illustrates a m odel o f space m anagem ent issues and those involved in the processes. A s one m ight expect, individuals have a low degree o f involvem ent in corporate issues and m ost involvem ent in small scale issues and tim e utilisation.
D epartm ents w ould appear to have the greatest influence overall but this is only w ithin the limits im posed by central management.
Bley and M arm ot suggest that space m anagem ent is m ade easier as the num ber o f space standards are reduced so that there are less differently sized pieces o f the jigsaw to assemble. Less is more: few er rather than sm aller standards m ake an office m ore flexible
and more cost effective. They also suggest that a modular approach to planning is advisable so that multiples of space standard "footprints" can be combined or divided to form new layouts to match changing operational requirements.(5) Such modularity, when combined with building grids (structure, fenestration and building services) can be of significant help to space management.
6 sq u are m e tres O p e n p lan
S to ra g e c u p b o a rd P e d e s ta l D esk re tu rn
S h a re d lo c al c irc u la tio n
9 s q u a re m e tres L a rg e o p e n p la n
12 sq u a re m e tres
Enclosed
Fig 3.7 Typical office workplace footprints.
There are a number o f aspects o f an organisation’s profile w hich can influence the way in w hich space is managed.
F A C T O R C O M M E N T
Size o f organisation local, national, global
Rate o f change / growth steady or volatile
D egree o f specialisation uniform or specialist use - open plan office or hospital labs
D iversity o f location N o. o f floors, buildings, sites
D egree o f central control devolved power to departments?
Budgetary arrangements area based recharging or % overhead
Working practices / technology low tech or cutting edge
Fig 3.8 Influences on Space M anagem ent
The reallocation o f land for developm ent has to be considered alongside the reallocation o f existing space. The N.H .S. has traditionally been organised on very form al planning principles regarding site developm ent. It is a requirem ent for each Hospital to have a Developm ent Control Plan w hich should deliver the trust’s Estate Strategy which, in turn, delivers the facilities required by the business strategy. This contrasts with Richard Llewelyn-Davis "step by step" planning philosophy for M ilton K eynes w hich did not attem pt to predict the future. Contrasting planning strategies are highlighted by the case studies.
A t a smaller scale, churn needs to be carefully planned once the decision to reconfigure has been taken. A reactive approach as a "quick fix" w ithout a clear strategy and planning can create a vicious circle w here actual chum becom es unnecessarily high.(6)
CHAPTER FOUR
CURRENT PRACTICE
f
CHAPTER 4
CURRENT PRACTICE
The conclusions and statements stated below are draw n from the interview s sum m arised in Appendix D. The num ber o f organisations studied was statistically too small to be
considered fully representative o f the individual sectors, w ith the possible exception o f Private H ealthcare. The resultant conclusions may be skewed by the individual
circumstances o f the cases studied.
4.1 S pace S ta n d a rd s
7 o f the 8 organisations studied had recognised space standards in addition to statutory requirements. T he eighth (B) had an approach w hich generally required reprovision to be no greater than existing arrangem ents.
The use o f post-occupation standards w as less form alised than pre-occupation in all cases reflecting the increased need for com prom ise on physical and personnel issues once
dealing w ith real rather than theoretical elements. Standards w ere considered to be largely "reasonable" and usually at least 3 - 5 years old w ith an expectation o f slow change.
Estate records w ere all kept centrally and w ithin the year w ould all be CA D based. The benefits o f I.T. based systems w as universally recognised as an aid to space m anagem ent and recharging.
4.2 A u d it
Com m ercial organisations proved to be m ore likely to carry out space audits. This was usually via the annual business review process rather than visiting areas and recording usage. Detailed space audits appeared to be limited to specific projects rather than a central knowledge o f utilisation levels being used to bring about im provem ent. Central m anagem ent was on a "hands o f f basis w ith space being a neutral issue unless
profitability was suffering.
All Healthcare groups reported increased activity levels reflected in a higher headcount whereas most office users w ere reducing personnel numbers.
4.3
Utilisation
Pressures on levels o f space utilisation w ere generally expected to increase at organisational level but at a departm ental level, the office sector w as expected to be constant - possibly reflecting overriding operational pressures to m aintain existing provisions.
Cost im provem ent proved to be the m ost im portant factor stim ulating space utilisation, w ith rising workload driving change in public healthcare as they tried to provide additional capacity to m eet dem ands caused by G overnm ent initiatives.
Tim e utilisation in the healthcare sector w as expected to continue to increase. 12-hour days, 6 days per w eek were expected to be the practical lim it o f tim e utilisation. Existing senior medical staff were unw illing to extend their N .H .S tim e from tw o sessions, 4.5 days per week but new appointees will have to sign up to different w orking patterns. Patients were also expected to be unw illing to accept routine treatm ents during anti-social hours. 50% utilisation for 6 days per w eek (43% overall) will therefore becom e the limit for non ward areas.
N egative aspects o f increased utilisation levels were noted as higher m aintenance and managem ent costs. These costs were not considered to be funded w hen schedules w ere expanded and quality was detrim entally effected.
4.4 P la n n in g fo r C h an g e
The only organisations w ith estate strategies were the tw o N .H .S. trusts and they were required to have one by the D epartm ent o f Health. Planning w as generally on an inform al basis and responded to situations as they arose w ithout form al arrangem ents to address unexpected change. H ealthcare was able to plan further ahead than Offices. This was attributed to long lead tim es for new technologies.
A study by Ernst & Y oung in 1993 identified that although occupiers o f space w ere the long term drivers o f the property market, the m ajority had no coherent strategy for identifying their requirem ents, e.g. a property strategy or prem ises policy. (1)
Organisations tended to be driven by external factors w hich could not be justified in a rigorous exam ination o f the decision process.
4.5 Space M a n a g e m e n t
Overall configuration and reallocation o f space was m anaged v ia in-house F.M. / Estates groups with the exception o f the City Hospitals trust w hich w as undergoing large scale redevelopm ent and w here space is being controlled by central m anagem ent. A t a departmental level, everyone used the F.M. / Estates group for advice.
The H ealthcare sector felt that space utilisation m anagem ent w as either localised or non existent; contrasting w ith the O ffice sector w ho used F.M . / Estates input. This correlates strongly with space charging systems, public healthcare being the only group not to charge on an area occupied basis w ithin 12 months. Everyone else charged at departm ental level and some charged individual groups within departm ents as separate cost centres.
4.6
Ability to respond to change.
Recent changes were considered to have been largely "partially expected" (50% ) or "foreseen" (37%). One private sector healthcare group felt that change w as always
foreseen because even though it w as unexpected at the first o f its thirty-eight sites it could then be planned for at the rem aining thirty-seven. The tim e available to respond to such change would however, not be very long.
Both public sector healthcare m anagers felt they w ould like to keep 2 - 4% o f their area available to allow for change. This w as linked to their needs for decanting space to refurbish wards as whole units. (If considered as part o f a continuous program m e, such decanting space would not be considered to be unused). They w ere also m indful that capital w ould be unlikely to be available to fund additional space w hen dem ands arose. Thus it was better to keep space in reserve. In reality they had either 0% or I -2% available.
M anagers generally wanted to theoretically keep m ore space in reserve than they did in practice. The office sector held m ore space in reserve than healthcare.
The question posed in section 1.2, "W hat level o f (over)capacity do organisations consider desirable...." was answered, not linked to the m arket being operated w ithin, but rather the sector, The public sector com pensated for slow financial responses by planning on a longer term basis. This was helped by longer lead tim es from their client bodies, central and local government, com pared w ith the private sector.
CHAPTER FIVE
FUTURE PRACTICE POSSIBILITIES
F T S
or JO
O U J O
CHAPTER 5
FUTURE PRACTICE POSSIBILITIES
5.1
Change
One o f the strongest m essages to com e though from the interview s w as that o f avoiding detailed strategic planning but prom oting the ability to respond quickly w hen
circum stances demanded. This w as qualified by the need to understand the capabilities and potential o f existing facilities. To be able to respond adequately, financial and F.M. resources had to be available w ithin the tim escale necessary to m eet the need.
The public sector expressed lim ited financial resources and com pensated w ith varying degrees o f planning linked to strategic opportunities. Response tim es w ere consequently slower. The City Hospital trust was em barking on a large scale realignm ent o f its facilities. This w ould probably have been undertaken m uch sooner in the private sector. Indeed, the scheme was only proceeding because private funding w as being sought. The resultant output specification approach to briefing and com m issioning w as seen as a means to procuring facilities that w ould m atch the tru st’s uncertain and changing needs over time w ithout recourse to additional expense and w ithout the lim itation o f delivering services from facilities that no longer m atched needs.
5.2
Space Utilisation
Flexibility and A daptability appear to be the prim ary com ponents o f successful space utilisation. Space standards have to exceed statutory m inim um s and usually exceed functional m inim um s in order to provide environm ents w hich sta ff find conducive for work.
Flexibility can be considered in term s o f adjusting sets, the w ay in w hich loose items are
arranged and rearranged to suit small scale changes in w orking arrangem ents. Open plan layouts are inherently m ore flexible than cellular, even if the partitions in the latter are supposed to be dem ountable. Density can be adjusted to suit personnel num bers, tasks and work groups w ithout com prom ising environm ental standards in a well designed open plan area. Flexibility can be further increased by the adoption o f standardised furniture and storage systems. S taff relocation costs are m inim ised as m oving becom es a m atter o f transporting only personal effects.
Adaptability refers to the shell and building services ability to support alternative configurations and use types. A highly adaptable building should prolong the period w hich the organisation will be able to m aintain the utility value through m inor
refurbishm ent to m eet new functional requirem ents. This avoids the organisation being forced into taking relocating because the facility is no longer suitable.
A benchm arking exercise conducted by A dvanced W orkplace A ssociates (EA) o f 21 office buildings discovered a generally positive relationship betw een the satisfaction score for each building and the space per user. However, one or tw o buildings bucked the trend with high satisfaction levels and relatively sm aller areas. U sers w ere also asked to rank workplace related attributes to indicate the degree o f im portance they placed upon them.
ASPECTS OF WORKING CONDITIONS
RANK
O ffice equipm ent reliability 1
D esk furniture 2
E nvironm ental conditions 3
O ffice layout 4
Storage space 5
F loor space 6
O ffice services 7
O ffice surrounding 8
Fig 5.1 R esults o f office user survey (EA)
A high dependency on I.T. is the probable reason for equipm ent reliability’s first rank position. It m ay be that users rank those aspects highest w hich they have m ost problem s with at the tim e o f the survey. It may also be that as w orking environm ents are broadened
by the creation o f rest areas and inform al m eeting rooms, the territory o f o n e’s personal w orkstation becom es relatively less im portant. U sers seem to place em phasis on an efficient environm ent w ith a high degree o f personal control.
5.3
Time Utilisation
% Tim e U tilisation = No. o f people using the space x hours used x 100
Capacity hours available
The pressure to utilise capital assets intensively in industry is linked to profitability. Why then are offices generally considered to be zones for 9 to 5 w orking?
"People are our biggest asset" is often quoted. People are usually a firm ’s biggest cost, difficult to m anipulate and procure. T he term "People" includes senior m anagem ent who also initiate changes in time utilisation. One potential reason for low utilisation levels in offices is that know ledge w orkers are becom ing m ore able to state w here and w hen they want to work. I f they w ish to w ork elsew here than their base, it is becom ing increasingly realistic to establish full "office" facilities at an individual’s hom e or a custom er’s office by using portable I.T. and datacom s links to the central data storage.
Healthcare treatm ent is not yet som ething that is practical to conduct on a rem ote basis. Time utilisation is lim ited to 12 hour sessions, 5.5 days per w eek because o f long term staff and patient acceptability and is thus the practical threshold. Em ergency arrangem ents operate for 24 hours per day but strains on personnel resources are too high to m ake the practice w ider spread.
Successful space utilisation m anagem ent involves the supply o f the m inim al effective facility to m eet the actual dem and on a day to day, week to w eek and year to year basis. Too many w orkplaces m ean high fixed costs. Too few result in disruption, lost
productivity, a diversion o f effort from the core business to resolve the problem and could bring down an organisation over tim e as key staff leave to find better conditions.