Road Connectivity and Traffic Flow in Mewat
District- Haryana
Dr. Shabnam Ara
Department of Geography,
Hamidia Girls Degree College, Allahabad, Uttar Pradesh, India
Abstract− The role of transport in the development process play an important role. In the present paper an attempt has been done to show the road connectivity pattern and flow of traffic of the transport arteries. Although transport network is not a single factor for the development since industrialization and existence of resources of the region and government policies also plays substantial role. The existence of transport network accelerates the accessibility and connectivity of the area with other factors. Attempt has made here to count the volume of the traffic flow in different direction short as well as on long route.
Key Words− Transport Network, Vehicle, Traffic flow, Mewat, Crossing
I. INTRODUCTION
Transport is concerned with movement of persons or goods for some particular purpose (Jana 1998). Its role in regional development is of utmost significance as it accelerates the socio-economic development of the region and its impact has wide ranging on agriculture, industry, trade and commerce and its network serves manifold functions in regional development (Vaidya 1998).
Mewat is the most deprived pocket of Haryana state has been selected for study. Therefore, survey of major road crossing for vehicles count has been done direction wise to find their volume in a particular direction along with the vehicles types.
II. STUDY AREA
Mewat district (its head quarter at Nuh), lies between 27º 39' to 28 º 20' North latitude and 76 º 51' to 77 º 20' East longitudes. The area is largely occupied by alluvial plains, traversed by elongated ridges of Delhi quartzites. The ground water in the district area is saline, and salinity increases with depth. Agriculture, the base economic activity of the people is deprived of irrigation. There is no river and area is drained by artificial drains namely Nuh, Ujina & Kotla drains. They carry rain water into Yamuna River. Gurgaon canal carries water to the area which is distributed through Nuh, Firozpur Jhirka, Uttawar, Mandkola, Hathin and Chhyansa distributaries.
The Mean Maximum temperature of the area is 40°C (May & June) and Mean Minimum temperature is 5.1°C (January). The district area has undulating topography and is more or less bowl shaped. The sporadic ridges and hillocks make a semi- circle to the west, south and east of Punhana. The general slope in the area is NW-SE in the western part, NE-SW in north-eastern part. In 2011, Mewat had population of 1,089,406 of which male and female are 5, 71,480 and 5, 17,926 respectively. Its density is 729 people per sq. Km average literacy rate were 56.10 percent and Sex Ratio remained 906 per 1000 male.
III. OBJECTIVES To find out the composition of traffic on particular direction. To find out the pattern of traffic flow in study area.
IV. DATABASE AND METHODOLOGY
the country/area can ever flourish. Actually economic growth of a country or world as a whole is indispensible from the transportation (Chakraborty, 1998).
V. LOCATION OF STUDY AREA- MEWAT
Map 1
Table− 1 Types of Vehicles in the Morning Time at Major Crossings (in %)
Vehicle type
Badkali Jurhera
Ferozpur
Jhirka Nuh Punhana Taoru
Car/Jeep 31.36 43.60 20.69 30.45 17.25 20.94
Bus 0.77 0.23 1.47 2.46 0.87 0.35
Trucks 24.60 23.78 23.26 20.63 30.68 33.16
Scooter 37.66 23.78 47.74 37.33 42.58 36.65
Tractor 2.31 1.70 1.22 2.46 1.86 3.49
Cycles 1.15 1.13 1.22 0.79 1.31 0.87
Rikshaw 0.77 0.68 0.86 1.47 1.64 1.40
Auto 4.46 5.10 3.55 4.42 3.82 3.14
Total 100 100 100 100 100 100
Source: conducted Survey by the scholar
During Lean hour (Noon Time) although the volume of traffic of all types of vehicles at survey points were low as compared to morning rush hour. But Badkali crossing is not affected by the high number of traffic at this time. The same trend of vehicles persisted in this hour also. There is observed a decrease in the number of four wheelers at the noon time in all the crossings and Taoru crossing recorded minimum number of cars this time. In fact at Nuh and Badkali crossing a marginal change in the number of trucks and cars observed.
Table− 2 Types of Vehicles in the Noon Time at Major Crossings (in %)
Vehicle type
Badkali Jurhera
Ferozpur
Jhirka Nuh Punhana Taoru
Car/Jeep 29.05 29.41 24.65 37.88 31.29 42.76
Bus 0.34 0.37 0.88 0.30 0.35 0.33
Trucks 26.01 18.63 15.55 10.61 16.22 7.07
Scooter 40.54 45.34 53.10 46.97 47.51 47.70
Tractor 1.35 1.47 1.01 1.06 1.39 0.49
Cycles 0.20 1.47 0.88 0.61 0.23 0.82
Rikshaw 0.47 0.86 0.76 0.30 0.93 0.00
Auto 2.03 2.45 3.16 2.27 2.09 0.82
100.00 100.00 100.00 100.00 100.00 100.00
Source: Survey conducted by the scholar
Table− 3 Types of Vehicles in the Evening Time at Major Crossings (in %)
Vehicle type
Badkali Jurhera
Ferozpur
Jhirka Nuh Punhana Taoru
Car/Jeep 27.37 25.33 27.67 33.14 25.89 33.74
Bus 1.03 0.31 0.66 1.51 0.49 0.87
Trucks 22.51 19.23 15.29 21.48 26.87 24.48
Scooter 41.36 45.78 47.84 38.59 38.39 34.09
Tractor 1.95 2.44 1.41 1.09 1.77 2.45
Cycles 0.91 1.02 1.13 0.42 1.48 1.40
Rikshaw 0.61 0.81 1.13 0.84 1.08 0.17
Auto 4.26 5.09 4.88 2.94 4.04 2.80
100.00 100.00 100.00 100.00 100.00 100.00
Source: Survey conducted by the scholar
VI. TRAFFIC FLOW ANALYSIS
The present study is concerned with the analysis of flow and the accessibility differential in the space economy which provide the base for the movement of goods. Movement of buses has been related because it is the major means of public transport in the study area.
Shabana, (2013), have done origin destination survey of peak hour to estimate the information regarding travel characteristics of different users in northern India (specially along the national highway) and tried to find out major influential zone along these roads. It is also observed that growth of projected road has positively related to the growth of economic activities and road networks.
The increased demand for transportation has been an inevitable outcome of urban and economic growth. There are two major aspects of road transport: i) movement of goods and ii) movement of people. Almost all the states have their own State Road Transport Corporation. This corporation is providing transport facilities within their own states and also to the neighbouring states. Few depots in the state do provide city bus services. Different modes of transportation in the study area are buses, mini-buses, autos, tempo, cycle rickshaw, car, two wheelers and bi-cycles.
Road intersections are critical component of the road network efficiency and safety of traffic operation are largely governed by the intersections. Poor design of intersection leads to traffic delay and hazards. In order to improve the road network, it is important that the intersections should be design properly to cater the need of the present and future traffic flows.
At present, public and private sector have large fleet of buses at their disposal for passenger movement. Both the public transportation and private transport system have grown with the passage of time. Inter and intra-regional interactions between different nodes are operationalized through the routes. Thus transport network represent the functional associations between different orders of centres.
Inter -District Flow
Intra -District Flow
Intra-district bus connectivity is a disappointing affair. The major transport nodes are connected by bus. Most of the villages are deprived of bus service facility. Road infrastructure is there but the flow of bus on those routes is not a common feature of the area. Beside HR buses and buses operated by the private agencies are plying on the same route and not touching the interior part of the villages.
Disparity in terms of flow has been found in the inter-district bus connectivity. People change bus to reach their destination. Like passenger from Faridabad do not have direct connectivity they have to either take Delhi - Gurgaon route or Faridabad - Hodal route to reach Mewat. The district headquarters, Nuh, poor cousin of (Mewat) of Gurgaon will be linked soon with national highway. The southern part of Haryana which is backward will get benefit because of economic boost and improve connectivity.
Lack of integrated mass transport system and the increased need for use of transport for daily journey has resulted in a steep growth of vehicle ownership in area. It was observed during survey time that people own high number of two wheelers followed by cars and trucks plying on the roads and road crossings.
The combined peak hour traffic on all the selected points (road crossings) vary from 320 (minimum) to 1360 (maximum) vehicles. It is very much clear from the traffic flow (Map 7) that Taoru crossing observed high traffic on Bhiwadi - Sohna route. More than 500 vehicles move on route Pataudi – Taoru road. The similar type was found on Nuh - Taoru and Nuh - Hodal. Status from Rewari side traffic flow is less as compared to other directions; the reason behind is that Aravali hills provide a natural barrier in the flow of passenger and goods.
In the south east, at Punhana T- point, where traffic move from three sides eastward movement to towards Hodal and southwards to Jamalgarh and Kaman (Bharatpur) and westward to Badkali make a junction of high traffic convergence. Besides car/jeep, truck and autos have high frequency. This Jurhera Mor crossing is busy and major transport hub, where the movement of goods (mainly grains and stone) from two states (Haryana and Rajasthan) take place. The Kaman-Punhana route further adds heavy vehicles volume in this border town of Haryana.
Based on the traffic survey conducted in Mewat, it may point out that Ferozpur Jhirka Crossing is equally busy transport node, here traffic amalgamate from Tijara, Kaman, Alwar and Badkali. The volume of traffic is more from eastern side (Kama-Deeg) as compared to north (Badkali side) and south (Nogaon – Alwar). Rest of the routes are not experiencing the same volume of traffic flow. Personal Car/Jeep and tractors are the most common items plying on these routes.
In Badkali Chowk also recorded high traffic from four sides Punhana (in the east) and Nagina (in west), from north Nuh and Ferozpur Jhirka (in south) adds more traffic which is generally destine to reach Gurgaon/Delhi.
Table− 4 Traffic Flow at Taoru Crossing
Direction of Flow Morning Noon Evening
Rewari to Nuh 590 410 567
Nuh to Rewari 530 390 515
Bhiwadi to Sohna 720 395 671
Sohna to Bhiwadi 880 415 674
Source: Based on the Field survey conducted by the scholar
Table − 5 Traffic Flow at Nuh Crossing
Direction of Flow Morning Noon Evening
Hodal to Taoru 932 520 859
Taoru to Hodal 990 618 905
Sohna to Badkali 870 320 773
Badkali to Sohna 939 430 1395
Source: Based on the Field survey conducted by the scholar
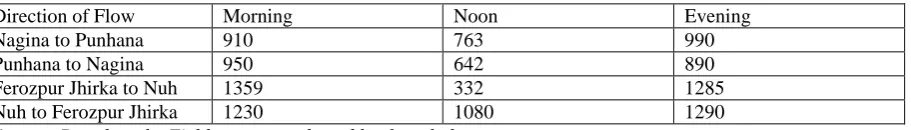
Table− 6 Traffic Flow at Badkali Crossing
Direction of Flow Morning Noon Evening
Nagina to Punhana 910 763 990
Punhana to Nagina 950 642 890
Ferozpur Jhirka to Nuh 1359 332 1285
Nuh to Ferozpur Jhirka 1230 1080 1290
Source: Based on the Field survey conducted by the scholar
Table− 7 Traffic Flow at Jurhera T-Point (Punhana)
Direction of Flow Morning Noon Evening
To Jurhera 640 362 604
Hodal to Badkali 793 1029 697
Badkali to Hodal 952 1100 1014
Source: Based on the Field survey conducted by the scholar
Table− 8 Traffic Flow at Punhana T-Point
Direction of Flow Morning Noon Evening
To Jamalgarh 755 535 810
Hodal to Badkali 1001 720 985
Badkali to Hodal 810 685 790
Source: Based on the Field survey conducted by the scholar
Table− 9 Traffic Flow at Ferozpur Jhirka Crossing
Direction of Flow Morning Noon Evening
To Kaman 920 750 1010
Alwar to Nuh 1130 930 1210
Nuh to Alwar 1001 1050 1280
Source: Based on the Field survey conducted by the scholar
Source: Based on the Field survey conducted by the scholar
VII. CONCLUSION
The findings shows the natural barrier of Aravali in the south west part of the district restrict the east west flow of the area. The accessibility and connectivity of the the tehsil headquarters are much better than the other nodes/villages. In the morning peak hour among the six locations Badkali crossing is fond most crowed. Tauru and Ferojpur Jhirka accounted less number of traffic. Tauru and Ferojpur Jhirka along with Jamalgarh are the points where the numbers of truks are higher because of the exchange of the goods between two states of Rajastahn and Haryana. During lean hour of the mid day a decrease of the vehicle count observed at all crossing except Badkali. Again at evening peak hour the traffic volume increases.
The composition of the traffic shows motor cycle, cars, bicycles,auto rikshaw, truks, and tractors. The major shares of traffic were motor cycle and cars. The finding also shows that private vehicles are increasing day by say to cater the demand of the people. There is also marked and difference in the noon time that the number of four wheeler s has decreased. Badkali is the main junction of the area located at the centre has marked no variation in the traffic volume count at lean hour.
The intra and inter district connectivity are not so much well connected and the facility of transport are also limited. The neighbouring district/states of Gurgaon, Delhi, Rewari, Palwal and Alwar are well served by the Mewat depot. Delhi – Chandigarh is only long distance belt of the served by this depot. The road infrastructure is available there but the villages are deprived of the services buses.
REFERENCES
[1] Chakrabarti, P.K. (1998), “Transport and Economic Development- A Case Study of Indian Railway”, in Vaidya, B.C. (ed.), Readings
in Transport Geography A Regional Perspective, Devika Publication, New Delhi, pp. 332.
[2] Das, D. (1998), “The Relation BetweenTransport and Agricultural Landuse: A Case Study”, in Vaidya, B.C. (ed.), Readings in
Transport Geography A Regional Perspective, Devika Publication, New Delhi, pp. 295.
[3] Hoyle, B.S. and Richard, K. (2001), Modern Transport Geography, Second Revised Edition-, John Wiley and Sons Ltd., Baffin Lane
Chichester,West Sussex London, p.116.
[4] Ibrahim, R. (1984), Market Centres and Regional Development- (A Case Study of Delhi – Jaipur- Agra Triangle), B. R. Publishing Corporation, Delhi-52.
[5] Jana, M. M. (1998), “Transport and Rural Development in DakshiminDinajpur District of West Bengal”, in Vaidya, B.C. (ed.),
Readings in Transport Geography A Regional Perspective, Devika Publication, New Delhi, pp. 105-116.
[6] Sharma, S. K. (1998), “The Study of Transport Network Development in Madhya Pradesh”, in Vaidya, B.C. (ed.), Readings in
Transport Geography A Regional Perspective, Devika Publication, New Delhi, pp. 191-202.
[7] Sivaram, J. (1998), “Transport and Economic Development in Andhra Pradesh”, in Vaidya, B.C. (ed.), Readings in Transport
Geography A Regional Perspective, Devika Publication, New Delhi, pp. 127-149.
[8] Vaidya, B.C. (1998), “Transport Network and Planning Strategy for Backward Region in Maharashtra State: A Case Study of