Simulation and Optimization Modeling Of
Performance of a Cereal Thresher
Engr. C.O.Osueke, Department of Mechanical Engineering, Enugu State University of Science and Technology,
Enugu, Nigeria
Abstract---This work presents a comprehensive mathematical model of the performance of a cereal thresher. The essence of this work is to improve on the performance of grain thresher through a model that will optimize the performance characteristics (velocity, crop feed rate, concave clearance, threshing drum impact force, crop flow rate) of a thresher and minimize its grain damage or losses. To achieve this, equations were derived which describe the threshing rate, threshing loss, grain damage, efficiency and threshing capacity. The equations were used to simulate and optimize the threshing performance of the model. The model was validated with published threshing performance data and it was found generally to fit well, taking R2 values equal to or greater than 0.9 which is highly significant (α=0.000). The developed model enables optimal parameters to be selected for a design in which the objective function (grain damage or losses) is minimized. At 16% moisture level, minimal loss is 3.6792% and efficiency of 92.32% while the performance characteristics are v = 9m/s, Q = 0.12kg/s, c = 0.015m,
Index Terms---: Model, Optimal parameters, Performance, Threshing.
I. INTRODUCTION
The ever growing need for cereals all across the globe has instigated numerous forms of research & development from various researchers. Cereals usage ranges from being used as raw materials in industries for production of malt, beverages, beer, etc to being consumed directly as food. Its post harvest processing could be done through traditional method (manual) or modern method. However, manual system of threshing cereal failed to meet up with this growing demand of cereals and is labour intensive. Singh and Joshi [19] had it that since the process is labour intensive, its operating cost is high. This led to an increase in the use of mechanical systems for this operation. The mechanical process is a repeated process of pounding and dragging of the plant (panicle) over a surface or through an aperture. Lamp[10] in 1959 as reported by Buchanan et al [10] justified and studied the use of centrifugal force as a non-impulsive means of obtaining integral threshing, separating and cleaning in a process. Handling the thresher efficiency, grain damage, losses and capacity has been a major challenge encountered by past researchers. This is because operating conditions such as environment or processing conditions, machine parameters and grain characteristics goes a great length in determining the general performance of cereal threshers.
Various researchers attained success by proper adjustment of these operating conditions. Desta and Mishra[5] developed and conducted performance evaluation of a
sorghum thresher. They combined feed rate at three levels (6,8,10Kg/min), cylinder-concave clearance at two levels (7 and 11mm) and cylinder speed at three levels (300rpm (17.5m/s), 400rpm (10.1m/s), 500rpm (12.6m/s)). The result of the performance analysis showed that threshing efficiency increased with an increase in cylinder speed for all feed rates and cylinder concave clearances. The threshing efficiency was found in the range of 98.3% to 99.9%. At the recommended speed of 400 rpm (10.1m/s), the power required for operating the thresher was 4.95KW and the maximum output of the thresher was 162.7Kg/hr. Saeid et al[18] also tested and evaluated a paddy threshers. He measured the performance of the thresher by varying cylinder speed and crop feed rates at three levels of threshing cylinder (450rpm (15.5m/s), 500rpm (17.3m/s), 550rpm (19.0m/s) and crop feed rate at three levels (low (44Kg/hr), medium (720Kg/hr), high (1,163Kg/hr)). The results obtained from the investigation showed that the grain damage in terms of breakage was in the range of 0.4% to 1.2%. The percentage of grain damage and efficiency increased with an increase in cylinder speed for all feed rates. This calls for a harmonization of performance results to obtain a desired performance and that is the major issue which this work intends to handle.
Simulation of the operating parameters and their optimization using computer aided software (model) is implored to determine and identify the performance characteristic of least threshing loss due to grain damage, incomplete threshing, etc.
II. MODEL STRUCTURE AND DEVELOPMENT The purpose of modeling a physical system is to be able to better understand the fundamental mechanism of that system and to establish the optimum conditions for the construction and operation of the system.
A modular structure is adopted for the package whereby there is only one main program called the "main supervisor" while others exist as modules. Each of these modules acts as a standalone system. The main advantage of this structure is that it allows each module to be executed independent of others. Since only this module needs to be loaded into the computer random access memory (RAM), the working core requirement of the package is drastically reduced. The general structure is shown in Fig 1. It consists of the main supervisor and the following two modules:
• EVTP: Evaluates the thresher performance
• SIMOPT: Simulates and optimizes thresher
In the figure below all the modules are at the same level in the hierarchy so that the main supervisor can access any of the modules on an equal basis.
Fig 1: Modular structure of the software
The main supervisor is the overall driving module to which control ultimately returns. It enables the user to access the other modules in the package
Most optimization techniques today are of the iteration type; that is the optimum point is approached by a step by step method. An algorithm or minimization technique is developed to select the combination of machine parameters and crop characteristics that yield minimum grain losses. The discrete models thus developed are the threshing efficiency model, grain damage model, threshing loss model and capacity model.
III. MODEL DESIGN AND IMPLEMENTATION The model is based on a program designed using mathematical elucidations of past researchers to form discrete models and expressions to obtain an ideal threshing unit. The ideal threshing unit (processor) is the one that produces a perfect threshing of maximum crop throughput, with optimum grain separation, while it preserves the natural shape and quality of grain and minimizes grain loss (Miu, 1995[15]; Miu and Kutzbach, 2000[14]).
Mathematical Modeling of Threshing Process:
The first stage of threshing is that of impact which detaches the grain from straw mat binding (Ndirika 1994 [16])
Huynh et al [7] stated that the rate of detachment of
grains from their bindings is proportional to both the specific energy input to the crop and transmissibility of the energy across the length of the crop mat. The mathematical expression is given by:
ߣ = ܭ்(ߩѵଶଶݓܦ)/(ܳܿ) 1/ݏ݁ܿ (1)
Where, ܦ = drum diameter; ܿ = concave clearance; ߩ = bulk
density of crop; ѵଶ= peripheral velocity of rasp bar; ݓ =
width of thresher; ܳ = mass feed rate of crop; ܭ் = threshing
factor.
Gregory [6] Stated that rate of threshing decreases as the
probability of hitting unthreshed grain decreases.
The mathematical expression is given by:
ௗ ௗே= −
ாభ
ாమே್ܷ (2)
Where, ܷ= unthreshed grain mass; ܰ= number of
impacts; ܧଵ= energy needed per area of impact to detach a
unit mass of grain; ܰ = number of bars; ܷ = threshed grain
mass; ܧଶ= minimum energy to cause damage.
Both models did not include moisture content in their crop characteristic which led to modification, but huynh's model was adopted since it contains required crop characteristics for further analysis. For complete threshing to occur;
ܲ௩ = ܲ (3)
Where ܲ௩= Power available at the threshing cylinder;
ܲ = Power required to detach grains from their
panicle. The mathematical expression for "ܲ௩" is further
developed as:
ܲ௩ = ݇(ߩݓܿݒଷ) (4)
Where, ݇= constant of proportionality Also the
mathematical expression for "ܲ" was further developed as:
ܲ = ܳܭாቂݒଶቀ ொ
మ
௩మఘቁቃ (5)
Where, ܭா= constant depending on grain type; ݒ =
peripheral velocity of cylinder
Substituting equations "5" and "4" into equation"3" and thus rearranging, the mean threshing rate model becomes:
ߣ = ܭ்(ߩѵଶଶݓܦ)/(ܳܿ) (6)
Where, ܭ் = ܭ ܭ
ா
൘ = threshing factor
Brown [3], Nura and Pederson [17] reported that density or bulk density of cereals decreases with an increase in grain moisture for only moisture content range of 10-25%. The reason being that at moisture content above 25%, the starch molecules become saturated and at moisture content below 10%, the starch molecules were dry and inter-molecular spaces are almost contracted and grain approached true density of bone dry material. Since most threshing is done within this moisture content range, the following relationship between bulk density and moisture content was being proposed;
ߩ = ߩௗ(1 − ߙ) (7)
Where, ߩ = bulk density at a given moisture content of crop;
ߩௗ= bulk density at 10% moisture content; ߙ = moisture
content of crop (%wb)
Substituting equation "7" into "6", the mean threshing rate model becomes,
ߣ் =ఘ(ଵିఈ)௩
మ௪
ொ (8)
Mathematical Modeling of Separation Process:
Mathematical expressions were proposed to define migration
MS (Main Supervisor)
SIMOPT EVPT
of grain.
• Migration of grain from the straw mat:
Fig 2: Migration of grain from straw mat.
ߣଶ= (ା
మೡమ ವ)భ మൗ
. ଶொ ఘ௨௪ൗ (9)
Where ߣଶ= mean rate of separation for a grain through straw
mat length; ݃ = acceleration due to gravity; ݇= constant of
proportionality.
• Passage of grain through the concave opening:
According to the screening theory (Wessel, 1967 [21]; Huynh et al., 1982 [7]) it is assumed that a free kernel will pass through an opening of the concave (or cage) if the projection of the kernel on the opening surface is within that area.
Fig 3: Geometry of concave opening of concave sieve.
The probability that grains will reach this separation surface is the same over the separation length as is the probability of free grain passage through the openings of separation surface (Huynh et al., 1982 [7]; Mailander, 1984 [11]; Miu, 1994, 1995[13,15]]; Miu et al., 1997[12]; Kutzbach and Quick, 1999 [9]).
The mean rate of grain separation through the concave opening is given by:
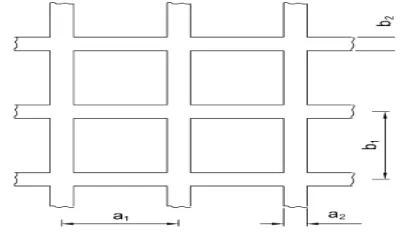
ߣଷ=௨ೞ(భିమିௗ)(భభమభିమିௗ) (10)
Where ܽଵ= centre line distance between rods (mm); ܽଶ= rod
diameter (mm); ܾଵ= center line distance between bar (mm);
ܾଶ= width of a bar (mm); ݀ = equivalent diameter of a grain
(mm); (ܽଵand ܾଵ are dependent on crop size characteristic)
Threshing Efficiency Model
The mathematical expression for the dwell time of panicle within the threshing are is given by;
ݐ=ଶ௩ (11)
Where, ܮ = concave length
The threshing efficiency model is given by:
ܧ݂݂݅ܿ݅݁݊ܿݕ = 1 − ݁ିఒ௧ (12)
Substituting equation "11" and "8" into equation "12", the threshing efficiency model becomes:
ܧ݂݂݅ܿ݅݁݊ܿݕ = 1 − ݁ି.ହ[(ఘ(ூିఈ)௩௪)/ ொ] (13)
Threshing Loss Model
The threshing loss model is given by
ܶܰܮ = ݁ି.ହ(ఘ(ଵିఈ)௩௪) / (ொ) (14)
Grain Damage Model:
Arnold [1], King and Riddolls [8], Vas and Harison [20] carried out studies showing that parameters such as moisture content, cylinder speed, concave clearance and feed rate caused significant variation in percentage mechanical damage. After further improvements, the grain damage model was found to be given by:
ܩܦ = ݁ି൬(భషഀ)ೢೡమೂ ൰మ౬ై (15)
Where ݇ௗ= damage constant
IV. COMPUTER PROGRAMMING OF THE MODEL A model based on VISUAL BASIC programming language was developed to compute predicted values for the threshing performance of each variation from a varying range of crop and machine parameters. The VISUAL BASIC language was chosen because it is widely available on microcomputers, and most scholars are already familiar with the language. The developed expressions and models in the section above were used to develop the computer program. The design of the package involved a number of different steps.
• General design principles for the package
• Structure and implementation
• Function of various module
The computer program was packaged in such a way that it can be used to perform three (3) different operations.
• Run performance characteristic operation such that the
crop and machine parameters are entered individually and then simulated to view performance results. Using this operation, a parameter is kept constant while others are varied to ascertain its effect on the thresher performance.
• Run a task in which crop and machine parameters are
varied and adjusted, a simulation option is selected to output performance results of the individual variations, the results are displayed and finally the optimization option is selected to display the crop and machine parameters that produced the
best performance (least ܶܰܮ)
• Process raw data entries whereby one can decide to
Read Input Data
No
Yes
No
Yes
Yes
No
Fig 4: Flow chart of the program for the developed model
The machine parameters, crop parameters and constants as have been mentioned above were selected based on study and comparison made from works of past researchers. The table below shows these parameters and their range of variations.
TABLE I
FIXED CROP PARAMETERS
PARAMETER DIMENSION
(m) Center line distance between adjacent
concave rods, ܽଵ 0.019
Concave rod diameter, ܽଶ 0.009
Center line distance between adjacent
concave bar ܾଵ 0.033
Width of concave bars, ܾଶ 0.009
TABLE II
VARIATION OF CROP AND MACHINE PARAMETERS
PARAMETERS VARIATIONS
Feed rate, ܳ (kg/s) 0.02;0.08;0.12;0.14;0.19;0.23
Bulk density, ߩ
(kg/m3)
4.9;5.9;6.8;7.9;9.8;11.9
Moisture content
ߙ (%) 10;11;13;17;20;25
Kernel diameter,
݀(݉) 0.0038
Concave clearance,
ܿ(݉) 0.01;0.015;0.02;0.025;0.03;0.035
Cylinder diameter,
ܦ(݉)
0.5;0.6;0.7;0.8
Cylinder width, ݓ(݉) 0.1;0.15;0.28;0.15
Concave length, ܮ(݉) 0.6;0.7;0.8;0.9
Cylinder speed,
ݒ(݉/ݏ)
9,11,15,18,20,24
TABLE III TABLE OF CONSTANTS
CONSTANTS VALUES
ܭ்: Threshing Constant 9.164 ∗ 10ିସ
ߛ: Grain straw ratio 0.37
V. MODEL APPLICATION, TESTING AND VALIDATION:
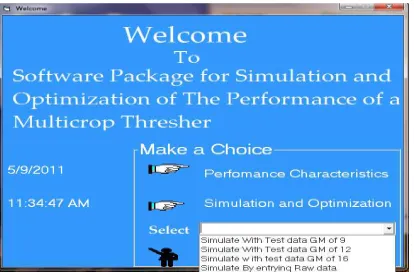
The software was designed to determine the effect of a range of varied machine and crop parameter on the performance of a cereal thresher and hence select the best set of parameters. The screen shots of the model application are shown below:
Fig 5: Operation window of the model
Start
3.Threshing Formular 1.Crop Characteristics
2.Threshing parameters
Print Input Data
Selection of Threshing Formular
Compute: Threshing Formular
Evaluate crop Dwell Time
Determine Threshing capacity Threshing Efficiency
Print Observed Threshing Conditions for the Process Select mean rate of
Threshing Kernel
Determine Least Loss Highest Threshing Efficiency for the threshing Process
All Threshing Process Covered
Update Crop parameters Machine Variables
Loss and Damage Analysis
Is any crop Damage Observed
Stop
Establish the Variation in Energy Absorbed and Grains Energy Required to Detach Grains
Establish the Variation in Energy Absorbed and Grains Energy at Break Point All
machine and Crop Paramet er
1. Threshing Efficiency 2.Thresher Capacity 3.Threshing losses
Print Output
4. Grain Damage
C
B C
A
C
B
Fig 6: Performance characteristics window
Fig 7: Window for entry of parameters
Fig 8: Window for display of simulated & optimized result
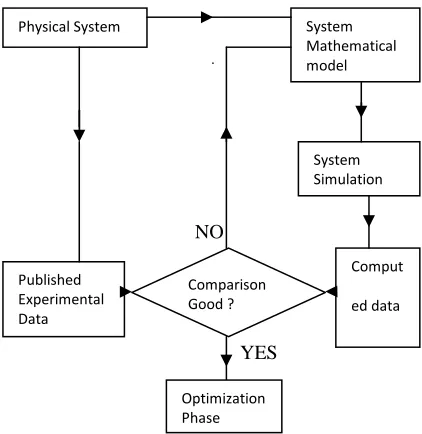
In order to ascertain the ideality of the developed model, the model was verified with an experiment of same parameter and works of past researchers to prove that the mathematical models developed are at least consistent with published results of existing threshers. To achieve this, the study was conducted as illustrated in the figure below:
NO
N
YES
Fig 9: Flow chart of model validation
To perform this validation, data from works of past researchers, developed model and experimental model were studied analytically and statistically and then compared. These data was gotten from evaluating the effect of a particular parameter on threshing performance of past researchers, developed model and experimental model. This is done by varying that parameter at six levels and keeping the rest fixed. The data from the respective models are plotted as shown below and then analysed.
Fig 10: Graphical comparison of Huynh's, Developed and experimental Model.
From the graph above, it is observed that as velocity increases, the threshing efficiency increases in all model cases. The statistical analysis is shown below:
75 80 85 90 95 100
0 10 20 30
E
F
F
IC
IE
N
C
Y
(
%
)
VELOCITY (m/s)
Experiment al Model
Huynh's Model
Developed Model Physical System
Published Experimental Data
System Mathematical model
Comparison Good ?
Comput
ed data System Simulation
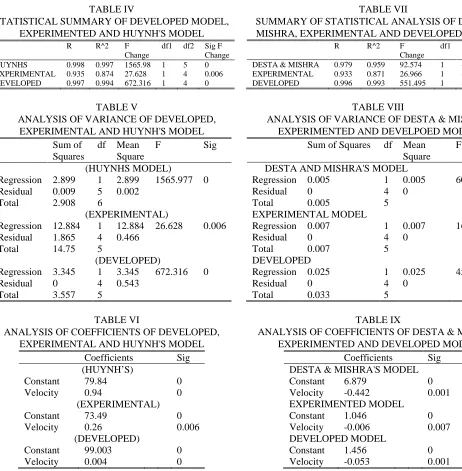
TABLE IV
STATISTICAL SUMMARY OF DEVELOPED MODEL, EXPERIMENTED AND HUYNH'S MODEL
TABLE V
ANALYSIS OF VARIANCE OF DEVELOPED, EXPERIMENTAL AND HUYNH'S MODEL
Sum of
Squares
df Mean Square
F Sig
(HUYNHS MODEL)
Regression 2.899 1 2.899 1565.977 0
Residual 0.009 5 0.002
Total 2.908 6
(EXPERIMENTAL)
Regression 12.884 1 12.884 26.628 0.006
Residual 1.865 4 0.466
Total 14.75 5
(DEVELOPED)
Regression 3.345 1 3.345 672.316 0
Residual 0 4 0.543
Total 3.557 5
TABLE VI
ANALYSIS OF COEFFICIENTS OF DEVELOPED, EXPERIMENTAL AND HUYNH'S MODEL
Coefficients Sig
(HUYNH’S)
Constant 79.84 0
Velocity 0.94 0
(EXPERIMENTAL)
Constant 73.49 0
Velocity 0.26 0.006
(DEVELOPED)
Constant 99.003 0
Velocity 0.004 0
The graphical and statistical comparison shown above shows that the developed model is similar to that of huynh's [7], is reflected by the experimental model and ranks highest in terms
of its "R2" value and level of significance, followed by that of
huynh's[7] and then experimental. This proves that the developed model is valid.
Further validation of the developed model was obtained using data set reported by Desta and Mishra [5] for sorghum thresher.
Data set from Desta and Mishra [5] was also used to verify the threshing loss model. Their model was compared with the developed and experimental model and the result is presented in the table below:
TABLE VII
SUMMARY OF STATISTICAL ANALYSIS OF DESTA & MISHRA, EXPERIMENTAL AND DEVELOPED MODEL
R R^2 F
Change
df1 df2 Sig F Change DESTA & MISHRA 0.979 0.959 92.574 1 4 0.001 EXPERIMENTAL 0.933 0.871 26.966 1 4 0.007 DEVELOPED 0.996 0.993 551.495 1 4 0
TABLE VIII
ANALYSIS OF VARIANCE OF DESTA & MISHRA, EXPERIMENTED AND DEVELPOED MODEL
Sum of Squares df Mean
Square
F Sig
DESTA AND MISHRA'S MODEL
Regression 0.005 1 0.005 6033.765 0
Residual 0 4 0
Total 0.005 5
EXPERIMENTAL MODEL
Regression 0.007 1 0.007 169.154 0
Residual 0 4 0
Total 0.007 5
DEVELOPED
Regression 0.025 1 0.025 4566.44 0
Residual 0 4 0
Total 0.033 5
TABLE IX
ANALYSIS OF COEFFICIENTS OF DESTA & MISHRA, EXPERIMENTED AND DEVELOPED MODEL
Coefficients Sig
DESTA & MISHRA'S MODEL
Constant 6.879 0
Velocity -0.442 0.001
EXPERIMENTED MODEL
Constant 1.046 0
Velocity -0.006 0.007
DEVELOPED MODEL
Constant 1.456 0
Velocity -0.053 0.001
The statistical comparison of the threshing loss model for Desta & Mishra [5], developed and experimental model shows that the experimental model reflected the developed model
which is in turn similar to that of Desta & Mishra [5]. The R2
value and level of significance of the developed model was found to rank highest amongst the three models. This also goes further to prove the validity of the developed model.
Furthermore the developed model was validated by comparing its capacity model with that obtained by Dash and Das, (1999) [4] using the moisture content parameter at cylinder speed of 13m/s. This was achieved by graphical and statistical analysis of the data generated by Dash and Das model, Developed model and Experimental model.
R R^2 F
Change
Fig 11: Graphical comparison of Dash & Das, Developed and Experimental model.
From the graph shown above, the capacity of the thresher increased to a point and started droping in all model cases. This is because at low moisture content (9%-14%), so much damage occurs and at a high moisture content (18%-25%), the capacity is also reduced due to more impact force required. This analysis suggests that threshing be done at 15%-17% which satisfies Dash and Das [4] model thus verifying the developed model.
The statistical comparison is as shown below
TABLE X
SUMMARY OF STATISTICAL ANALYSIS OF DASH & DAS, DEVELOPED AND EXPERIMENTAL MODEL
R R^2 Sig
F Change DASH & DAS 0.983 0.967 0.001 DEVELOPED 0.985 0.971 0.007 EXPERIMENTAL 0.906 0.821 0
TABLE XI
ANALYSIS OF VARIANCE OF DESTA & MISHRA, EXPERIMENTED AND DEVELPOED MODEL
Sum of Squares df Mean
Square
F Sig
DASH & DAS MODEL
Regression 255.265 2 127.633 43.577 0.006
Residual 8.787 3 2.929
Total 264.052 5
DEVELOPED MODEL
Regression 272.863 2 142.612 53.576 0.006
Residual 2.754 2 1.578
Total 275.617 4
EXPERIMENTAL MODEL
Regression 239.104 2 119.552 13.720 0.006
Residual 52.284 6 8.714
Total 291.388 8
TABLE XII
ANALYSIS OF COEFFICIENTS OF DESTA & MISHRA, EXPERIMENTED AND DEVELOPED MODEL
Coefficients Sig
DASH & DAS MODEL
ߙ 26.653 0.006
ߙଶ -0.826 0.005
CONSTANT -29.045 0.437
DEVELOPED MODEL
ߙ 21.877 0.006
ߙଶ -0.722 0.004
CONSTANT 24.009 0.000
EXPERIMENTAL MODEL
ߙ 4.140 0.41
ߙଶ -0.147 0.19
CONSTANT 136.503 0.000
The statistical analysis thus goes further to validate the
developed model given that the significance and R2 values of
the respective models are similar; with that of the developed model ranking highest followed by Dash & Das [4] then experimental. The statistical result of the experimental model also confirms this validation.
VI. RESULT AND DISCUSSION
The developed model when RUN yielded results which are discussed in faces.
VII. THRESHING EFFICIENCY MODEL The mathematical model for threshing efficiency predicts
mean rate of threshing of grain as a function of the number and energy level of impact of the unthreshed material. The
equation also quantifies this rate in terms of (ݒ, ܳ, ܿ, ߩ, ߙ).
The effect of those varied parameters within a specified range on threshing efficiency was reported thus;
Effect of Cylinder Speed on Threshing Efficiency:
Fig 12: Effect of velocity on threshing efficiency
It was found that as the velocity increases, the threshing efficiency increases. This can be explained on the basis that at higher velocity, thinning of the crop material occurs and this gives greater opportunities for threshed grain to penetrate the
100 110 120 130 140 150 160 170 180 190
9 14 19 24
C
A
P
A
C
IT
Y
(
K
g
/h
r)
MOISTURE CONTENT (%wb)
Dash and Das model Developed model Experimental model
96.285 96.29 96.295 96.3 96.305 96.31
0 10 20 30
E
F
F
IC
IE
N
C
Y
(%
)
straw mat.
Effect of Feed Rate on Threshing Efficiency:
Fig 13: Effect of feed rate on threshing efficiency
The result also shows that when feed rate increases, threshing efficiency decreases. The reason being that for a high feed rate, the threshing rate is less and the kernels would take longer time to travel through the mat. Furthermore the concept of energy balance employed by bittner et al, (1968) [2] is expressed by
Eimpact = Eabsorbed by cushion + Eabsorbed by specimen + Erebound
Using the above equation to explain the figure above, it can be deduced that at low feed rate, the energy available at the threshing drum are absorbed by the grains for the removal of the kernel heads from the stalks, then as feed rate increase, more grains cluster within the threshing drum which reduces the individual energy absorbed by the grains while increasing the cushioning effect thereby reducing efficiency. At a feed rate of 0.08Kg/s, the energy absorbed by cushioning, energy absorbed by the grains and energy of rebound of grains are at a state of equilibrium. This leads to a bi-phasic graph depicting a phase of high reduction in threshing energy and the other a phase of high cushioning.
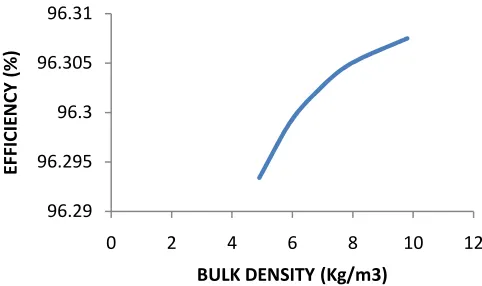
Effect of Bulk Density on Threshing Efficiency:
Fig 14: Effect of bulk density on efficiency
Increasing the bulk density increases the threshing efficiency.
This might be due to the crop stream between the cylinder and the concave becoming denser, thus providing less cushioning for the grains, since volume flow rate is expressed as feed rate divided by material density.
Effect of Concave Clearance on Efficiency:
Fig 15: Effect of concave clearance on threshing efficiency
Decreasing the concave clearance resulted in increased efficiency. This is because decreasing concave clearance may have increased the chance of a grain being struck by the bar or spike and increased the chance of multiple impacts to the grain before it is passed from the threshing zone.
Effect of Moisture Content on Threshing Efficiency:
Fig 16: Effect of moisture content of threshing efficiency
It is observed that an increase in the moisture content results in decreased threshing efficiency.
From the model proposed, the higher cylinder speed and small concave would result in increased threshability. The model has served to emphasize the facts as stated by Arnold (1964) [1], Vas (1969) [20] and Huynh (1982) [7].
VIII. THRESHING LOSS MODEL
The mathematical model as developed, predicts the threshing losses as an exponential function of the threshing constant, significant value, velocity, cylinder width, etc. The general believe is that the reduction of losses and its possible elimination depends mainly on the use of lower cylinder speed. The model makes it easier to obtain a compromise between longer concave and reduction in cylinder speed. The
96.24 96.25 96.26 96.27 96.28 96.29 96.3 96.31 96.32
0 0.1 0.2 0.3
E
F
F
IC
IE
N
C
Y
(%
)
FEED RATE(Kg/s)
96.29 96.295 96.3 96.305 96.31
0 2 4 6 8 10 12
E
F
F
IC
IE
N
C
Y
(
%
)
BULK DENSITY (Kg/m3)
96.26 96.27 96.28 96.29 96.3 96.31 96.32
0 0.01 0.02 0.03 0.04
E
F
F
IC
IE
N
C
Y
(%
)
CONCAVE CLEARANCE (m)
96.26 96.27 96.28 96.29 96.3 96.31
0 5 10 15 20 25 30
E
F
F
IC
IE
N
C
Y
(
%
)
achievement of this will enhance better separation and fewer
losses. The result of the verification (R2 = 0.996 and
significance value of 0) shows that the developed equation fits well the existing threshers and covers 99% of the thresher population. From this validation, another notable contribution of the author is the development of a workable threshing loss model based on a set of pertinent process variables.
IX. OPTIMIZATION MODEL
The model presents the optimum grain losses in the threshing unit as a function of the threshing loss and damage loss. The model designates 5% as a tolerable target loss (3% threshing loss and 2% damage loss).
The model coded this loss as the total machine loss (TNL). The simulation model developed brings into focus losses that are incurred as the machine and crop parameters are changed.
The results discussed above show that the mathematical models developed by this study which incorporated moisture content parameter generally omitted by most previous models are more appropriate in describing the threshing process. It even had a better correlation than that of Huynh's
X. CONCLUSION
The work presented so far has been motivated by the great need for an appropriate cereal thresher for use by farmers and food processers.
It is the belief of the researcher that one possible solution to this dilemma is to first develop mathematical equations that describe the threshing process of the threshing unit instead of relying on a regression fit of performance data from one machine. Then use computer to stimulate its performance prior to full scale development and thereafter only construct the most promising design.
This work then started by reviewing published works that describe the threshing process. While much is known about the threshing process that occurs in the cylinder-concave unit, many of the mathematical models previously developed have the following shortcomings:
• Failed to include moisture content parameter in their
formulation
• All the models were for combined systems. These have
different crop models from stationary mechanical threshers
• None of the models have been implemented to rate their
success.
However, in overcoming these short-comings this work adopted the following methodology: It
• Developed mathematical equations to explain the
threshing, separation and damage processes:-
݉݁ܽ݊ ݐℎݎ݁ݏℎ݅݊݃ ݎܽݐ݁ ߣ = ்݇(ߩܸଶݓܦ) / (ܳܥ)
ܶℎݎ݁ݏℎ݅݊݃ ݈ݏݏ ܶܰܮ = ݁ି.ହ[(ఘ(ூିఈ)௩௪)/ ொ] ܩݎܽ݅݊ ܦܽ݉ܽ݃݁ ܩܦ = ݁ି൬(ଵିఈ)௪௩ொ ൰
ܧ݂݂݅ܿ݅݁݊ܿݕ ܧ݂݂ = 1 − ݁ି.ହ[(ఘ(ூିఈ)௩௪)/ ொ] ܶℎݎ݁ݏℎ݁ݎ ܥܽܽܿ݅ݐݕ ܥܣܲܶܪ = ܧ݂݂ݏ ∗ ܳ ∗ ݎ
These equations quantify the performance of the process
• Verified all developed equations with published data
• Simulated and optimized the performance to obtain
variables for optimum loss.
• Developed a software package ‘C5’for all the derived
equations.
• Implemented and validated the package with data from a
cereal thresher built in the department.
Thereafter, principles of grain threshing were defined and some of the variables responsible for the process were exposed. These principles were then used to derive equations that predict grain threshing. The work presents threshing, separation and damage processes in the cylinder-concave unit as related to the energy generated by the impact of the cylinder and the transmission of this energy across the straw mat.
Furthermore, the models were used to predict the performance characteristics of a typical cereal thresher. Measured data reported in literature were used to calibrate and verify the equations. The predicted results were found
generally to fit published data well giving R2 values of equal
or greater than 0.90 which were highly significant level of 0.002. Then a simulation and optimization model to predict optimum designs was developed. The model estimated minimum losses for various combinations of speed, clearance, feed rate and moisture content. The model showed that for a level of variables it was possible to obtain an optimum situation of high threshability and low kernel damage. The dissertation succeeded in developing a software package which programmed all the equations into one model that characterizes, simulates and optimizes thresher performance.
The programme was designed to run on ‘Visual basic’. The package was designed to have a modular structure and to be interactive. Simulation and optimization studies using the package were made to yield results in tabular forms which were then printed out. Also, the success rate of the model is demonstrated on existing threshers not used for their calibration. The results showed that the models are highly valid for mechanical threshers.
It is expected that the models would be of wider application. Through these models, ways and means of improving the existing threshers are suggested. It is therefore believed that this work will contribute to a better understanding of the threshing process and its performance by providing a rational theory. Specifically, the achievements or contributions of this dissertation may be summarized as follows:
• Useful applicable equations which incorporate grain
moisture content parameter, omitted by most previous researchers have been developed for threshing efficiency, grain damage for stationary grain threshers.
• Simulation and optimization models have been developed
which prescribe various combinations of threshing variables to obtain optimum design
• An interactive computer software package has been
developed for performance characteristics and
• The models have been successfully implemented on existing threshers and some useful recommendations are made for improving them
Based on the achievements listed above, it can be concluded that this work has attained its set objectives.
XIV. ACKNOWLEDGEMENTS
I am graciously thankful to Prof, E.I.E. Ofodile, Prof, Prof, O.C. Iloeje, Dr. N.O. Ibekwe for their immense support towards the actualization of this work. Thanks also to Pastor Felix Aguboshi, head of department, Computer Science, Federal Polytechnic Oko, Anambra State Nigeria for assistance in statistical analysis.
XII. REFERENCES
[1] Arnold, R.E., 1964. Experiments with Rasp Bar Threshing Drums: Some Factors Affecting Performance. J. Agric. Engineering Research ,9,99-131
[2] Bittner, D.R., H.B. Manbeck, and N.N. Mohsenin. 1967. A Method for Evaluation Cushioning Materials used in Mechanical Harvesting and Handling of Fruits and Vegetables. Trans. Of the ASAE 19 (6), 711-714 [3] Browne, D.A. 1962. Variation of Bulk Density of Cereals with Moisture
content. J. Engineering Research 7, 288 – 299.
[4] Dash, S.K and D.K Das, 1989. Development of a power-operated Paddy thresher. Mechanization in Asia, Africa and Latin America, 20(3), 37-39. [5] Desta, K and T.N. Mishra, 1990. Development and Performance
Evaluation of a Sorghum Thresher. Mechanization in Asia, Africa and
Latin America, 21(3), 33 – 37.
[6] Gregory, J.M., 1988. Combine model for Grain Threshing. J.
Mathematical Computer Modeling, 11, 506 – 509.Research Verification
(M.E.R.V.). A.S.A.E. Paper No 86 – 5032. St Joseph, MI 49085. [7] Huynh, V.M., T. Powell and .J.N Siddal, 1982. Threshing and separation
process: A Mathematical Model. Trans of the A.S.A.E,, 25(1), 65 – 73. [8] King, B.L. and A.W. Riddolls, 1960. Damage to Wheat Seed and Pea
Seed in Threshing. J. Engineering Research, 5, 387 – 398.
[9] Kutzbach, H.D., Quick, G.R., 1999. Harvesters and Threshers. CIGR
Handbook of Agricultural Engineering: Plant Production
Engineering, , 3, 311–347.
[10] Lamp, B.J. and W.F. Buchanan, 1960. Centrifugal Threshing of Small Grains. Trans. of the ASAE 3(2), 24 – 28
[11] Mailander, M., 1984. Development of a dynamic model of a
combine harvester in corn. ASAE Paper No. 841588. ASAE, St. Joseph,
MI.
[12]Miu, P.I., Beck, F., Kutzbach, H.D., 1997. Mathematical modeling of
threshing and separating process in axial threshing units. ASAE Paper
No. 971063. ASAE, St. Joseph, MI.
[13] Miu, P.I., 1994. Concave separation in a tangential threshing unit. ASAE Paper No. 941544. ASAE, St. Joseph, MI.
[14] Miu, P.I., Kutzbach, H.D., 2000. Simulation der Dresch- und Trennprozesse in Dreschwerken (Simulation of threshing and separation processes in threshing units). Agrartechnische Forschung
Sonderheft 6, 1–7.
[15] Miu, P.I., 1995. Modelarea procesului de treier la combinele de
recoltat cereale (Mathematical Modelling of Threshing Process in Cereal Combine Harvesters), PhD diss. Bucharest:‘Politehnica’
University of Bucharest, Romania.
[16] Ndirika, V.I.O. 1994. Development and Performance evaluation of a millet thresher. Journal of Agricultural Engineering Technology, 2, 83-88.
[17] Nura Islam and T.T. Pedersen, 1987. Some Physical Properties of Wheat and Paddy and their relationships. Mechanization in Asia, Africa and
Latin America, 18(1), 45 – 50.
[18] Seyed Saeid Mohtasebi, Mansoor Behroozi Lar, (2006) ‘’ a new design for grain combine thresher’’. International journal of agriculture &
biology, 680-683.
[19] Singh, K. and H.C. Joshi, 1979. Axial Flow Thresher. Appropriate
Technology News letter, U.P. India. 2(4): 5 – 6.
[20] Vas, F.M. and H.P. Harison, 1969. The Effect of selected Mechanical Threshing Parameters on Kernel Damage and threshibility of Wheat.
Canadian Agric. Engineering, 11(2), 88 – 87, 91.
[21] Wessel, J., 1967. Grundlagen des Siebens und Sichtens. Teil II(Fundamentals of screening and winnowing. Part II).Aufbereitungstechnik 13 (4), 167–180.