Automatic Test Case Generation using Sequence
Diagram
Vikas Panthi
Department of Computer Science & Engg., National Institute of Technology, Rourkela
Durga Prasad Mohapatra
Department of Computer Science & Engg., National Institute of Technology, Rourkela
ABSTRACT
Software Testing plays a important role in Software development because it can minimize the development cost. We Propose a Technique for Test Sequence Generation using UML Model Sequence Diagram.UML models give a lot of information that should not be ignored in testing. In This paper main features extract from Sequence Diagram after that we can write the Java Source code for that Features According to ModelJunit Library. ModelJUnit is a extended library of JUnit Library. By using that Source code we can Generate Test Case Automatic and Test Coverage. This paper describes a systematic Test Case Generation Technique performed on model based testing (MBT) approaches By Using Sequence Diagram.
Keywords
Test Case Sequence, Model Based Testing, ModelJunit, EFSM, Sequence Graph.
1.
INTRODUCTION
Testing is an important stage of software development and maintenance. It provides a method to establish confidence in the reliability of software. it is a challenging task for analysis of unified modelling language (UML) models since the information about a system is distributed across several model views. UML models are intended to help to reduce the complexity of a problem, with the increase in product sizes and complexities. Still, the UML models themselves become large and complex involving thousands of interactions across hundreds of objects. it is cumbersome for generating test models like control flow graph from source code. This is especially true of large programs. The UML sequence diagrams are used for modelling discrete behaviour of an object through sequence graph. Such states and transitions are critical to decide the specific operation invocations that would be made based on the conditions arising during a scenario execution. For unit level testing, we can derive tests from UML state machine diagrams, which embody the behavioural description of each component [4].
The information about a system is distributed across several model views of a system, captured through a large number of diagrams. UML models are intended to help reduce the complexity of a problem, with the increase in product sizes and complexities. Still, the UML models themselves become large and complex involving thousands of interactions across hundreds of objects. Many present day software products are state based. In such systems, the system behaviour is determined by its state [1]. In other words, a system can respond differently to the same event in different states. Therefore, unless a system is made to assume all its possible states and tested, it would not be possible to uncover state-based bugs. Adequate system testing of such software requires
satisfactory coverage of system states and transitions. Generation of test specifications to meet these coverage criteria can be accomplished by using the state model of a system. It is a major problem to meet the requirement specification for the systematic production of high-quality software. However, it is a non-trivial task to manually construct the state model of a system. Therefore, with continually increasing system sizes, the issue of automatic design of system test cases is assuming prime importance. A properly generated test suite may not only locate the errors in a software system, but also help in reducing the high cost associated with software testing [4].
2.
UML SEQUENCE DIAGRAMS
A Sequence diagram illustrates the objects that participate in a use case and the messages that pass between them over time for one use case. A Sequence diagram is a dynamic model that supports a dynamic view of the evolving systems. It shows the explicit sequence of messages that are passed between objects in a defined interaction [14].
The Sequence Diagram elements are separated into two types:
Header Elements – It is in the header section of the diagram.
Body Elements – It is in the body Section of Diagram.
The header portion of the sequence diagram represents the components or objects of the system being modelled and are laid out horizontally at the top of the diagram [11].
Fig 1. Basic Elements of Sequence diagram
message m else send message n”) and iteration (e.g. “send message m multiple times”) or state-dependent behavior [9].
Fig 2. Sequence diagram and its various notations [12]
3.
TEST CASE GENERATION USING
SEQUENCE DIAGRAM
In This section, we describe our proposed method to automatically generate test Cases from UML Sequence diagram. We first provide some basic definitions of relevant test coverage criteria. After that we will defined our proposed approach to the generation of test cases.
3.1
Some basic Definitions
Some of the basic terms will be used to in our methodology are defined as follows.
3.1.1
Definition 1
:Test case: A test case is the triplet [I, S, O], where I is the initial state of the system at which the test data is input, S is the test data input to the system and O is the expected output of the system [from our paper]. The output produced by the execution of the software with a particular test case provides a specification of the actual software behavior.
3.1.2
Definition 2:
Levels of testing: In object-oriented system, testing is
generally done at three different levels of abstraction: class level, cluster level and system level. Class level testing test the code for each operation supported by a class as well as all possible method interactions within the class. Class-level testing also requires testing all methods in each of the states that a corresponding object may assume. At cluster-level testing, the interactions among cooperating classes are tested. System-level testing is carried out on all the clusters making up a complete system.
3.1.3
Definition 3:
Sequence Diagram : A sequence diagram is a tuple (L, O, E,
M, <, Ro,l, Ro,e, Ro,m) where L is a set of lifelines, O is a set of Occurrence Specifications, E is a set of Execution Specifications and M is a set of messages, < is a total ordering on O, Ro,l is a relation- ship between O and L indicating lifelines covered by Occurrence Specifications, Ro,e is a relationship between O and E indicating initial and terminal Occurrence Specifications of every Execution Specification,
Ro,m is a relationship between O and M indicating end points of every message.
3.1.4
Definition 4:
Sequence graph: A Sequence can be viewed as a graph called
a Sequence graph G= (N, T), where N is the set of nodes (vertices) of G and T is the set of edges or massage. In G, nodes of edges. In G, nodes represent object and edges represent [5] massage between object. Since every node of a Sequence graph represents a Object, we shall use the terms „node‟ and „Object‟ interchangeably when no confusion arises. Without any loss of generality.
3.1.5
Definition 5:
Directed graph or graph: The number of predecessors of a
node is its in-degree, and the number of successors of the node is its out-degree. A path from a node x1 to a node xk in a graph G = (V, E) is a sequence of nodes (x1, x2..., xk) such that
(xi, xi+1) ϵ E for every i, 1≤ i ≤ k-1.
3.1.6
Definition 6:
Extended Finite State Machine (EFSM):An Extended Finite
State Machine (EFSM) is defined as a 7 tuples M= (I, O, S, D, F, U, T)
Where I= set of input symbols. O= set of output symbols. S= Set of symbolic states.
D= an n-dimensional linear space D1×D2 × Dn. F= set of enabling functions fi: D→ {0, 1}. U= is a set of update functions Ui: Di→Dj T= Transition relation T: S×F×I→ S×U×O
3.1.7
Definition 7:
Subpath: A subpath P from vertices nito nkis a sequence of
nodes ni, ni+1, . . . , nk, where for each adjacent pair of nodes (ni+j , ni+j+1) there is an edge in G for 0 <i< k - i.
3.1.8
Definition 8:
Transition path: We consider any sequence of transitions
from the initial state to a final state in a sequence graph to be a transition path.
3.1.9
Definition 9:
Boundary: A boundary is defined by a set of data points. A
boundary consists of several segments and each segment of the boundary is called a border. Each border is determined by a simple predicate in the path condition [9]. In Figure 6, consider the condition max_limit_money > withdraw_Money. Here the variable max_limit_money represents the maximum limit of withdraw money, in one transaction. The domain of the variable max_limit_money is the set of all integers. For values of max_limit_money less than equal to 40000
3.2
Some basic coverage Criteria
In this section, we discuss some of the relevant coverage criteria which are used in our approach.
3.2.1
Object Coverage
It covers every object in sequence diagram for basic test generation. Object coverage is a test adequacy criterion that requires tests to check programs‟ output variables [16]. All variables still defined when executing in test scope (even those which are not visible, such as private fields of objects) are considered by object coverage.
3.2.2
Message Sequence Path criterion:
For each sequence diagram, there must be at least one test case T such that when the software is executed using T, the software that implements the message sequence path of the sequence diagram must be executed. The message sequence path coverage criterion is used to generate tests from the sequence diagrams. For each sequence diagram in the specification, a test case is generated for each normal and for each alternative message sequence [22].
3.2.3
Full predicate coverage:
Full predicate coverage requires that each clause in the predicate is tested independently by a test suite. In other words, a test suite is said to achieve full predicate coverage if each clause in each predicate on every transition is made to independently affect the outcome of the predicate. Given a test set TS and sequence graph G, TS must cause each clause in every predicate on each message in G to take on the values TRUE and FALSE in turn. But all the other clauses in the predicate have values, such that the value of the predicate will be the same as the clause being tested [4]. This ensures that each clause in a condition is separately tested.
3.2.4
Boundary-testing criterion:
The boundary-testing criterion is satisfied for inequality borders. If each selected inequality border B is tested by two points (ON-OFF) of test input domain such that, if for one of the point the outcome of a selected predicate r is true, then for the other point the outcome of r is false. Also the points should satisfy the initial path associated with B and the considered points should be as close as possible to each other. We should test carefully because domain boundaries are particularly fault prone [11]. Boundary-testing criterion is a criterion for ensuring that a boundary is tested adequately. Instead of generating several test data values that achieve transition path coverage, we only test the border determined by a simple predicate. It helps to reduce the number of test cases significantly; at the same time, the generated test cases achieve very high test Coverage [4].
3.3
ATGSD–Our proposed approach to
Generate Test Cases
In this section we, discuss our proposed approach to generate test cases from UML Sequence diagram. We have named our approach, Automatically Test Sequences Generation from Sequence Diagram (ATGSD).
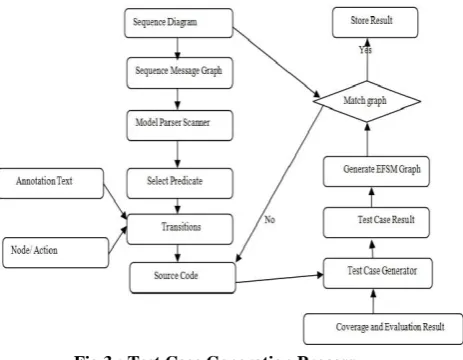
Our approach for generating test cases is schematically shown in figure 3. The first step is constructing the Sequence diagram. The next step is to convert the Sequence diagram into Sequence graph. Then, the graph is traversed to select the
predicate functions. In fourth step, we transform the predicate into source code. Then, we construct the Extended Finite State Machine (EFSM) from the code. Finally, we generate the test data corresponding to the transformed predicate functions and store the generated test data for future use. The test case generation steps are discussed below in more detail.
3.3.1
Construction of Sequence Diagram
First, we construct the Sequence diagram. Sequence Diagram offers a system-level view that describes the complete function of a system or application because a Sequence diagram captures each possible massage and predicate of the system. Therefore, the use of Sequence Diagram helps reduce the possibility of software “hangs” and other unexpected behavior because you are forced to consider every alternative to which the software needs to respond.
Fig 3 : Test Case Generation Process
You can design a system so that it scales to handle multiple Object reactions and transitions based on any combination of events. Sequence diagram are similar to graphical dataflow programs in that they are self-documenting and promote the easy transfer of knowledge between developers. A new member of a design team can look at a sequence diagram and quickly grasp the elements of a system.
3.3.2
Conversion of sequence diagram into
sequence graph
Then, we convert the sequence diagram into sequence graph. a sequence graph G = (N, T), where N is the set of nodes (vertices) of G and T is the set of edges or massages. In G, nodes represent object and edges represent transitions or massages between object. Without any loss of generality, we assume that there is a unique node that corresponds to the initial object and that one or more nodes represent the final states.
3.3.3
Model parser/ Scanner
The purpose of the model parser is to keep the path traversal details of the sequence diagram.
3.3.4
Selection of Predicate
predicate selection. In this work, we have used a DFS traversal, as with DFS, it becomes easy to keep track of the initial path in DFS. This also helps in achieving the transition path coverage.
3.3.5
Transformation of Predicate into source
code
Consider an initial set of data B0. Here, B0 consists of all the
variables that affect a predicate r in the path P of a state chart diagram. As mentioned in our approach, we compute two points named ON and OFF for a given border satisfying the boundary-testing criterion. We transform the relational expressions of the predicates to a function F called predicate function. If the predicate r is of the form (Exp1 op Exp2), where Exp1 and Exp2 are arithmetic expressions and op is a relational operator; then F = (Exp1- Exp2) or (Exp2- Exp1) depending on whichever is positive for the data B0. Next, we
successively modify the input data B0 such that the function F
decreases and finally turns negative. When F turns negative, it corresponds to the alternation of the outcome of the predicate. Hence, as a result of the predicate transformation, the point at which the outcome of a predicate r changes, corresponds to the problem of minimization of the function F, which is achieved through repeated modification of the input data values. We have transformed these predicate into source code [4].
3.3.6
Test case generator
The test case generator produces new test cases that would cover the target branches/conditions in the code from the structure file and determines what conditions/branches should be targeted for new test case generation.
3.3.7
Test case analyzer
Test case analyzer evaluates by running each test case in the program and maintains a track of condition and branch coverage. If the test case satisfies the coverage criteria it generates a report otherwise the analysis result is used by test case generator for further test case generation.
3.3.8
Test Case Result
The report generator prints the result which includes the generated test cases, condition and branch coverage and percentage of path coverage.
3.3.9
Construction of EFSM from the source code
In this step, the Extended Finite State Machine ( EFSM) is constructed from the source code automatically. EFSM, is very popular for modelling state-based systems like computer communications, telecommunications, and industrial control systems. An EFSM consists of states(including an initial state and an exit state) and transitions between states. A transition is triggered when an event occurs and a condition associated with the transition is satisfied. When a transition is triggered, an action(s) may be performed. The action may manipulate variables, read input or produce output.
3.3.10
Matching Result & Storage of test cases
For finding the minimum of a predicate function F, the basic search procedure we use is the alternating variable method ,. This method is based on minimizing F with respect to each input variable in turn. An initial set of inputs can be randomly
generated by initializing the data variables. Two data values
Bin (inside boundary) and Bout (outside boundary) are
generated using the search procedure mentioned. These two points are on different sides of the boundary. For finding these two data points, a series of moves is made in the same direction determined by the search procedure mentioned above and the value of F is computed after each move. The size of the step is doubled after each successful move. This makes the search for the test data quick. A successful move is one where the value computed by the predicate function F is reduced. When the minimization function becomes negative (or zero), the required data values Bin and Bout are noted.
These points are refined further to generate a data value, which corresponds to a minimum value of the minimization function along the last processed direction. This refinement is done by reducing the size of the step and comparing the value of F with the previous value. Also, the distance between the data points is minimized by reducing the step size. Now, we generate the test data for each conditional predicate in the state chart diagram. Then, the generated test data are stored in a file. Now, we present our ATGSD algorithm to generate test cases, for Bank ATM System, in pseudo code form.
Pseudo code of ATGSD algorithm for Bank ATM System
Input: Sequence Graph, Pin, Your_Balance(Current balace of
customer), Withdraw_Money(customer wants withdraw money), Card_read (Boolean(true, false)),
CustomerWantsAnotherPrint(Boolean (true, false)), Print ()}
Output: TSi(Test Sequence), SC (State Coverage),
TC (Transition Coverage), ACC (Action Coverage), TPC (Transition Pair Coverage), EFSM Graph
Begin
State enum {Idle, Reading_Card, CardReadSuccessfully, Reading_Pin, PinReadSuccessfully, Choosing_Transaction, SendingToBank, HandlingInvalidPin,
Performing_Transaction, WithdrawMoney, LessMoneyExit, PrintingReciept, AskForAnotherPrint, Exit}
If (state=Idle) then
Print (TSi, Current State, Final State)
State← Reading_Card End if
If (state= Reading_Card AND card_read = false) then Print (TSi, Current State, Final State)
Print (“Card Not Readable Please Check”) State ← Exit
End if
If (state= Reading_Card AND card_read = true) then Print (TSi, Current State, Final State)
State ← Choosing_Transaction End if
If (state= Choosing_Transaction AND card_read=true) then Print (TSi, Current State, Final State)
State ← SendingToBank End if
If (state= SendingToBank AND pin !=1234) then Print (TSi, Current State, Final State)
state← HandlingInvalidPin End if
End if
Print(“You are given invalid Pin No.”); State ← Exit
End if
If (state= SendingToBank AND pin =1234) then Print (TSi, Current State, Final State)
State ← Performing_Transaction End if
If (state= HandlingInvalidPin AND pin =1234)) then Print (TSi, Current State, Final State)
State ← Performing_Transaction End if
If (state =Performing_Transaction AND pin =1234 AND card_read=true AND Your_Balance >=withdraw_Money AND withdraw_Money <= max_limit_money) then If((withdraw_Money %100)= null)
Print(“Withdraw Money”)
Print(“After Withdraw Your Balance in Account”) State ← withdraw_Money
Print (TSi, Current State, Final State)
Else
Print(“please give withdraw money multiple of 100”) Print (TSi, Current State, Final State)
state ←Exit End if End if
If (state= Performing_Transaction AND pin =1234 AND card_read=true AND Your_Balance >=withdraw_Money AND withdraw_Money > max_limit_money) then Print("Your maximum limit in one transaction is over"); Print (TSi, Current State, Final State)
state=Exit;
If (state = withdraw_Money AND Print=true) then If(Print = true)
Print (TSi, Current State, Final State)
state←PrintReciept End if
End if
If (state= Performing_Transaction AND pin =1234 AND card_read=true AND Your_Balance < withdraw_Money AND withdraw_Money <= max_limit_money) then Print(“You have insufficient balance for withdraw Money”); Print (TSi, Current State, Final State)
state← Exit
If (state= PrintingReciept AND AskForAnotherPrint =true) then
Print (TSi, Current State, Final State)
Print (“Dispense Return Money”) state← Exit
End if
If (state= PrintingReciept AND AskForAnotherPrint =false) then
Print(“”please take Transaction Reciept) Print (TSi, Current State, Final State)
state← Exit End if End
Working of ATGSD for with Bank ATM System In this Section, we are explaining the working of our ATGSD algorithm using Bank ATM example.
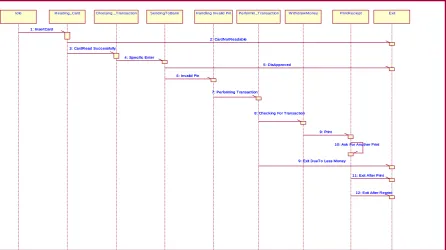
The Bank ATM is a Money dispenser Machine in which we can withdraw Money from machine. The sequence diagram of a Bank ATM object for various events of interest is shown in figure 4.
The objects first enter into idle state, after those objects insert the ATM card. After that machine will enter into
ReadingCard State which read the card and store the information about customer for one transaction. If there is some problems for reading it will enter in Exit State. If machine haven‟t any problem for reading the card then it will enter into next state Transaction State. After that all the information of customer send to bank in SendToBank State
because by the using this state all the personal information about customer will be secure. After that customer insert his Pin and Object will go to Performing Transaction State. If Pin is not match with original Pin then object enters to Exit State due to invalid Pin number. After that if Pin is match to original Pin. Then will machine display Amount Window for Customer in this state customer will have condition for withdrawing money.
1) WihtdrawMoney = 100 × n
Means customer can withdraw money multiple of 100. 2) WithdrawMoney <= 40000
3) WithdrawMoney <=Your_Balance
Exit PrintRec iept
W ithdrawMoney Performin_T ransac tion
Handling Inv alid Pin SendingT oBank
Choosing _T ransac tion Reading_Card
Idle
1: InsertCard 1: InsertCard
2: CardNotReadable 2: CardNotReadable
3: CardRead Succ essfully 3: CardRead Succ essfully
4: Spec ific Enter 4: Spec ific Enter
5: DisApprov ed 5: DisApprov ed
6: Invalid Pin 6: Invalid Pin
7: Performing T ransac tion 7: Performing T ransac tion
8: Chec king For T ransac tion 8: Chec king For T ransac tion
9: Print 9: Print
10: Ask For Another Print 10: Ask For Another Print
9: Exit DueTo Less Money 9: Exit DueTo Less Money
11: Exit After Print 11: Exit After Print
12: Exit After Reprint 12: Exit After Reprint
Fig 4: Sequence Diagram of Bank ATM System
3.4
AN IMPLEMENTATION OF OUR
APPROACH
In this section we discuss the results obtained by implementing the proposed approach. The complete approach is implemented using JAVA and Net Beans IDE version 7.0.1. Implementation is done by taking Bank ATM System as the case study. We have implemented our method for generating test cases automatically from UML Sequence diagram in a prototype tool, named ModelJUnit. We used Rational Rose to produce the UML design artefact. The architecture of the ModelJunit is shown in Figure 6.ModelJUnit is an open source Library, released under the GNU GPL license [13]. ModelJUnit allows us to write simple Sequence diagram as Java classes, then generate tests from those models and measure various model coverage metrics as well as Extended finite state machine (EFSM). Model-based testing allows us to automatically generate test suites from a model of a system under test. ModelJUnit is a Java library that extends JUnit to support model-based testing. ModelJUnit allows us to create simple FSM or EFSM models as Java classes, then generate tests from those models and measure various model coverage metrics. Here, the models are extended finite statecharts that are written in a familiar and expressive language: JAVA [1].
Fig 5. Architecture of ModelJunit
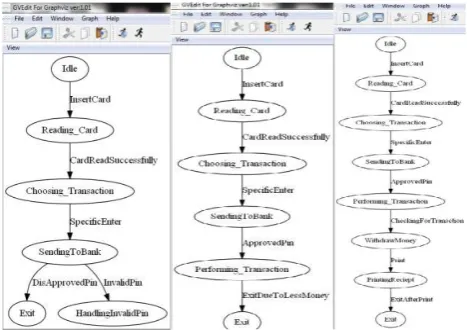
Fig 6: Sequence Graph for Bank ATM Sequence Diagram
The Starting Node and destination Node as well as the prefix path conditions are displayed along with the test data. In our prototype implementation, we have restricted the conditional expressions in sequence diagrams to have only integer and Boolean variables as these occur commonly. But, other numeric data types can easily be considered. Further, for the prototype.
Fig 8 : Screenshot of generated EFSM from source code
implementation we have assumed that the necessary constraints are available in notes. The GUI provides a friendly and efficient user interface to user to generate testing code and connect user defined model with ModelJUnit.
Fig 9: Screenshot of generated test data with test coverage
The GUI gives the flexibility to view the sequence diagram. Figure 6 shows the UTG display of the JAVA source file of example mentioned. Figure 8 shows the generated EFSM from the source code. And the set of test cases generated corresponding to our ATGSD algorithm with the test coverage achieved are shown in Figure 8 . In Figure 7, the initial node, the last node and the test data corresponding to each predicate are also shown. The transition path that is considered while generating the test data in each case is also displayed along with the test data as shown in Figure 9. The percentage of test coverage which are achieved by implementing the case study of Bank ATM object is shown in the Table I.
TABLE I
Table 5.1: TABLE Showing Test Coverage Achieved (NO: No. of Object, NMP: No. of Message Path Coverage, OC:
% of Object Coverage, MPC: % of Message Path Coverage, MPC1: % of Message Pair Coverage, AC: % of
Action Coverage)
3.5
RELATED WORK
Lorenzoli et al. [17] model a system based on a captured trace including method invocations, parameter values, and global state. Similar to our approach, they use Finite State Machines (FSM) and Daikon-invariants to create the EFSM. These EFSM are used for test case selection and test suite optimization with the goal of increasing the coverage of the model. The approach presented in this paper uses similar means to generate the EFSM, but with different algorithms more suitable for MBT, and we also generate model source code from these models, whereas Lorenzoli et al. generate no tests nor code.
A method is introduced by Kansomkeat and Rivepiboon [18] for generating test sequences using UML state chart diagrams. They transformed the state chart diagram into a flattened structure of states called testing flow graph (TFG). From the TFG, they listed the possible event sequences which they considered as test sequences. The testing criterion they used to guide the generation of test sequences is the coverage of the states and transitions of TFG
Also Abdurazik and Offutt [8] proposed test criteria based on collaboration diagrams for static checking and dynamic testing. They adapted traditional data flow coverage criteria in the context of UML collaboration diagrams. It does not generate several test data that achieve transition path coverage, but our approach tests the border determined by a simple predicate, which reduces the number of test cases significantly. Also, our approach achieves transition path coverage. Again our work achieves full predicate coverage as we generate test data for each conditional clause. Again a method is introduced by Korel [20] by using function minimization method in the context of unit testing of procedural programs. He generated test data based on actual execution of the program under test using the function minimization method and dynamic data flow analysis. Test data are developed for the program using actual values of input variables. If during a program execution an undesirable execution flow is observed (e.g. the „actual‟ path does not correspond to the selected control path), then the function minimisation search algorithm is used to automatically locate the values of input variables for which the selected path is traversed. In addition, dynamic data flow analysis is used to determine those input variables responsible for undesirable program behaviour, leading to significant speedup of the search process.
been presented as a solution to avoid the state space explosion when selecting test cases from formal models. Although such techniques work very well with regard to the speed of the test derivation, they leave the tester with one important task that influences the quality of the overall testing process. Then, they showed how existing tools can be used to efficiently derive test cases and suggest how to use the
coverage information to minimize test suites while generating them. It would be straightforward to define further coverage criteria based on logical expressions, such as, multiple condition coverage, or other modified condition/decision coverage variants.
3.6
CONCLUSION AND FUTURE
WORK
We have defined a methodology to generate test cases from UML sequence diagrams. First, we have constructed the sequence diagram for a given Case Study. Then the sequence diagram is traversed, conditional predicates are selected and these conditional predicates are transformed to source code. Then, the test cases are generated and stored by using function minimization technique.
From the sequence diagram, we perform a DFS to select the associated predicates. After selecting the predicates, we guess an initial dataset. We have generated test predicate conditions from UML sequence diagram, which are used to generate test cases.
Our technique achieves many important coverage like object coverage, message path coverage, message path pair coverage, action coverage. It also achieves full predicate coverage as we generate test data for each conditional clause. It can handle transitions with guards and achieves transition path coverage. Here the number of test cases is minimized and they achieve transition path coverage by testing the boundaries determined by simple predicates. Moreover, our planning to include other diagrams of UML to generate test cases. In future, we will look into how the test cases can be optimized and how other UML diagrams can be combined and used to generate test cases and achieve higher coverage.
4. REFERENCES
[1] Priestley, Mark. 2005. Practical Object-Oriented Design with UML. Tata McGraw-Hill, 2nd edition, 2005.
[2] Samuel, P., Mall, R., and Bothra, A. K. 2008. Automatic test case generation using Unified Modeling Language(UML) state diagrams. IET Software, 2(2),
2008, pp.79 – 93.
[3] Sharma, M. and Mall, R. 2009. Automatic generation of test specifications for coverage of system state transitions. Information and Software Technology, (51), 2009, pp.418 – 432.
[4] Ranjita Swain, Vikas Panthi, Prafulla Kumar Behera, Durga Prasad Mahapatra 2012. Test Case Generation Based on State Machine Diagram. International Journal of Computer Information Systems, Vol.4, No 2, 2012 pp. 99- 124 .
[5] Offutt, J., Liu, S., A. Abdurazik and P. Ammann. 2003.Generating test data from state-based
specifications. software testing, verification and reliability Softw. Test. Verif. Reliab. 2003; pp.25–53.
[6] Blanco, R., Fanjul, J. G. and Tuya, J. 2010. Test case generation for transition-pair coverage using Scatter Search. International Journal of Software Engineering and Its Applications Vol. 4, No. 4, October 2010.
[7] OMG. Unified Modelling Language Specification, version 2.0, Object Management Group, www.omg.org, August 2005.
[8] Abdurazik, A. and Offutt, J. 2000. Using UML collaboration diagrams for static checking and test generation, Proceedings of 3rd Int. Conf. UML, Lecture
Notes in Computer Science, 2000, pp.383 – 395.
[9] F. Fraikin and T. Leonhardt. SeDiTeC – Testing Based on Sequence Diagrams. In ASE‟2002.
[10] Michel, R. Blaha and James R. Rumbaugh. 2005. Object-Oriented Modeling and Design with UML. Pearson, 2nd edition, 2005.
[11] http://www.sequencediagrameditor.com/uml/sequence-diagram.htm
[12] Philip Samuel, Rajib Mall, A Novel Test Case Design Technique Using Dynamic Slicing of UML Sequence Diagramse-Informatica Software Engineering Journal, Volume 2, Issue 1, 2008.
[13 ] http://www.cs.waikato.ac.nz/~marku/mbt/modeljunit.
[14] Dennis, Wixom, Roth. System Analysis & Design third edition wiley india.
[15] Offutt, J. and Abdurazik, A. 1999. Generating tests from UML specifications. In Proceedings of 2nd International Conference. UML, Lecture Notes in Computer Science,
1999, pp. 416 – 429.
[16] Koster, K. and Kao, D. C. 2007. State coverage: A structural test adequacy criterion for behavior checking. In ESEC/FSE, 2007.
[17] Davide Lorenzoli, Leonardo Mariani, and Mauro Pezzè. Automatic generation of software behavioral models. In Proc. 30th Int‟l. Conf. on Softw. Eng. (ICSE‟08), pp. 501–510, Leipzig, Germany, May 2008.
[18] Kansomkeat, S. and Rivepiboon, W. 2003. Automated-generating test case using UML statechart diagrams. In
Proc. SAICSIT 2003, ACM, 2003, pp.296 – 300.
[19] Abdurazik, A. and Offutt, J. 2000. Using UML collaboration diagrams for static checking and test generation, Proceedings of 3rd Int. Conf. UML, Lecture Notes in Computer Science, 2000, pp.383 – 395.
[20] Korel, B. 1990. Automated software test data generation.
IEEE Trans. Software Engineering,, 16(8), 1990, pp. 870 – 879.
[21] Weighhofer, M., Fraser, G. and Wotawa, F. 2009. Using coverage to automate and improve test purpose based testing. Information and Software Technology, 51, 2009,
pp .1601-1617
![Fig 2. Sequence diagram and its various notations [12] 3. TEST CASE GENERATION USING SEQUENCE DIAGRAM In This section, we describe our proposed method to](https://thumb-us.123doks.com/thumbv2/123dok_us/1329206.1641152/2.595.59.271.116.282/sequence-diagram-various-notations-generation-sequence-diagram-proposed.webp)