Analysis of Environmental Impact of 4 Stroke Petrol
Engine by Using Eco Indicator 99 Method
Gayatri Kushwah
Assistant Professor in Mechanical Engineering Department, SSSCE, Bhopal
Abstract- This study presents the assessment of environmental impact of four stroke petrol engine. The assessment is done by using the Eco indicator 99 method & Eco it software. The assessment of environmental impact of whole life cycle of engine includes the impact assessment of Production phase, Processing phase, transport and packaging phase, use phase, disposal phase of whole life of engine.
For assessment, data are collected and then analyzed, during analysis the indicator point obtained from eco it software for particular material and process is taken. After the analysis the impact shows as indicator scores in milli-points, which phase have more indicator score have more impact on environment.
Index Terms- Eco indicator 99 method, Indicator point, Eco It software, Four stroke petrol engine.
I. INTRODUCTION
Every product has impact on environment in its whole life, some products have less impact and some product have more impact. This article involves a stepwise analysis of impact on environment of every phase i.e. production, processing/manufacturing, use, transport & packaging, disposal of 4 stroke petrol engine in its whole life by the use of Eco indicator 99 method. For assessment the environmental impact many methods can be use, in which most widely used method is Eco indicator 99 method. “The Eco-indicator 99 is both a science based impact assessment method for LCA and a pragmatic ecodesign method. It offers a way to measure various environmental impacts, and shows a final result in a single score.”This method uses indicator points to evaluate the impact of product on environment. The indicator points for different type of materials and processes can be obtained by the ECO-IT software. This analysis shows the impact in terms of indicator scores in millipoints, of various product life cycle phases, which phase have more points, it have more impact on environment.
Eco-indicator 99 Methodology: Operating instructions The following steps must always be followed to ensure correct application of the Eco-indicator:
Step 1: Establish the purpose of the Eco-indicator calculation.
• Describe the product or product component that is being analyzed.
• Define whether an analysis of one specific product is being carried out or a comparison between Several products.
• Define the level of accuracy required.
Step 2: Define the life cycle.
• Draw up a schematic overview of the product’s life cycle, paying equal attention to production, Use and waste processing.
Step 3: Quantify materials and processes. • Determine a functional unit.
• Quantify all relevant processes from the process tree. • Make assumptions for any missing data.
• Amend conclusions (if appropriate).
• Check whether the purpose of the calculation has been met.
Indicator Point : indicator scores to express the environmental performance of a product as a single figure. The standard Eco-indicator values can be regarded as dimensionless figures. As a name we use the Eco-Eco-indicator point (Pt). In the Eco-Eco-indicator lists usually the unit milli-point (mPt) is used, so 700 mPt= 0.7 Pt.
ECO-it Software is a tool for product and packaging designers. Designers often work under time pressure, and cannot be expected to be environmental experts. With ECO-it you can work without detailed environmental knowledge. ECO-it is easy to use and gives instant results. For this reason, it is also the perfect tool for education.
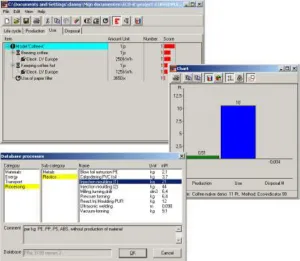
Figure 1 : Indicator points of process in eco-it software
[image:2.612.173.473.196.457.2]II. COLLECTEDDATAANDANALYSISOFIMPACT
Step 1: In this study for Analysis of environmental impact of 4 stroke petrol engine, Bajaj caliber engine is taken.
Step 2 and step 3: The process tree is illustrated in figure 2. In this I determine exactly inputs & outputs during a whole life of product. The amount of material is also included which is found by weighting of every parts of engine in workshop.
[image:3.612.113.499.202.555.2]
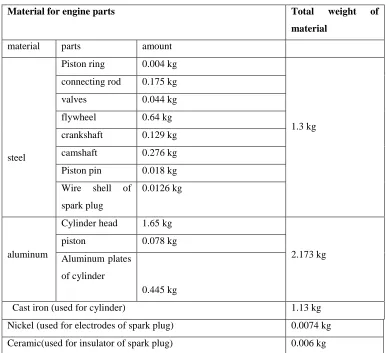
Table I: Material used for manufacturing engine parts
Material for engine parts Total weight of
material
material parts amount
steel
Piston ring 0.004 kg
1.3 kg connecting rod 0.175 kg
valves 0.044 kg
flywheel 0.64 kg
crankshaft 0.129 kg
camshaft 0.276 kg
Piston pin 0.018 kg
Wire shell of
spark plug
0.0126 kg
aluminum
Cylinder head 1.65 kg
2.173 kg
piston 0.078 kg
Aluminum plates
of cylinder
0.445 kg
Cast iron (used for cylinder) 1.13 kg
Nickel (used for electrodes of spark plug) 0.0074 kg
Table II: Process & heat energy used for manufacturing engine parts
[image:4.612.98.515.105.356.2]
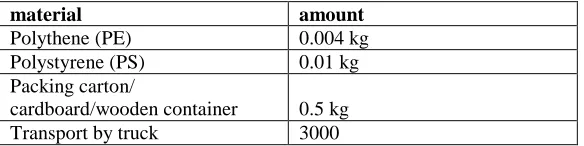
Table III: Material used in packaging & transport of engine
material amount
Polythene (PE) 0.004 kg
Polystyrene (PS) 0.01 kg
Packing carton/
cardboard/wooden container 0.5 kg
Transport by truck 3000
Table IV: product life cycle = 10 years, use of petrol = 2 litre/day , hence use of petrol = 720 Litre/year
Use engine oil = 1 Litre/servicing (in every 3 months)
Parts process Heat energy
used
Piston ring forging 0.26 MJ
Connecting rod Forming, sintering, infiltrating, separating 11.375 MJ
valves forging 2.86 MJ
flywheel casting 41.6 MJ
Crankshaft Roll forging 8.385 MJ
Camshaft Sintering, heating 17.94 MJ
Piston pin forging 1.17 MJ
Wire shell of spark plug extrusion 0.819 MJ
Cylinder head forging 381.15 MJ
piston Forging/casting ,machining, turning, drilling 18.018 MJ
Aluminum plates of cylinder Sheet forming, bending 102.795 MJ
Cylinder Casting 41.81 MJ
Petrol (litre) 7200 2*30*12*10
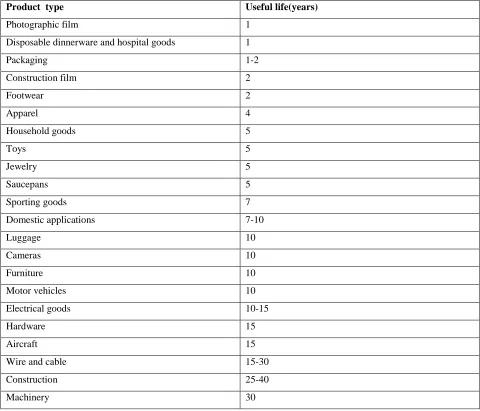
[image:4.612.157.449.425.498.2]Table V: Common product life cycles
Product type Useful life(years)
Photographic film 1
Disposable dinnerware and hospital goods 1
Packaging 1-2
Construction film 2
Footwear 2
Apparel 4
Household goods 5
Toys 5
Jewelry 5
Saucepans 5
Sporting goods 7
Domestic applications 7-10
Luggage 10
Cameras 10
Furniture 10
Motor vehicles 10
Electrical goods 10-15
Hardware 15
Aircraft 15
Wire and cable 15-30
Construction 25-40
After finding the life cycle & quantity (amount) of material, this quantity is multiplied by indicator point (find out from ECO IT software) for every material/process used in every phase and filled in the form (available in tabular format ) to determine environmental impact of engine.
LIFE CYCLE OF 4 STROKE PETROL ENGINE – The process tree is illustrated in fig. In this we determine exactly inputs & outputs during a whole life of product. The amount of material is also included
.
Figure 2: Process tree for engine
cylinder Alum- inum 1.65 kg Cast iron 1.13 kg Steel 0.276 kg Sintering , heating Casting Steel 0.004 kg Roll forging Steel 0.129 kg Steel 0.018 kg For-ging Steel 0.044 kg Cast-ing Steel 0.64 kg For-ging For-ging For-ging Forging /casting, m/cing, turning, drilling Alum- inum 0.078 kg Heat energy 0.26 MJ Heat energy 41.81 MJ Heat energy 18.018 MJ Heat energy 381.15 MJ Heat energy 1.17 MJ Heat energy 17.94 MJ Heat energy 8.385 MJ Heat energy 41.6 MJ Heat energy 2.86 MJ
Nickel (used for electrodes of
spark plug) 0.0074 kg Ceramic (used for insulator of
spark plug) 0.006 kg Wire shell of spark plug 0.0126 kg
Transport by truck Polythene (PE) 0.004 kg Transport & Packaging Assembly Packing carton/wooden container/cardboard 0.5 kg Polystyrene (PS) 0.01 kg Forming, sintering, infiltrating, separating Heat energy 11.375 MJ Steel 0.175 kg Camshaft Spark plug Piston pin Connecting rod Petrol
7200 litre Use
Product or component 4 stroke petrol engine
Notes about analysis
Assumption: Product life of 10 years, uses petrol 2 litre/day & its mileage is 83 km/l Production
Material used in production of product
Material for engine parts Total weight of
material (Q)
Indicator (I) Result (Q*I)
Material parts amount
Steel
Piston ring 0.004 kg
1.3 kg 86 111.8
connecting rod 0.175 kg
valves 0.044 kg
flywheel 0.64 kg
crankshaft 0.129 kg
camshaft 0.276 kg
Piston pin 0.018 kg
Wire shell of spark plug 0.0126 kg
Aluminum
Cylinder head 1.65 kg
2.173 kg 780 1694.94
piston 0.078 kg
plates of cylinder 0.445 kg
Cast iron (used for cylinder) 1.13 kg 240 271.2
Nickel (used for electrodes of spark plug) 0.0074 kg 5200 38.48
Ceramic(used for insulator of spark plug) 0.006 kg 28 0.168
Total impact of production phase (in mpt) A = sum of all results in this phase = 2116.588
Processing
Heat energy used in production
Parts Process Heat energy
used
Total heat energy (E)
Indicator (I)
Result (E*I)
Piston ring forging 0.26 MJ
628.182 MJ 4.2 2638.36
Connecting rod Forming, sintering, infiltrating,
separating
11.375 MJ
valves forging 2.86 MJ
flywheel casting 41.6 MJ
Crankshaft Roll forging 8.385 MJ
Camshaft Sintering, heating 17.94 MJ
Piston pin forging 1.17 MJ
Wire shell of spark plug extrusion 0.819 MJ
Cylinder head forging 381.15 MJ
piston Forging/casting, machining,
turning, drilling
18.018 MJ
Aluminum plates of cylinder Sheet forming, bending 102.795 MJ
Cylinder Casting 41.81 MJ
III. RESULT SUMMARY Transport & packaging
material used in transport & packaging
Material Amount (T) Indicator (I) Result (T*I)
Polythene (PE) 0.004 kg 2.1 0.0084
Polystyrene (PS) 0.01 kg 370 3.7
Packing carton/
cardboard/wooden container 0.5 kg 69 34.5
Transport by truck 3000 22 66
Total impact of Transport & packaging phase (in mpt) C = sum of all results in this phase = 104.208
Use
Material, Transport, Energy and possible auxiliary materials
Material Amount (U) Indicator (I) Result (U*I)
Petrol (litre) 7200 210 1512000
Engine oil (litre) 40 99 3960
Total impact of use phase (in mpt) D = sum of all results in this phase = 15,15,960
Disposal
Disposal process for used material
Material Amount (D) Indicator (I) Result (D*I)
Municipal waste PE 0.004 kg -1.1 -0.0044
Municipal waste PS 0.01 kg 2 0.02
Municipal waste aluminum 2.2 kg -23 -50.6
Municipal waste steel 1.48 kg -5.9 -8.732
Packing carton/cardboard 0.5 kg -3.3 -1.65
Total impact of disposal phase (in mpt) E = sum of all results in this phase = -60.95
Grand total [millipoint] all phases (A+B+C+D+E) 15,20,758.206
Life cycle phases Score in milli points % of total damage
Production phase 2116.588 0.14 %
Processing phase 2638.36 0.17 %
Transport & packaging 104.208 0.0069 %
Use phase
[Use of petrol]
[Use of engine oil]
15,15,960
1512000
3960
99.8 %
[99.6 %]
[0.20 %]
The result shows that the use phase has greatest impact. The number of points is many times higher than the totals for the production, processing, transport, & packaging & disposal.
Use phase have greater damage % than other ,that is 99.8 % including use of petrol 99.6 %, use of engine oil 0.20 %. Hence petrol have greatest impact on environment than others, the design team should concentrate on the use of petrol. Instead of petrol alcohol or mixture of both can be used.
Use of alcohol Use of petrol
Amount Indicator Result Amount Indicator Result
10% = 720 Litre 99 71280 90%=6480 Litre 210 1360800
20%=1440 Litre 99 142560 80%=5760 Litre 210 1209600
30%=2160 Litre 99 213840 70%=5040 Litre 210 1058400
Hence,
Amount of alcohol +
petrol
Score in mpt Total impact % of total damage Result
10 % alcohol + 90 %
petrol
71280 + 1360800 1432080 94.2% Impact 5.8%
reduces by
20% alcohol + 80 %
petrol
142560 + 1209600 1352160 88.9% Impact 11.1%
reduces by
30 % alcohol + 70 %
petrol
213840 + 1058400 1272240 83.7% Impact 16.3%
reduces by
Then, order of impact –
Petrol > 10 % alcohol + 90 % petrol > 20 % alcohol + 80 % petrol > 30 % alcohol + 70 % petrol
IV. CONCLUSION
Every product damages the environment to some extent. Raw materials have to be extracted, the product has to be manufactured, distributed and packaged. Ultimately it must be disposed of. Furthermore, environmental impacts often occur during the use of products because the product consumes energy or material. If we wish to assess a product’s environmental damage, all it's life cycle phases must therefore be studied. The result of this study shows that the petrol has greatest impact on environment than others, the design team should concentrate on the less use of petrol. Instead of petrol alcohol or mixture of both can be used, when amounts of alcohol increases, the environmental impact reduces.
REFERENCES
[1] Goedkoop, Mark, Suzanne Effting and Marcel Collingnon [2000] The Eco indicator 99 A damage oriented method for Life cycle Impact Assessment, Manual for designers, pp 1-13, 15-19
[2] Goedkoop, Mark, renilde spriensma [2001] The Eco indicator 99 A damage oriented method for Life cycle Impact Assessment, Methodology annex, pp 3-5, 12-14 [3] Goedkoop, Mark, renilde spriensma [2001] The Eco indicator 99 A damage oriented method for Life cycle Impact Assessment, Methodology report, pp 7-11 [4] Google answers: Energy required manufacturing typical vehicle, pp 1-6
[5] Symposium SETAC-Europe [2000] A simplified LCA of automotive sector LCA, pp 1-5 [6] Benedetti US patent [1984], Process of manufacturing a flywheel, patent no. 4,433,473, pp 1-4 [7] Slee US patent [1986], manufacturing of camshaft, patent no. 4,616,389, pp 1-4
[8] Udagawa et al. US patent [1983], method of manufacturing a cylinder head, patent no. 5,272,808, pp 1-4 [9] Fujiki et al. US patent [1997], method of manufacturing connecting rod, patent no. 5,666,637, pp 1-4 [10] Deppert et al. US patent [1999], process of manufacturing a piston ring, patent no. 6,003,227, pp 1-4 [11] Yoshino, US patent [2000] method of manufacturing a crankshaft, patent no. 6,020,025, pp 1-4 [12] Hori, US patent [2004] manufacturing method for a spark plug, patent no. 6,799,367B2, pp 1-4
[13] Hofstetter, P. [1998] perspectives in life cycle impact assessment; A structured approach to combine models of the techno sphere, Ecosphere and value sphere. [14] Chitale A. K. Chitale and R.C. Gupta, Product design & Manufacturing, PHI Learning Pvt. Ltd., 2007
AUTHOR
Gayatri Kushwah, Assistant Professor, Mechanical Engineering department, [email protected].