Abstract—Robust clustering methods reduce the impact of outliers on cluster centroids. Definition of outlier depends on the data structure and applied detection methods. Noise Clustering (NC) is a robust technique, which defines outlier in terms of a distance, called noise distance. NC identifies outliers during clustering process and modifies various parameters, required for creating clusters, thus effecting clustering output. Its main motive is to reduce the influence of outliers on cluster centroids rather than identifying it hence could not result into original clusters. However, in many applications, identification of outliers is important, as they may contain important information. Density Oriented Fuzzy C - Means (DOFCM) is a robust technique, which identifies outlier before clustering, on the basis of density of data-set. According to DOFCM, outliers are defined as the points that are not in the dense part of the data-set. In this paper, we have compared both the techniques for outlier identification and clustering. The results obtained through comparison, by implementing various tests, concluded that DOFCM based upon density approach identifies outliers very well and gives efficient clustering results than NC technique which identify outliers based upon distance.
Index Terms—Data mining, Density-Oriented approach, Fuzzy clustering, Outlier identification, Robust clustering.
I. INTRODUCTION
Data Mining comprises of dependency detection, class identification, class description, and outlier/exception identification, the last focuses on a very small percentage of data points, which are often ignored as noise. Some algorithms in machine learning and data mining have considered outliers, but only to the extent of tolerating those in whatever the algorithms are supposed to do. The exact definition of an outlier often depends on hidden assumptions regarding the data structure and the applied detection method [1]-[5]. Cluster analysis has been a fundamental research area in data analysis and pattern recognition. Clustering helps in finding natural boundaries in the data and fuzzy clustering is used to handle the problem of vague boundaries of clusters. In fuzzy clustering, the requirement of crisp partition of the data is replaced by a weaker requirement of fuzzy partition, where the association among data is represented by fuzzy
Manuscript received January19, 2011; revised March 25, 2011. Prabhjot Kaur is with the Department of Information Technology at Maharaja Surajmal Institute of Technology , C-4, Janakpuri, New Delhi, 110058, India (Phone: +919810665064, +919810165064; E-mail: [email protected]). IEEE member ID- 90526150
Anjana Gosain is with the Department of Information Technology, University School of Information Technology, Guru Gobind Singh Indraprastha University, New Delhi, India (Phone: +919811055716, Email: [email protected]).
I. M. S. Lamba is with the Department of Computer Science, Shardha University, Greater Noida, U. P., India (Phone: +919810326870, Email: [email protected] ).
relations. Outlier identification and clustering are interrelated processes. The fuzzy clustering identifies groups of similar data, whereas the outlier identification extracts noise from the data which does not belong to any cluster. Hawkins [1] defines outlier as an observation that deviates so much from other observations as to arouse suspicion that it was generated by a different mechanism. Barnett & Lewis [2] indicate that an outlying observation or outlier is one that appears to deviate markedly from other members of the sample in which it occurs. Outlier identification is referred to as outlier mining, which has a lot of practical applications in many different areas. Outlier mining actually consists of two sub-problems: first, what data is deemed to be exceptional in a given data-set and second, find an efficient algorithm to obtain such data [4]. In Noise clustering (NC) [12],[13], Dave gave a concept of noise cluster. Data points whose distances to all cluster centroids exceed a certain threshold are considered as noise and they belong to noise cluster, and the distance is called noise distance. Calculation of noise distance is crucial point in NC. Moreover, it identifies outliers during the clustering process. Proposed technique identifies outliers before creating clusters, on the basis of density of data-set. After comparing both the techniques, it is proposed that DOFCM, a density-oriented approach to identify outlier is better than NC which is a distance-oriented technique.
The organization of the paper is as follows: Section II, briefly review Fuzzy C-Means (FCM) [6] and Noise Clustering (NC) algorithms. The properties of robust clustering techniques are defined in Section III. Section IV described the proposed algorithm, DOFCM. Both the techniques are compared and the results are shown in Section V, followed by concluding remarks in Section VI.
II. FUZZY CLUSTERING TECHNIQUES
This section briefly discusses the Fuzzy C-Means (FCM) and Noise Clustering (NC). In this paper, the data-set is denoted by „X‟, where X={x1, x2, x3, …… xn} specifying „n‟
points in M-dimensional space. Centroids of clusters „k‟ are denoted by vk, dik is the distance between xi and vk, and „c‟ is
the number of clusters present in the data-set. A. The Fuzzy C-Means Algorithm
FCM [6] is the most popular fuzzy clustering algorithm. It assumes that number of clusters „c‟ is known in priori and minimizes the objective function (JFCM) as:
ck n
i ki m ki V
U
FCM
u
d
J
1 1
2
,
,
(1)where
d
ki
x
k
v
i , and uki is the membership of xi incluster „k‟, which satisfies the following relationship:
DOFCM: A Robust Clustering Technique
Based upon Density
n i c k 1 1 n i u c k
ki 1; 1,2,...
1
(2)Here m>1 is known as the fuzzifier (or fuzziness index) and any norm can be used for calculating dki (we used
Euclidean norm.). Minimization of JFCM is performed by a
fixed point iteration scheme known as the alternating optimization technique. The conditions for local extreme for “(1)” and “(2)” are derived using Lanrangian multipliers:
c j ki ji ki m ud
d
1 1 2 1 k, I (3) where and
n i m ki n i i m ki k u x u v 1 1i (4) Outliers are the points in the data-set ‟X‟ which are so distant from the rest of the points that it would be unreasonable to assign high membership values to the outliers in any of the „c‟ clusters. FCM assigns memberships to „xi‟ in the „c‟ clusters inversely proportional to the relative
distance of „xi‟ to the {vk} centroid. Let c=2, if „xi‟ is
equidistant from two centroids, the membership of „xi‟ to
these clusters will have the same value (0.5), irrespective of the absolute value of the distance of this point from other points in each of the clusters. Hence the problem with FCM is that it gives equal membership to the noisy points /outliers far from the central structure of the two clusters. It is unable to detect outliers and its centroid attraction is somewhat towards outliers rather than at the center of the cluster.
B.Noise Clustering (NC)
Noise clustering has been introduced by Dave [13], [14] to overcome the major deficiency of the FCM algorithm i.e. its noise sensitivity. He gave the concept of “noise prototype”, which is a universal entity such that it is always at the same distance from every point in the data-set. Let „vk‟ be the noise
prototype and „xi‟ be any point in the data-set such that vk, xiЄ
Rp. Then noise prototype is the distance dkigiven by:
dki ,i
The NC algorithm considers noise as a separate class. The membership u*i of xi in a noise cluster is defined as:
NC reformulates FCM objective function:
1 1 1 2 ) , ( c k N i ki m ki d u V U J (5) where „c+1‟ consists of „c‟ good clusters and one noise cluster and for k = n = c+1. Where(6) and membership equation is
Noise clustering is a better approach than FCM, PCM, and PFCM. Although, it identifies outliers in separate clusters but could not result into efficient cluster shapes because it fails to identify those outliers which are located in between the centroids (refer Section V). Its main emphasis is to reduce the influence of outliers on the clusters rather than exactly identifying it. Real-life data-sets usually contain cluster structures that differ from our assumption of hyper-spherical clusters. The cluster structures must be approximated by several centroids. If the number of clusters is increased for the same data-set, NC does not detect outliers, because in that scenario the average distance between points and regular clusters decreases and the noise distance remains almost constant [11]. NC assigns only those points to noise cluster whose distance from regular clusters is more than the noise distance.
III. PROPERTIES OF NOISELESS CLUSTERING TECHNIQUE
Property P1: RCT must assign lower memberships to all the outliers for all the clusters [15].
Property P2: Centroids generated by RCT on a noisy data-set should not deviate significantly from those generated for the corresponding noiseless set, obtained by removing the outliers [15].
Property P3: RCT must be independent of any number of clusters i.e. able to identify outliers by changing the number of clusters for the same data-set [11].
Property P4: RCT should be independent of any amount of outliers i.e. Centroids generated by Clustering Technique should not deviate by increasing the number of outliers (refer section V).
Property P5:RCT should be independent of the location of outliers in the data-sets i.e. it should be able to find out outliers whether they are within the data-set or away from it (refer Section V).
IV. THE PROPOSED TECHNIQUE,DOFCM
We attempt to decrease the noise sensitivity in fuzzy clustering by identifying outliers before the clustering process. Like NC technique DOFCM results in „n+1‟ clusters with „n‟ good clusters and one invalid cluster of outliers. Proposed algorithm identifies outliers on the basis of density of data-set. It has used FCM technique (by modifying membership) to create clusters. It identifies outliers on the basis of the number of other points in its neighborhood. DOFCM defines density factor, called neighborhood membership, which measures density of an object in relation to its neighborhood. As per the technique, the neighborhood of a given radius of each point in a data-set has to contain at least a minimum number of other points to become a good point(non-outlier). Shape of the neighborhood is determined by the choice of a distance function for two points x1and x2,
denoted by dist(x1,x2) e.g. when using Manhattan distance in
using Euclidean distance it is spherical . The proposed scheme uses Euclidean distance.
Neighborhood membership of a point „i’ in the data-set „X‟ is defined as:
max
iod neighborho i
od neighborho
X
M
(7)where
neighborhoi od = Number of points in the neighborhood of point imax
= Maximum number of points in the neighborhood of any point in the data-setLet „q’ is in the neighborhood of point „i’, so „q‟ will satisfy:
q
X
|
dist
i
,
q
r
neighborhood
(8)where rneighborhood is the radius of neighborhood. dist (i,q) is
the distance between point „i‟ and „q‟. rneighborhood is calculated as [10].
Neighborhood membership of each point in the data-set „X‟ is calculated as per “(7)” and from the complete range of neighborhood membership values, depending on the density of data-set the threshold value „α‟ is selected by the user. The point will be considered as an outlier if its neighborhood membership is less than „α‟. So, as per the analysis, Outlier could now be defined as a point in the data-set ‘X’ whose neighborhood membership is less than the threshold value ‘α’. Let ‘i’ be a point in the data-set ‘X’, then if:
outlier non
outlier Mi
od neighborho
; ;
(9) „α‟ can be selected from the range of
M
neighborhood values after observing the density of data-set and should be close to zero.Selection of the Threshold value ‘α’:
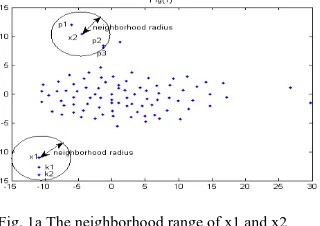
Ideally, a point will be outlier only if no other point is present in its neighborhood i.e. when neighborhood membership is zero or threshold value „α‟ = 0 However, in the proposed scheme, a point is considered as an outlier when its neighborhood membership is less than „α‟, where „α‟ is a critical input parameter to identify outlier. Its value will vary for different data-sets on the basis of their densities. This concept can be best realized through example. Let x1and x2
are two points in the data-set as shown in Fig.1.
Fig. 1a The neighborhood range of x1 and x2
x1has two points in its neighborhood (k1 and k2) and x2has
three points (p1, p2, and p3). As x1 and x2 are far from the other
dense part of the data-set, therefore, it is obvious that these points should be outliers. But, if we consider the ideal situation i.e. a point will only be considered as an outlier if no other point is present in its neighborhood, then these are not
outliers, which are not expected in real life situations. To tackle this problem, in the proposed algorithm, a threshold variable „α‟ is used which is selected according to the maximum number of other points in the neighborhood of any point in the data-set „X‟ i.e. according to the density of the data-set.
„o‟: outliers, „*‟: centroid , and the clusters are separated with the symbols ‟.‟ & „+‟
Fig. 2a Effect on data-set due to variations in Threshold value „α‟
„o‟: outliers, „*‟: centroid , and the clusters are separated with the symbols ‟.‟ & „+‟
Fig. 2b Effect on data-set due to variations in Threshold value „α‟
With the proposed condition, x1and x2will be outliers if the
number of points in their neighborhood is less than four. So user can select the threshold value accordingly. Let us observe it with synthetic data-sets, D45 (Data-set with 45
points) - as given in [12] and D300 (data-set with 300 points).
Fig (2a) and (2b) show identification of outliers by changing the threshold value „α‟ with data-set D45 and D300 respectively.
It is observed from Fig. 2a, Fig. 2b, and TABLE-I that large value of „α‟ leads to more compact clusters with more number of outliers. As „α‟ -> 0, DOFCM behaves as FCM. Proper selection of „α‟ would provide better results.
TABLE-I EFFECT OF CHANGING THRESHOLD VALUE
Data set
max* Threshold value „α‟ No. of
outliers
D45 15 0.0 6
0.09 9
0.14 10
0.21 12
D300 16 0.0 12
0.0625 12
0.125 29
0.1875 42
* Where max is the maximum number of points in the neighborhood of any point in the data-set.
Once the outliers are identified by the algorithm, clustering follows:
Let X = {x1, x2, x3,……..xn) be the data-set after
11 1
2
,
ck n
i
ki m ki
DOFCM
U
V
u
d
J
(10) where
d
ki
x
i
v
k and membership function uki is:
(11) And
m = Fuzziness Index
It is seen from above equations that the fuzzy membership depends on local membership (Mneighborhood) and threshold
value (α). If a point is identified as an outlier, DOFCM assigns zero fuzzy membership to it so that it could not affect the location of centroids which is a limitation with the FCM algorithm. Updating of centroid is the same as than in FCM. The constraint on fuzzy membership is now extended to:
ck ki
u
11
0
;i=1, 2, 3,…….n (12) instead of the following in conventional FCM algorithm.
ck ki
u
11
The FCM algorithm has a constraint that it avoids a situation that the membership value becomes zero. FCM gives meaningful results in applications where memberships are interpreted as probabilities or degree of sharing. The proposed algorithm removes the effect of outliers by assigning them a membership value equal to zero.
V. COMPARISON BETWEEN NOISE CLUSTERING AND DENSITY
ORIENTED FUZZY CMEANS FOR OUTLIER IDENTIFICATION
We compared various aspects of NC and DOFCM with synthetic data-sets. For all data-sets we assumed the following computational protocols: ε = 0.00001, Total number of iterations = 100. MATLAB Version 7.0 is used to produce the results.
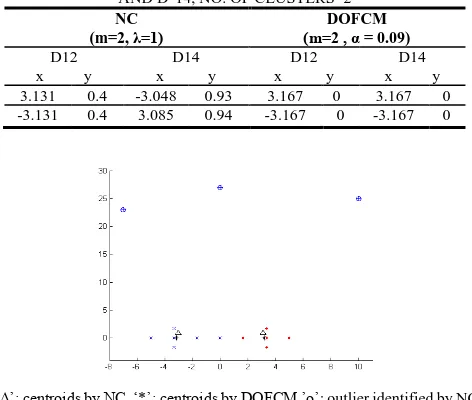
To prove the properties P1, P2, and P4, we are considering three data-sets: D11, DA12, and DB14 (referred from 11). D11 is a noiseless data-set of points . DA12 is the union of D11 and an outlier DA12, and DB14 is the union of D11 and 3 outliers DB12, DB13, and DB14. Fig. 2a, Fig. 2b and TABLE-II show clustering results of NC and DOFCM, identification of outliers by NC and DOFCM with =1 and „α‟ = 0.09, with the data-sets DA
12 and DB14 respectively. „+‟ shows outliers identified by DOFCM and „o‟ shows outliers identified with NC.
True centroids of D11 are: , From the figures and Table-2, it has been seen that both the techniques are able to identify outliers, However, the performance of NC degrades by increasing number of outliers. DOFCM satisfies property P2 and P4, as the centroids generated with DOFCM are same with both data-sets and even more accurate compared to NC. TABLE-III shows memberships generated with DOFCM and NC for the outliers. It is clear from table
that memberships generated with DOFCM are lower than the NC; hence DOFCM also satisfies property P1.
„‟: centroids by NC, „*‟: centroids by DOFCM „o‟: outlier identified by NC, „+‟: outlier identified by DOFCM
Clusters are separated from each other using symbols „.‟ and „x‟ Fig. 2a Clustering Results and Outlier identification with NC and DOFCM
TABLE-II: CENTROIDS PRODUCED BY NC AND DOFCM FOR DA12 AND DB14, NO. OF CLUSTERS=2
NC (m=2, λ=1)
DOFCM (m=2 , α = 0.09)
D12 x y
D14 x y
D12 x y
D14 x y 3.131 0.4 -3.048 0.93 3.167 0 3.167 0 -3.131 0.4 3.085 0.94 -3.167 0 -3.167 0
„‟: centroids by NC, „*‟: centroids by DOFCM ‟o‟: outlier identified by NC, „+‟: outlier identified by DOFCM
Clusters are separated from each other using symbols „.‟ and „x‟
Fig. 2b Clustering Results and Outlier identification with NC and DOFCM
Real life data-sets usually contain data structures that differ from our assumed clusters. So a Robust clustering technique must tolerate different number of clusters for the same data-set. In NC, noise distance is given as:
process and does not involve any parameter that could affect clustering in any manner. Fig. 3a shows the results of NC and DOFCM with the data-set containing two clusters with some noise (refer to APPENDIX-A). NC partitioned the data-set into two clusters with =0.51. The centroids of the clusters are plotted in the figure with „‟ symbol and the outliers are plotted with „o‟. DOFCM partitioned it into two clusters with
=0.14. Centroids are plotted with the symbol „*‟ and outliers with „+‟. If we compare the results of these two techniques, it is visually verified that density-oriented technique can identify outliers more efficiently than distance-oriented.
„‟: centroids by NC, „*‟: centroids by DOFCM „o‟: outlier identified by NC, „+‟: outlier identified by DOFCM
Clusters are separated from each other using symbols „.‟ and „x‟
Fig. 3a Clustering Results and Outlier identification with NC and DOFCM with 2 clusters
Fig.3b shows the result, when we have increased the number of clusters from two to four on the same data-set. From the results, it has been notified that NC is not able to identify outliers, because the noise distance is approximately the same as in the case of two clusters, and also it is verified by visual assessment that the distance from the centroids to the representing data points is significantly smaller than partitioning with only two centroids [11]. But, DOFCM has identified same number of outliers, as it has identified with two clusters. It infers that it is independent from the number of clusters, which satisfies property P3.
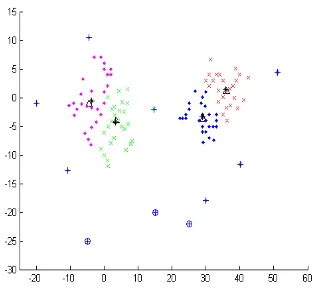
Fig.4 shows the data-set with 331 points, having dense regions, and is partitioned into 3 clusters using both the techniques. NC plots centroids with the symbol „‟ taking
=1.7 and DOFCM displays centroids with the symbol „*‟ taking =0.0625. From the figure, we observed that NC could not identify outliers completely whereas DOFCM has completely identified outliers with = 0.0625. Consider a labeled point „A‟ as shown in Fig. 4. As per NC approach, this point cannot be considered as an outlier as its membership degree to the noise cluster cannot be more than the distance from its regular clusters because the location of this point is in between the cluster centroids and this scenario can never be justified with NC approach. But as the local membership of this point is less than „‟ so DOFCM has detected it as an outlier. It is also visually verified that DOFCM has detected correct cluster shapes. Hence, it also satisfied property P5.
Outliers contain important information in many applications and their identification is crucial. The main emphasis of NC is to reduce the influence of outliers on the clusters rather than identifying it, whereas, from the results, it is clear that DOFCM satisfies all the properties required for a robust technique and identifies outliers very well.
„‟: centroids by NC, „*‟: centroids by DOFCM „o‟: outlier identified by NC, „+‟: outlier identified by DOFCM
Clusters are separated from each other using symbols „.‟ and „x‟
Fig. 3b Clustering Results and Outlier identification with NC and DOFCM with 4 clusters
„‟: centroids by NC, „*‟: centroids by DOFCM. „o‟: outlier identified by NC, „+‟: outlier identified by DOFCM
Fig. 4 Clustering Results and Outlier identification with NC and DOFCM with 3 clusters
VI. CONCLUSIONS
TABLE-IIIMEMBERSHIPSGENERATEDBYDOFCMANDNCFORDA12ANDDB14
Sr . N o.
Data-set DA12 Memberships DB14 Memberships
Featur e1
Featur e2
DOFCM (m=2, = 0.09) NC (m=2, =1) DOFCM (m=2, =0.09) NC (m=2, =1)
Neighborhoo d Membership
Cluste r 1
Cluste r
2
Cluster 1
Clust er
2
Neighborho od Membershi
p
Cluste r 1
Cluste r 2
Cluster 1
Cluste r 2
xA 12
0 38 0.0 0.0 0.0 0.21493 0.214
93
- - - - -
xB
12
0 27 - - - - - 0.0 0.0 0.0 0.2223 0.2222
xB
13
-7 23 - - - - - 0.0 0.0 0.0 0.2720 0.2322
xB
14
10 25 - - - - - 0.0 0.0 0.0 0.2035 0.2433
APPENDIX-A
Synthetic data–set with 115 points (2 clusters with noise)
x y x y x y x y
-10.44 -1.33 7.76 -8.1 4.28 1.14 34 4
14.75 -2.09 6.36 -9.1 36.04 -1.82 35 3
6.78 -1.03 8.1 -7.6 31.4 6.71 -1 -9
5.25 -0.87 4 -4 38.79 5.04 0 -10
-3.84 1.09 5 -5 26.78 1.07 1 -11
-6.86 0.6 6 -5.5 29.72 -1.5 2 -8
-6.34 3.25 7 -4.5 33.74 1.28 0 6
-4.47 10.4 35 0 28.51 -0.95 0 5
2.95 -1.7 36 1 41.17 -0.4 1 4
6.74 1.47 37 1.5 42.47 3.5 29 -6
-2.46 -4.25 38 2 36.18 -3.98 29 -5
-10.89 -12.67 39 3 27.98 -4.01 30 -6
1.19 -11.89 40 4 38.29 -0.04 31 -7
-3.68 -1.73 30 3 22.22 -3.63 24 -3
-8.9 -3.05 31 4 32.33 -7.45 25 -2
2.24 -2.04 32 3 51.01 4.35 25 -1
2.91 -7.08 33 4 37.2 -1.33 2 5
29.25 -7.83 2 4 -3.76 -5.25 23 -3.63
39.43 -1.97 -1 -3 -5.76 -6.25 24 -3.63
33.58 -0.72 -2 -2 -4.76 -7.25 -1 7
40.18 -11.67 0 -1 -4 -8.25 -3 7
30 -18 1 0 0 -6.1 29 -3
-20 -1 0 1 1.1 -5.1 31 -3
15 -20 1 2 2.1 -4.1 33 -3
25 -22 29 0 3.1 -3.1 35 -3
-5 -25 30 1 4.5 -2.31 31 -5
-6.7 -1.1 31 2 5.76 -2.4 33 -5
-5.15 -1.5 32 3 32 -5 30 -4
33 -4 -9 -1 -8 -2
REFERENCES
[1] Hawkins D (1980), “Identification of Outliers”, Chapman & HaIl, London.
[2] Barnett V and Lewis T (1994), “Outliers in Statistical Data”, John Wiley & Sons, Chichester.
[3] Ruts I and Rousseeuw P (1996), “Computing Depth Contours of Bivariate Point Clouds”, Comput Stat Data Anal 23: 153-168. [4] J. Han and M. Kamber (2001), “Data Mining Concepts and
Techniques”, San Francisco: Morgan Kaufmann.
[5] Fawcett T. and Provost F (1997), “Adaptive Fraud Detection”, Data Mining and Knowledge Discovery, 1(3), 291-316.
[6] J.C. Bezdek (1981), “Pattern Recognition with Fuzzy Objective Function Algorithm”, Plenum, NY.
[7] R. Krishnapuram and J. Keller (1993), "A Possibilistic Approach to Clustering", IEEE Trans. on Fuzzy Systems, vol .1. No. 2, pp.98-1 10. [8] N. R. Pal, K. Pal, J. Keller, and J. C. Bezdek (2005), "A Possibilistic
Fuzzy c- Means Clustering Algorithm", IEEE Trans. on Fuzzy Systems, vol 13 (4),pp 517-530.
[9] Prabhjot Kaur and Anjana Gosain (2009), “Improving the Performance of Fuzzy Clustering Algorithms through Outlier Identification”, 2009 IEEE Conference of Fuzzy Sets and Systems, Korea, August 20-24, pp. 373-378.
[11] F.Rehm, F. Klawonn, and R. Kruse (2007), “A Novel Approach to Noise Clustering for Outlier Detection”, Applications and Science in Soft Computing, Springer-Verlag 11:489-494.
[12] R.N. Dave (1991), “Characterization and Noise in Clustering”, Pattern Rec. Letters, vol. 12(11), pp 657-664.
[13] R.N. Dave (1993), “Robust Fuzzy Clustering Algorithms,” 2nd IEEE Int. Conf. Fuzzy Systems, San Francisco, CA, Mar. 28-Apr. 1, pp. 1281-1286.
[14] R.N. Dave and R. Krishnapuram (1997), “Robust Clustering Methods: A Unified View”, IEEE Transactions on Fuzzy Systems, May, Vol 5, No. 2.
[15] K.K. Chintalapudi and M. Kam (1998), “A Noise Resistant Fuzzy C-Means Algorithm for Clustering”, IEEE conference on Fuzzy Systems Proceedings, vol. 2, May, pp. 1458-1463.
Prabhjot Kaur received the B. Tech. degree in Computer Science and Engineering from Punjab Technical University, Punjab, India in 1999 and M.Tech degree in Information Technology from Punjabi University, Punjab, India in 2003. She is a Research Fellow at Sharda University, Greater Noida, Uttar Pradesh.
During 2000-2004, she served as Lecturer in the Department of Computer Science, Punjab College of Information Technology, Punjabi University. From 2004-2007, she worked as a Lecturer in the Department of Information Technology, Maharaja Surajmal Institute of Technology, Guru Gobind Singh Indraprastha University, INDIA and since 2007, she is serving at the same place as a Reader. Ms. Kaur is a member of IEEE.
Dr. I.M.S. Lamba did his Graduation from Punjab University and Post Graduation (Mathematics) from Agra University in 1965. He went to USA at UCLA in 1976 on WHO Fellowship in Biomedical Computing. During 1984-86 he completed MS at York University, Canada and also taught under graduate students over there as TA. He completed his Ph.D from the University of Rajasthan in 1993.
Dr. Lamba served, Indian Council of Medical Research, New Delhi for more than 30 years as a Programmer, Systems Analyst & Senior Grade Deputy Director. During 2001-2010 he was Professor & HOD (IT) at Lingayas‟ Institute of Management & Technology (Now Lingayas‟ University) and Career Institute of Technology & Management (Now MRIU University) at Faridabad, Haryana. Since June 2010, Dr. Lamba has been working as a Professor Emeritus at Sharda University (www.sharda.ac.in), Greater Noida, Uttar Pradesh. Dr. Lamba has published 24 papers in national & international Journals. Currently two students from Birla Institute of Technology, Raipur and four from Sharda University, greater Noida are pursuing Ph.D under his guidance.
Anjana Gosain received the B. Tech. degree in Computer Science and Engg. from Murthal Engineering College, Haryana, India in 1993, M.Tech degree in Information Systems from Delhi University, New Delhi, India in 2000, and Ph. D. degree in Computer Science from Guru Gobind Singh Indraprastha University, India in 2007.