Pharmacophore 2016, Vol. 7 (1), 44-62 USA CODEN: PHARM7 ISSN 2229-5402
Pharmacophore
(An International Research Journal)
Available online at http://www.pharmacophorejournal.com/
Original Research Paper
METHOD DEVELOPMENT AND VALIDATION OF OXCARBAZEPINE BY
USING RP-HPLC METHOD
Varshney Neha
* and Thareja D.
Department of Pharmaceutical Technology, Noida Institute of Engineering and Technology,
Plot No.19, Knowledge Park-II, Greater Noida, Uttar Pradesh-201306, India
ABSTRACT
A simple, specific, accurate and isocratic reversed phase HPLC method was developed and validated for
the estimation of oxcarbazepine. Method was achieved with an Inertsil C-18 ODS-3V column, (25cm×4.6
mm, 5µm) with mobile phase (A)- 0.1 % NH4OH in water with glacial acetic acid, (B)- acetonitrile water
at the flow rate of 1.0 ml/min and at column temperature 35◦C was developed. The detection was carried
out using a detector set at a wavelength of 256 nm. The method was validated for accuracy, precision, linearity, specificity, stability of sample and robustness in accordance with ICH guidelines. Thus the above achieved method is suitable for estimation of oxcarbazepine.
Keywords:
Oxcarbazepine, Reversed phase HPLC, Method validation.
INTRODUCTION
Oxcarbazepine (10,
11-dihydro-10-oxo-5H-dibenzazepine-5-carboxamide) is a 10-keto
analogue of carbamazepine. It is an
anticonvulsant and mood stabilizing drug, used primarily in the treatment of epilepsy. It is also used to treat anxiety and mood disorders (Mazza et al., 2007). Oxcarbazepine is structurally a derivative of carbamazepine, adding an extra oxygen atom on the dibenzazepine ring. This difference helps reduce the impact on the liver of metabolizing the drug, and also prevents the serious forms of anaemia occasionally associated with carbamazepine. Aside from this reduction in side effects, it is assumed to have the same mechanism as carbamazepine - sodium channel inhibition, and is generally used to treat the same
conditions (Rosa et al., 2009). The
pharmacological activity of Oxcarbazepine is primarily exerted through the 10-monohydroxy metabolite (MHD) of Oxcarbazepine. The precise mechanism by which Oxcarbazepine and MHD exert their Anti seizure effect is unknown; however in vitro electrophysiological studies
indicate that they produce blockade of voltage-sensitive sodium channels, resulting in the stabilization of hyper excited neural membranes, inhibition of repetitive neuronal firing, and dimunition of propagation of synaptic impulses. These actions are thought to be important in the prevention of seizure spread in the intact brain. In addition, increased potassium conduction and modulation of high-voltage activated calcium channels may contribute to the anticonvulsive effects of the drug. No significant interactions of
Oxcarbazepine or MHD with brain
neurotransmitter or modulator receptor sites have been demonstrated.
(HPLC) is a form of liquid chromatography to separate compounds that are dissolved in solution. It is now one of the most powerful tools in analytical chemistry, with the ability to separate, identify, and quantitate the ions or molecules that are present in sample and it can be dissolved in a liquid. Because of the relatively high pressure necessary to perform HPLC a more elaborate experimental setup is required and the ability to identify and quantitate the compounds that are present in any sample.
Analytical methods are required to evaluate the quality of drug substances, intermediates & drug
product, and to monitor synthesis or
manufacturing process drugs. Different method depending upon the physical, chemical & biological properties of drug need to be developed in order to evaluate their intended quality, performance. Best column, best mobile phase, best detection wavelength, efforts in their selection can make a world of difference while developing HPLC method for routine analysis, determining the ideal combination of these factors assures faster delivery of desired results. The USP and ICH prescribes the following parameters of validation for quantifying an analytical method:
Accuracy Recovery Precision Specificity Linearity Stability
Limit of Detection
Limit of Quantification
Ruggedness
MATERIALS AND METHOD
The literature survey displays that there was a lot of scope for method development by HPLC for Related Substances of OXCARBAZEPINE API. Thus, the work was planned as given below
To check the identity of the drug sample.
To check the authenticity of drug sample.
Strategy for method development in
HPLC.
Column selection.
Mobile phase selection.
Sample will be chromatographic with
HPLC condition, where all compound elute in a reasonable time.
HPLC method will be optimizing with
respect to analysis time.
Resolution, selectivity and sensitivity.
Oxcarbazepine preparation. standard and
sample
Preparation of diluent
Optimization of chromatographic
conditions viz selection of Wavelength,
Chromatographic method and
chromatographic conditions
mobile phase, pH, stationary phase
Compilation of all the results.
The method developed was also proposed to be validated using the various validation parameters such as
Specificity
Solution Stability
Linearity and Range
Precision
System precision
Repeatability
Intermediate precision
Accuracy
LOD and LOQ
Robustness
Method Development
Method development and optimization of chromatographic parameters for determination of related substances of Oxcarbazepine API is mentioned here under
Chemical structure
Oxcarbazepine API chemical structure shows that it is a basic in nature. pKa value of Oxcarbazepine API is 10.7.
Identification
The IR spectrum of Oxcarbazepine API was recorded by scanning in the IR range
of 450-4000 cm-1.
Column selection
Nonpolar columns have been taken in order to decrease the run time and increase resolution.
Since Oxcarbazepine API is a UV active compound. Therefore, UV detector has been chosen for detection.
Selection of wavelength
An UV spectrum of the Oxcarbazepine API at a concentration of 10µg/ml in Acetonitrile was recorded by scanning in the UV range of 200-400nm. From the scan 256nm was selected as wavelength for the detection and quantification.
Mobile phase selection
In mobile phase preparation following solvent and buffer has been taken:
Acetonitrile is used as it is having the
UV-cut off 190nm and is commonly used solvent.
Different types of buffer solutions are
used during method development to obtain an optimized method conditions.
Method Development Trials
Following HPLC method trials have been run to resolve the above-mentioned impurities
Table 1: Methods trials
Trials 1 2
Mobile Phase Used
Comp. A - 0.1% H3PO4
Comp. B - ACN:MEOH (3:1) Gradient method
Phosphate buffer : ACN : IPA (50:32:18) Isocratic method
Column Inertsil C-18 ODS-3V, (25cm×4.6 mm, 5µm)
Inertsil C-18 ODS-3V, (25cm×4.6 mm, 5µm)
Diluent Water : ACN (1 : 1) Water : ACN (1 : 1)
Temperature & Wavelength
35°C; 256 nm 25°C; 256 nm
Injection Volume 20μL 20μL
Flow 1.0 mL/min 1.0 mL/min
Run Time 30 min. 40 min.
Trials
Observations Oxcarbazepine was not stable
Peaks were eluting late i.e. after
10 min.
Peak purity was not passed.
Impurity D was eluting late
Resolution between peaks was not good.
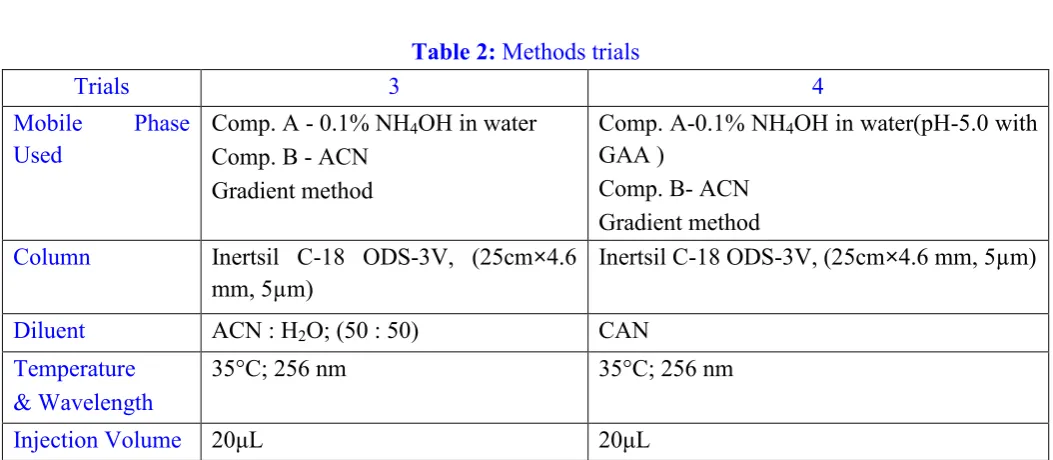
Table 2: Methods trials
Trials 3 4
Mobile Phase Used
Comp. A - 0.1% NH4OH in water
Comp. B - ACN Gradient method
Comp. A-0.1% NH4OH in water(pH-5.0 with
GAA )
Comp. B- ACN Gradient method
Column Inertsil C-18 ODS-3V, (25cm×4.6 mm, 5µm)
Inertsil C-18 ODS-3V, (25cm×4.6 mm, 5µm)
Diluent ACN : H2O; (50 : 50) CAN
Temperature & Wavelength
35°C; 256 nm 35°C; 256 nm
Flow 1.0 mL/min 1.0 mL/min
Run Time 35 min. 35 min.
Trials
Observations Solution was not stable in diluents
Run time is very long
Figure 1: Structure of Oxcarbazepine
RESULT AND DISCUSSION
IdentificationFourier- Transform Infra Red Spectroscopy (FTIR)
The IR spectrum of Oxcarbazepine API presented characteristics signals. The FT-IR spectrum of
Oxcarbazepine is represented in fig. 2.
Figure 2: FT-IR spectrum of Oxcarbazepine sample
Figure 3: UV Scan of Oxcarbazepine sample
N O
O
Analytical Method Validation System suitability
Data from six injections of system suitability solution were utilized for calculating parameters for system suitability. The resolution between Oxcarbazepine and impurity A was more than 3, USP tailing factor was 1.2 i.e. less than 1.5, theoretical plates were 6118 i.e. more than 4000 and the %RSD of the area of Oxcarbazepine was less than 5. It showed that the proposed method is precise. Hence, it can be concluded that the system suitability parameter meets the requirement of method validation.
System suitability parameter Observation(n=6) Acceptance criteria
Tailing factor 1.06 NMT 1.5
Resolution between Oxcarbazepine and impurity A 3.96 NLT 3.0
Theoretical plates 6154 NLT 4000
% RSD of 6 injections 0.09 NMT 5.0
Table 3 System suitability showing resolution & area
Conclusion
The resolution between the Oxcarbazepine and impurity A was observed more than 3.
The % RSD of area of Oxcarbazepine was within the limit (less than 5) as shown in the table 7.1.
The USP theoretical plate was observed more than 4000.
The USP tailing was found within the acceptance limit i.e. less than 1.5
Specificity
Specificity of the method is its ability to measure accurately and specifically the analyte in the presence of impurity, degradation product and related impurity or formulation excipients and ability to separate the analyte in the presence of all the impurity and other expected compound. It is a measure of the degree of interference from such things as other active ingredients, excipients, impurities, and degradation products, ensuring that a peak response is due to a single component only i.e. no co- elutions exist
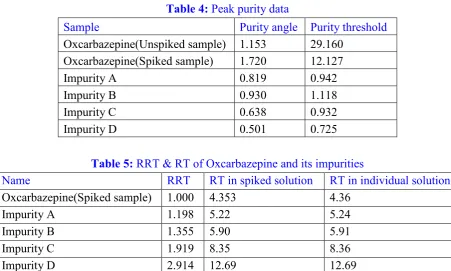
Interference study
Table 4: Peak purity data
Sample Purity angle Purity threshold
Oxcarbazepine(Unspiked sample) 1.153 29.160
Oxcarbazepine(Spiked sample) 1.720 12.127
Impurity A 0.819 0.942
Impurity B 0.930 1.118
Impurity C 0.638 0.932
Impurity D 0.501 0.725
Table 5: RRT & RT of Oxcarbazepine and its impurities
Name RRT RT in spiked solution RT in individual solution
Oxcarbazepine(Spiked sample) 1.000 4.353 4.36
Impurity A 1.198 5.22 5.24
Impurity B 1.355 5.90 5.91
Impurity C 1.919 8.35 8.36
Figure 4: The chromatogram for specificity showing Blank
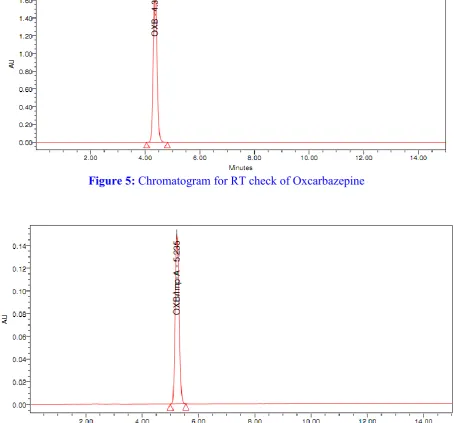
Figure 5: Chromatogram for RT check of Oxcarbazepine
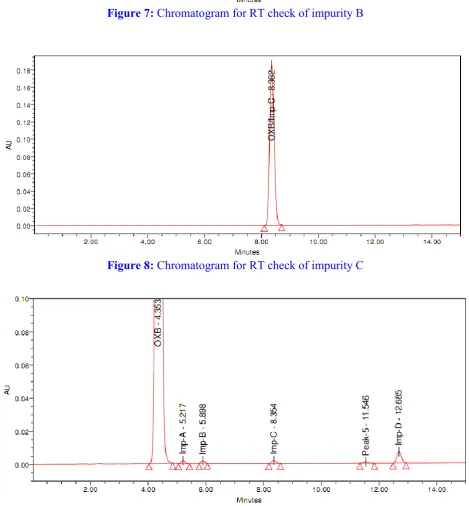
Figure 7: Chromatogram for RT check of impurity B
Figure 8: Chromatogram for RT check of impurity C
Figure 10: Chromatogram for spiked sample solution
CONCLUSION
No peak was observed in blank chromatogram at the retention time of Oxcarbazepine peak and all known impurities as shown in figure 4.
The peak purity (purity angle should be less than purity threshold) of Oxcarbazepine peak and all known impurities peaks passes as per acceptance limit which indicates that the peaks are homogeneous and there is no interference of all known impurities with Oxcarbazepine peak and with each other.
It was observed from the data tabulated above all known impurities are well separated from the Oxcarbazepine peak and with each other.
Linearity and Range
The linearity of an analytical method is its ability to obtain test results which has a definite mathematical relation to the concentration of analyte. Linearity of the proposed method was carried out over the range of LOQ to 150% of considered target limit for all known impurities. A stock solution containing 2.5 µg/mL of all known impurities was used to prepare the linearity solutions of desired concentration of LOQ, 0.25, 0.375, 0.5, 0.625, 0.75 µg/mL for all known impurities and for Oxcarbazepine stock solution containing 25 µg/mL was used to prepare the linearity solutions of desired concentration of 2.5, 3.75, 5, 6.25, 7.5 µg/ml. Table 6-10 shows the result for the linearity of the plot of concentration against the peak area. The
correlation coefficient “r2” was found to be “0.999” for all known impurities. The results indicated that the
method is linear in the concentration range of LOQ to 0.75 µg/mL for all known impurities i.e. impurity A, impurity B, impurity C, and impurity D.
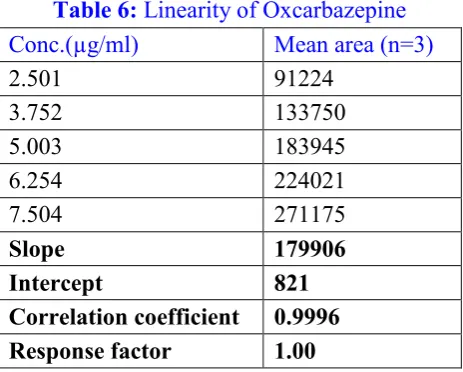
Table 6: Linearity of Oxcarbazepine
Conc.(µg/ml) Mean area (n=3)
2.501 91224
3.752 133750
5.003 183945
6.254 224021
7.504 271175
Slope 179906
Intercept 821
Figure 11: Linearity for Oxcarbazepine
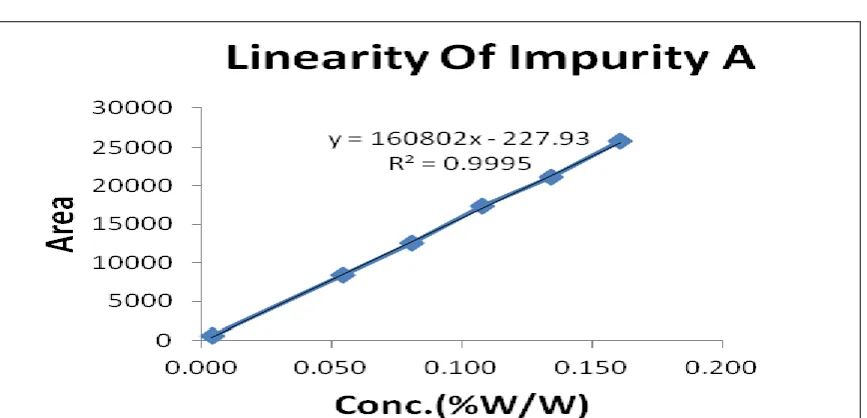
Table 7: Linearity of impurity A
Conc. level Conc. (µg/ml) Mean area (n=3)
QL 0.018 554
50% 0.269 8373
75% 0.403 12517
100% 0.538 17401
125% 0.672 21154
150% 0.806 25800
Slope 160855
Intercept -231
Correlation coefficient 0.9997
Table 8: Linearity of impurity B
Conc. level Conc. (µg/ml) Mean area (n=3)
QL 0.022 599
50% 0.260 7612
75% 0.391 11371
100% 0.521 15816
125% 0.651 19309
150% 0.781 23501
Slope 150807
Intercept -136
Correlation coefficient 0.9997
Figure 13: Linearity for impurity B
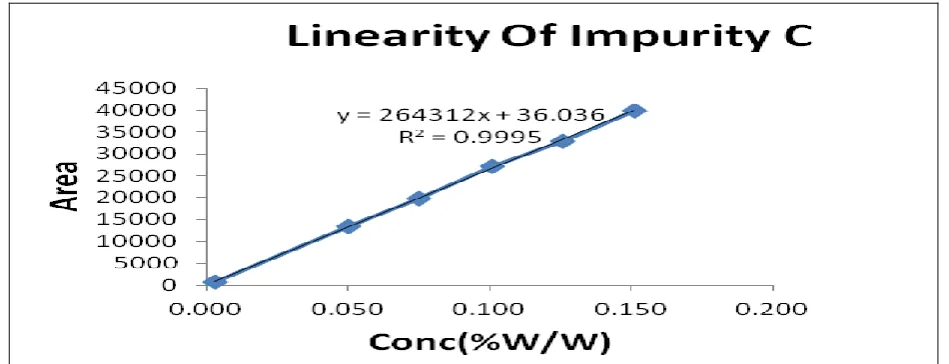
Table 9: Linearity of impurity C
Conc. level Conc. (µg/ml) Mean area (n=3)
QL 0.013 624
50% 0.251 13432
75% 0.377 19819
100% 0.503 27223
125% 0.628 32964
150% 0.754 39896
Slope 264307
Intercept 36
Correlation coefficient 0.9998
Response factor 0.68
Figure 14: Linearity for impurity C
Table 10: Linearity of impurity D
Conc. Level Conc. (µg/ml) Mean area (n=3)
QL 0.003 613
50% 0.247 43629
75% 0.371 64467
100% 0.495 88968
125% 0.619 10837
150% 0.742 131446
Slope 886290
Intercept -203
Correlation coefficient 0.9998
Response factor 0.20
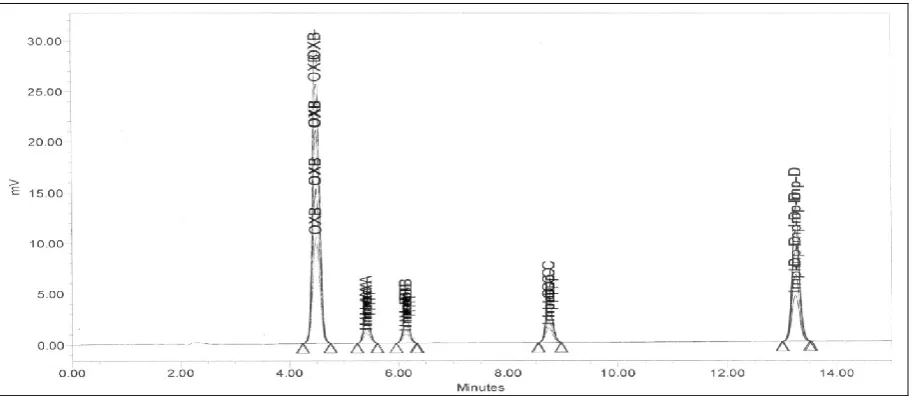
Figure 16: The chromatogram of different levels of standard solution for linearity
CONCLUSION
Correlation coefficient found 0.9996 within acceptance limit for Oxcarbazepine as shown in fig.11
and the data shown in table 6.
Correlation coefficient found 0.9997 within acceptance limit for impurity A as shown in fig.12 and
the data shown in table 7.
Correlation coefficient found 0.9997 within acceptance limit for impurity B as shown in fig.13 and
the data shown in table 8.
Correlation coefficient found 0.9998 within acceptance limit for impurity C as shown in fig. 14 and
the data shown in table 9.
Correlation coefficient found 0.9998 within acceptance limit for impurity D as shown in fig.15 and
the data shown in table 10.
ACCURACY
The accuracy of an analytical procedure expresses the closeness of agreement between the value which is accepted either as a conventional true value or an accepted reference value and the value found. The accuracy of the method was determined by recovery studies. The known amount of impurities were spiked as per table in triplicate to the samples and the recovery of the drug was calculated. The accuracy of the method was calculated at three levels such as 50%, 100%, and 150% of considered target limit. The results indicated that the mean recovery of impurity A, impurity B, impurity C, and impurity D are 102.70%, 101.73%, 102.01%, 100.91% respectively. The recovery experiments of the method are depicted in the table. The chromatograms for 50%, 100 and 150% of impurities spiking is given in the figure 17-19.
Accuracy study for Impurity A
Table 11: Accuracy data for Impurity A Recovery
levels
Amount added (µg/ml)
Amount recovered (µg/ml)
% Recovery Mean SD % RSD
50%
0.269 0.271 100.63
101.84 0.875 0.859
0.269 0.275 102.22
0.269 0.276 102.67
100%
0.538 0.554 103.04
103.15 0.104 0.101
0.538 0.554 103.12
150%
0.806 0.834 103.44
103.12 0.225 0.218
0.806 0.831 103.00
0.806 0.830 102.93
Overall 102.70 0.40 0.39
Accuracy study for Impurity B
Table 12: Accuracy data for Impurity B Recovery levels Amount added
(µg/ml)
Amount recovered (µg/ml)
% Recovery Mean SD %RSD
50%
0.260 0.250 96.18
96.45 0.195 0.203
0.260 0.251 96.52
0.260 0.252 96.64
100%
0.521 0.542 104.11
104.11 0.017 0.016
0.521 0.542 104.13
0.521 0.542 104.09
150%
0.781 0.820 104.95
104.62 0.328 0.313
0.781 0.814 104.17
0.781 0.818 104.74
Overall 101.73 0.18 0.18
Accuracy study for Impurity C
Table 13: Accuracy data for Impurity C Recovery levels Amount added
(µg/ml)
Amount recovered (µg/ml)
% Recovery Mean SD % RSD
50%
0.251 0.235 93.34
95.09 1.463 1.538
0.251 0.239 95.02
0.251 0.244 96.92
100%
0.503 0.485 96.52
96.72 0.287 0.297
0.503 0.485 96.51
0.503 0.488 97.12
150%
0.754 0.862 114.35
114.23 0.135 0.118
0.754 0.860 114.04
0.754 0.862 114.29
Overall 102.01 0.63 0.65
Accuracy study for Impurity D
Table 14: Accuracy data for Impurity D Recovery levels Amount added
(µg/ml)
Amount recovered (µg/ml)
% Recovery Mean SD % RSD
50%
0.247 0.248 100.17
100.04 0.101 0.101
0.247 0.247 100.01
0.247 0.247 99.93
100%
0.495 0.502 101.37
101.29 0.131 0.129
0.495 0.502 101.40
0.495 0.500 101.11
150%
0.742 0.753 101.47
101.40 0.063 0.062
0.742 0.753 101.42
0.742 0.752 101.32
Overall 100.91 0.10 0.10
Figure17: The chromatogram for Accuracy at 50% level
Figure 19: The chromatogram for Accuracy at 150% level
CONCLUSION
The % Recovery of impurity A was found 102.70% within the acceptance limit i.e. in between
80-120%(data shown in table 11)
The % Recovery of impurity B was found 101.73% within the acceptance limit i.e. in between
80-120%(data shown in table 12)
The % Recovery of impurity C was found 102.01% within the acceptance limit i.e. in between
80-120%(data shown in table 13 )
The % Recovery of impurity D was found 100.91% within the acceptance limit i.e. in between
80-120%(data shown in table 14)
The chromatograms representing accuracy of all impurities at 50%, 100% and 150% (data shown in
fig.17-19.)
SUMMARY AND CONCLUSION
SUMMARYThe summary of the work done Method Development
Table 15: Chromatographic condition
Column
Inertsil ODS3V, (250 4.6 mm), 5.0 micron
Column Temperature 35° C
Flow Rate 1.0 mL per minute
Gradient Program Time (Min) M P-A, % M P-B, %
0.0 50 50
15 20 80
15.1 50 50
Injection Volume 20 L
Next Injection Delay 5.0 minutes
Detector wavelength 256 nm
Run Time 15 I
Method Validation
Table 16: Impurity A
Parameters Observed Value ICH Specification
Specificity Peak was pure Peak purity should pass
Linearity 0.9997 Not less than 0.999
System precision %RSD 0.10 < 1 %
Repeatability %RSD 0.42 < 2 %
Intermediate precision %RSD 3.13 < 10%
Accuracy 102.70% 80-120%
LOD %RSD 10.05 < 33%
LOQ %RSD 3.24 < 10%
Robustness RSD was < 2 % < 2%
Table 17: Impurity B
Parameters Observed Value ICH Specification Specificity Peak was pure Peak purity should pass
Linearity 0.9997 Not less than 0.999
System precision %RSD 0.10 < 1 %
Repeatability %RSD 1.04 < 2 %
Intermediate precision %RSD 0.00 < 10%
Accuracy 101.73% 80-120%
LOD %RSD 11.35 < 33%
LOQ %RSD 3.56 < 10%
Robustness RSD was < 2 % < 2%
Table 18: Impurity C
Parameters Observed Value ICH Specification Specificity Peak was pure Peak purity should pass
Linearity 0.9998 Not less than 0.999
System precision %RSD 0.10 < 1 %
Repeatability %RSD 1.45 < 2 %
Intermediate precision %RSD 2.67 < 10%
Accuracy 102.01% 80-120%
LOD %RSD 4.83 < 33%
LOQ %RSD 1.75 < 10%
Table 19: Impurity D
Parameters Observed Value ICH Specification Specificity Peak was pure Peak purity should pass
Linearity 0.9998 Not less than 0.999
System precision %RSD 0.10 < 1 %
Repeatability %RSD 0.22 < 2 %
Intermediate precision %RSD 1.06 < 10%
Accuracy 100.91% 80-120%
LOD %RSD 9.66 < 33%
LOQ %RSD 5.35 < 10%
Robustness RSD was < 2 % < 2%
Table 20: Oxcarbazepine
Parameters Observed Value ICH Specification Specificity Peak was pure Peak purity should pass
Linearity 0.9996 Not less than 0.999
System precision %RSD 0.10 < 1 %
Repeatability %RSD 0.46 < 1 %
Intermediate precision %RSD 0.01 < 10%
Robustness RSD was < 2 % < 2%
CONCLUSION
The proposed HPLC method enables quantitative determination of related substances of Oxcarbazepine API. UV detection at 256nm was found to be suitable without any interference. The result of linearity, precision, specificity and ruggedness were within limits. Preparation of samples is easy and efficient. From the results of related substances of Oxcarbazepine analysis it can be concluded that the proposed HPLC method is precise, linear and robust that can be used for routine analysis.
BIBILIOGRAPHY
1. Alves, G; Isabel, I; Loureiro, A and Caramona, M (2007), “Simultaneous and enantioselective
liquid chromatographic determination of eslicarbazepine acetate, S-licarbazepine and
Oxcarbazepine in mouse tissue samples using UV”, Analytica Chimica Acta., Vol. 596, Issue 1,
132-40.
2. Bais, S; Chandewar, A and Kakani, A (2013), “Development and Validation of a stability indicating
HPLC method for analysis of Lamotriginein in bulk drug and formulation”, International Journal
of Universal Pharmacy and Bio Sciences,Vol. 2, Issue 3, 334-353.
3. Bansal, k (2010), “Chromatography”, Analytica Chimica Acta, Vol. 2000, 187-190.
4. Bhaumik, U; Bose, A; Chatterjee, B; Ghosh, A; Sengupta, P and Agarwal, S (2010),
“Stability-indicating HPLC method for the determination of oxcarbazepine in pharmaceutical formulation”,
Asian J Chem.,Issue 22, 2051-2057.
5. Bidlingmeyer, BA and Warren, FV Jr (1984), “Analytical Chemistry”, Analytica Chimica Acfta,
Vol. 56, 1583-1596.
6. Contin, M; Balboni, M; Callegati, E; Candela, C; Albani, F; Riva, R and Baruzzi, A (2005),
derivative and felbamate in plasma of patients with epilepsy”, Journal of ChromatographyB., Vol. 828, Issue 1, 113-117.
7. Contin, M; Mohamed, S; Candela, C; Albani, F; Riva, R and Baruzzi, A (2010), “Simultaneous
HPLC-UV analysis of rufinamide, zonisamide, lamotrigine, oxcarbazepine monohydroxy derivative
and felbamate in deprotinised plasma of patients with epilepsy”, Journal of Chromatography B.,
Vol. 878, Issue 3,461-465.
8. Dicesare, JL; Dong, MW and Vandermark, FL (1981), “Development and Validation of a stability
indicating HPLC method”, Wiley Interscience., Vol. 13, Issue 52, 554-574.
9. Ewing, AG; Wallingford, R and Olefirowicz, TM (1989), “Analytical Chemistry”, JPC-J Planar
Chromat., Vol. 61, 292-303.
10. Furman, WB; Layloff, TP and Tetzlaff, RF (1994), “Validation of computerized liquid
chromatographic systems”, J. AOAC Int., Vol. 77, Issue 5, 1314-1318.
11. Gandhimathi, M and Ravi, TK (2008), “Rapid HPTLC analysis of oxcarbazepine in human
plasma”, JPC-J Planar Chromat.,Issue21,437-439.
12. Grushka, E; Zamir, I; Brown, P and Hartwick, R (1989), “Precision in HPLC in Chemical
Analysis”, Wiley Interscience, Vol. 98, 529-561.
13. Knapp, LE; Kugler, AR and Eldon, MA (1996), “Fosphenytoin: pharmacokinetics and
administration”, Emerg Med.,Vol. 15, Issue 9, 9-16.
14. Lanckmans, K; Clinckers, R; Van, EA; Sarre, S; Smolders, I and Michotte, Y (2006), “Use of microbore LC-MS/MS for the quantification of oxcarbazepine and its active metabolite in rat brain
micro dialysis samples”, J Chromatogr B Analyt Technol Biomed Life Sci., Issue 831, 205-12.
15. Loureiro, AI; Fernandes, LC; Wright, LC and Soares-da-silva, P (2011), “Development and validation of an enantioselective liquid chromatography/tandem mass spectrometry method for separation and quantification of eslicarbazepine acetate, eslicarbazepine, R-licarbazepine and
Oxcarbazepine in human plasma”, Journal of Chromatography B., Vol. 879, Issue 25, 2611-2618.
16. Maria, AS; Katianna, T and Maria, AR (2007), “Liquid chromatographic analysis of Oxcarbazepine and its metabolite in plasma and saliva after a novel microextraction by packed sorbent procedure”,
Analytica Chimica Acta., Vol. 661, Issue 2, 222-228.
17. Maria, BS; Demetrius, FN; Ismael, LM; Adriano, NC; Francisco, EG and Fernando, AF (2010), “Simultaneous quantitative analysis of Oxcarbazepine and 10,11-dihydro-10-hydroxy carbamazepine in human plasma by liquid chromatography electro spray tandem mass
spectrometry”, Journal of Pharmaceutical and Biomedical Analysis,Vol. 45, 304-311.
18. Mazza, M; Della Marca, G; Di Nicola, M; Martinotti, G; Pozzi, G and Janiri, L (2007),
“Oxcarbazepine improves mood in patients with epilepsy”, Epilepsy Behav., Vol. 10, Issue 15,
397-401.
19. Mazza, M; Della Marca, G; Di Nicola, M; Martinotti, G; Pozzi, G; Janiri, L; Bria, P and Mazza, S
(2007), “Oxcarbazepine improves mood in patients with epilepsy”, Epilepsy Behav., Vol. 10, Issue
3, 397-401.
20. Paglia, G; Garofalo, D; Scarano, C and Corso, G (2007), “Development and validation of a LC/MS/MS method for simultaneous quantification of Oxcarbazepine and its main metabolite in
human serum”, Journal of Chromatography B.,Issue 860, 153-159.
21. Pathare, DB; Jadhav, AS and Shingare, MS (2007), “A validated stability indicating LC method for
Oxcarbazepine”, Journal of Pharmaceutical and Biomedical Analysis,Vol. 85, 1825-1830.
22. Qi, ML; Wang, P; Wang, LJ and Fu, RN (2003), “LC method for the determination of
23. Rao, KS; Belorkar, N and Rao, M (2009), “Development and validation of stability-indicating liquid chromatographic method for the quantitative determination of Oxcarbazepine in tablet dosage
forms”, J Young Pharmacists,Vol. 1, Issue 3, 270-277.
Correspondence Author:
Varshney Neha
Department of Pharmaceutical Technology, Noida Institute of Engineering and Technology, Plot No.19, Knowledge Park-II, Greater Noida, Uttar Pradesh-201306, India