Forestry & Natural-Resource Sciences Last Correction: Oct. 10, 2018
THE ROLE OF THE U.S. MAYORS AND URBAN FORESTS IN
ADDRESSING CLIMATE CHANGE MITIGATION AND
ADAPTATION
Y.L. Tran
1, J.P. Siry
2, J.M Bowker
3, N.C. Poudyal
41,2 Warnell School of Forestry & Natural Resources, University of Georgia, Athens, GA, USA
3
USDA Forest Service, Southern Research Station, Athens, GA, USA 4
Department of Forestry, Wildlife & Fisheries, Knoxville, University of Tennessee, TN, USA
Abstract. Leadership at cities and municipalities can be instrumental in beginning local conversation regarding climate change and urban forest policies. Much research has been devoted to national climate change actions, but little is currently known about initiatives and actions at the local level. This study presents results of a survey of U.S. Conference of Mayors Climate Protection Agreement (MCPA) members, representing 1,054 cities and 93.6 million people, conducted to improve the understanding of how mayors view urban forest policies related to climate change. The goals of the study were to examine local government initiatives for climate change and urban forests and how mayors prioritize these investments. The results indicated that a variety of local climate change mitigation and adaptation actions were being pursued by member MCPA cities. This is important as the international climate change regime rarely acknowledges the role of cities tackling climate change, though they are vulnerable settlements and at the same time important emitters. Since MCPA represents the most heavily populated states as well as the majority of the state capitals in the United States, policymakers should seriously consider integrating the roles of these local institutions in the national climate change policy process, and emphasize adaptation and urban forests’ role in these efforts.
Keywords: Municipal; governments; cities; greening; networks
1
Introduction
Addressing climate change remains one of the chal-lenging public policy issues in the United States and beyond. Thus far, most climate change strategies are fo-cused on the mitigation of emissions, primarily driven by international initiatives and agreements, such as the Ky-oto PrKy-otocol. Some countries’ governments have exam-ined different mechanisms to facilitate collective action, with the most popular being cap-and-trade and carbon tax approaches (Stern 2006, Congressional Budget Of-fice 2003). While mitigation has dominated the inter-national agenda, addressing the issues of vulnerability and adaptation to climate change has received growing recognition (United Nations Habitat 2011, Bulkeley and Tuts 2013).
Because researchers estimate that more than three-fourths of global carbon emissions come from urban ar-eas (Satterthwaite 2008, Stern 2006), cities become a
natural place to start a discussion concerning climate change. People tend to choose to live and cluster in urban areas, but because of the concentrated nature of their pollution and increased consumption of resources, urban areas tend to heavily contribute to environmental problems. Local governments have been found to lead the majority of climate change interventions to try out new ideas and methods in the context of future uncer-tainties (Broto and Bulkeley 2013).
Cities can respond to climate change concerns through emissions mitigation but also by taking or promot-ing adaptive strategies (United Nations Habitat 2011). Stone (2012a) suggested that rather than focusing purely on emission reductions, adaptive strategies such as inno-vative land use planning, should also be employed. Ac-cording to previous research, the most effective ways to adapt to rising heat effect of climate change could be planting trees and expanding natural vegetation in
ban areas (Lynn et al. 2009, Zhou and Shepherd 2009, Stone 2012a, Stone 2012b, Stone et al. 2013). Similar strategies of adaptation can include increasing options for water retention and infiltration, reducing the heat island effect, and reducing vulnerability to natural haz-ards such as storms and hurricanes. Nevertheless, rela-tively few cities have developed and implemented coher-ent adaptation strategies. Instead, they have focused on mitigation strategies, partly as a result of existing in-centives for mitigation activities (United Nations Habi-tat 2011, Jabareen 2013).
It is unwise and often impossible to separate miti-gation actions from adaptation measures (Bulkeley and Tuts 2013) because of the inherent synergy between the two agendas. For instance, urban forests have been known to provide ecosystem benefits that address both mitigation and adaptation strategies such as seques-tering carbon, reducing air pollution, providing shade thereby decreasing energy demands, decreasing the ur-ban heat island effect, and intercepting water runoff thus controlling stormwater overflow problems (Thomas and Geller 2013, United Nations Habitat 2011, Wal-ton et al. 2016). The creation, maintenance, and func-tionality of urban forestry is proposed as a key environ-mental resource that bridges these two positions (Bene-dict and McMahon 2006) and may also engage citizens in environmental stewardship (Fisher et al. 2015). In-vestments in urban forests have increased in many cities and studies generally assert that any increase in urban forests is desirable and will mitigate pollution problems (Manning 2008, McPherson et al. 2013, Roy et al. 2012). In this study, we investigated local government net-works in climate change efforts. Specifically, we sought answers to the following questions: 1) What are the characteristics that predict climate change implementa-tion within the MCPA network? 2) What is the will-ingness of mayors to prioritize urban forests and climate change adaptation? and 3) What actions have mayors taken on urban forests and what role do they play in climate change?
1.1 Emergence of Local Institutional Networks of Climate Protection
Governance networks are believed to be important conduits of information and collective actions while ad-dressing public problems (Granovetter 1985) and play-ing a key role in urban responses to climate change (Bulkeley 2010). Climate change networks in particular have been shown to increase commitment and actions regarding climate change (Hakelberg 2014). Lee and Koski (2015) suggest that signing a climate change pro-tection agreement places the mayor in a network of like-minded actors, offering opportunities to develop
solu-tions to climate change. Furthermore, Hakelberg (2014) showed that network membership had a positive impact on European cities’ propensity to adopt climate change strategies.
There are two primary climate change networks in the United States: the U.S. Conference of Mayors’ Climate Protection Agreement (MCPA) and the International Council for Local Environmental Initiatives’ (ICLEI) Cities for Climate Protection (CCP). The CCP pro-gram has members worldwide and performance is tied to five municipal mitigation milestones. MCPA is U.S.-based and although has overarching objectives aimed at climate change policy and emission mitigation, perfor-mance is not tied to milestones. Krause (2012) showed that CCP membership had a small to moderate effect on local climate change activity, whereas no such dis-cernable effect with MCPA membership. The MCPA has been viewed as a symbolic agreement because of its nonbinding nature (Krause 2011). However, the role of local leadership within networks is important to ad-dressing climate change and agreements like MCPA can indirectly influence climate action because the network creates a mechanism for cities to influence each other (Lee and Koski 2015).
1.2 Climate Networks’ Role in Climate Adap-tation
Research is limited in the role of climate networks in climate adaptation efforts. Adaptation initiatives may be less presented because they have less visibil-ity than those concerned with mitigation (Broto and Bulkeley 2013) and they also may not have been taken purposefully in the name of climate change. Another challenge is the uncertainty associated with climate pre-dictions and understanding the nature of future climate change risks as well as identifying the main drivers of urban vulnerability. Most adaptation analyses investi-gate the physical vulnerability of cities to the direct im-pacts of weather and climate events only; even though it is understood that vulnerabilities depend not only on physical parameters but also socioeconomic factors (Hal-legatte and Corfee-Morlot 2011).
sociode-mographic predictors of cities’ climate change mitigation actions have little power in explaining a city’s prioriti-zation of climate change adaptation actions.
2
Methodology
Since our study involved examining the MCPA mem-bers’ climate change initiatives and actions, required data were collected via survey. MCPA members con-sist of more than 1,000 local governments in the United States, representing cities in every state, including the District of Columbia, the Northern Mariana Islands, and Puerto Rico, encompassing about 30 percent of the total U.S. population and 36.9 percent of the U.S. metropoli-tan population. Membership to MCPA represent an ap-peal to a more liberal urban demographic and real com-mitments to purchasing, energy consumption, and land use (Lee and Koski 2012).
An electronic survey instrument was developed and pre-tested on 50 randomly selected MCPA members and yielded a response rate of 20 percent. The final survey was implemented during the winter of 2013–2014 with an invitational email including a link to the survey sent to each MCPA member. The survey questions covered the topics of: (1) the perceived effectiveness of MCPA goals, (2) opinions and actions on climate change, (3) the prioritization of environmental investments, and (4) opinions and actions on urban forests. The identity and contact information for each mayor was obtained by re-viewing the MCPA list, municipal websites, or by con-tacting city hall. A follow up reminder was sent one week later. Nonrespondents received two additional follow up emails. Data on each city’s land area in square miles, population, racial demographics, education attainment level of residents, median household income, and me-dian home values were obtained from 2010 U.S. Census datasets. Demographic data were also requested of the respondents. Information on the percent local votes cast for Democrat candidate in 2012 presidential election was obtained from the Congressional Quarterly Voting and Elections Collection (2003). The survey and its corre-sponding research protocols were reviewed and approved by the Institutional Review Board at the University of Georgia to ensure the protection of rights and welfare of human subjects of the research.
2.1 Model 1
We first applied the “political market” framework to examine the supply and demand factors for MCPA cities within their climate change initiatives. These re-sults serve to examine the effects of MCPA networks on overall climate change efforts, which addresses the first research question. The “political market” theory of policy change is a combination of the Tiebout theory,
the theory that household mobility will induce jurisdic-tions to provide efficient mixes of local public goods and taxes (Tiebout 1956), and an “interest group” frame-work, a theory that political forces and interests are mediated by local institutions, such as local nonprofits (Lubell et al. 2005, Feiock et al. 2010).
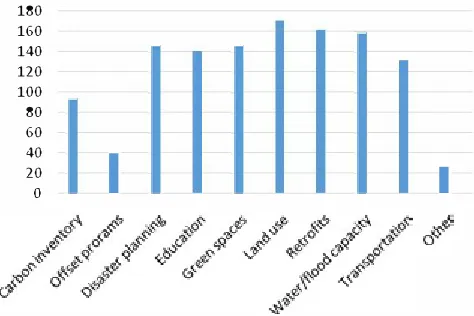
The number of climate change actions a city took is the dependent variable for this analysis. Participants were asked to select climate change issues being ad-dressed in their city, whether through regulations or poli-cies and aimed government-wide or community-at-large. Ten climate change issues were presented for selection: carbon emissions inventory, carbon offset programs, dis-aster preparedness planning, educational/awareness pro-grams, increase of urban green spaces, land use plan-ning, retrofitting buildings with energy efficient materi-als, storm drain and water-absorbing capacity improve-ments, transportation improveimprove-ments, or others specified in text by the participant (Figure 1). Policy actions were summed to generate the dependent variable. Weights were not applied because the accuracy of weighting each action is debatable (Kwon et al. 2014), since some policy actions are harder than others to achieve (Krause 2011) and the problem depends on the scope and scale of prob-lems to be addressed as well as on the extent that the is-sues overlap other policy areas (Feiock and Coutts 2013).
180 160 140 120 100 80 60 40 20
0
I
I
Figure 1: Climate change actions adopted.
A standard approach for addressing summed integer variables, or count data, is a Poisson regression model (King 1988). This model has been used in previous re-search examining climate actions taken by cities (Bae and Feiock 2013; Kwon et al. 2014). A random variable
Y is said to have a Poisson distribution with parameter
µ if it takes integer valuesy=0, 1, 2, with probability
P r{Y =y}=e
−µµy
for µ>0. The mean of this distribution is equal to the variance. Two tests were run to test the applicability of the Poisson model: 1) the goodness of fit test, which yielded an insignificant (p<0.05) test statistic, indicat-ing that the Poisson model was appropriate and 2) the likelihood ratio test of overdispersion parameter alpha after running the analysis using a negative binomial re-gression, which showed that alpha is not significantly different from zero, thus reinforcing the Poisson distri-bution as appropriate.
The likelihood function fornindependent Poisson ob-servations is a product of the probabilities given in equa-tion (1). The log likelihood equaequa-tion is:
logL(β) =X{yilog (µi)−µi} (2)
where µi depends on the covariates xiand a vector of
parametersβ. Using the link function to transformy:
G(y) = log(y) (3)
and adding (3) to a regression equation yields the Pois-son regression:
log (Yi) =β0+β1X1+. . .+β13X13 (4)
where Y represented the number of climate change ac-tions taken by a given city.
The supply-side independent variables in the Poisson regression included government form, climate change staff, per capita general funds, and climate change salience. The government form was found by looking up the charter for each city. The variable was coded 1 for council-manager and 0 for mayor-council or other structure. Scholars argue that the council-manager form of government produces greater efficiency in local government policy and operations than the traditional mayor-council form of government (Bae and Feiock 2013, Clingermayer and Feiock 1993). The form of the mu-nicipal government may shape the choice to pursue cli-mate change actions. The mayor-council form of govern-ment was expected to be related to the number of cli-mate change actions, since it has been shown the mayor-council structure tends to focus on the community-at-large and the council-manager form tends to focus more on administrative organization (Bae and Feiock 2013).
The presence of climate change staff may be an in-dicator of the ability for a city to undertake climate change activities, since advancing such activities would be difficult without staff developing and implementing plans. Resources and fiscal health of a city can be rep-resented by per capita general fund; therefore, the size of a city’s general fund may be an indicator of the abil-ity to increase climate change actions and also urban forests (Krause 2011). The amount of importance a city
official places on taking action on climate change ac-tivities would also be an indicator of how many climate change activities are undertaken, as measured byclimate change salience. City officials’ beliefs in climate protec-tion could generate more leadership and motivaprotec-tion in increasing climate change activities. To control for the effect of differences in respondent (mayor versus desig-nated representative), the variable mayor was added, which was coded 1 for a mayor and 0 for a designated representative responding on behalf of the mayor.
The demand-side independent variables in the Pois-son regression included environmental awards, me-dian income, population, percent white population, percent Democratic voters, and population density. Zahran et al. (2008) found that community involve-ment in environinvolve-mental causes in addition to nonprofit environmental organization activity increased the likeli-hood that cities would participate in ICLEI’s CCP cam-paign. However, Lee and Koski (2015) found that en-vironmental groups were not significant drivers of cli-mate change mitigation action in cities. Thus as a proxy, environmental awards may be an indicator of support from local stakeholder groups, influencing lo-cal policy choices (Bae and Feiock 2013, Feiock and West 1993). Certain city characteristics can be viewed as motivation for officials to address environmental is-sues (Krause 2010). The community characteristics of
median income of city residents (Cottrell, 2003), popu-lation (Lubell et al. 2005, Zhu and Zhang 2008),percent white population (Kalof et al. 2002),percent Democratic voters (Krause 2010), andpopulation density (Bae and Feiock 2013, Poudyal et al. 2010) have all been linked to demand for environmental protection in previous re-search.
2.2 Model 2
ad-dress climate change from a list that included emissions trading, performance- or cost-based credit, carbon tax, adaptation projects, or other (Figure 2).
Figure 2: Top priority method to address climate change.
The latent variable model, with the latent variable,y∗
(Wooldridge 2010), was:
yi∗=βxi+ei (5)
whereβ was a vector of parameters,ei∼Normal (0,1),
and y∗ was not observed, but observed was the binary
variabley, which represented a discrete choice variable, 0 or 1:
yi=
0 if yi∗ ≤ 0
1 if yi∗ > 0 (6) The likelihood probabilities were:
P(Yi= 1) = Φ(βxi) (7)
P(Yi= 0) = 1−Φ(βxi) (8)
whereP represented the probability that the respondent selected yes or no to the climate change activity of the increase of green spaces and Φ represented the standard normal cumulative distribution function.
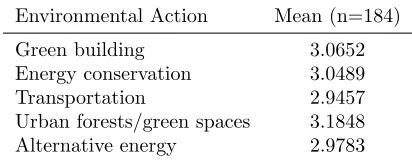
The independent variables in the probit regression included all variables from the Poisson regression and additional variables that may be factors in prioritizing climate change adaptation: green infrastructure, urban forests, urban forest plan, and prioritization of urban forests. Thegreen infrastructure variable was based on whether a city had taken action on installing green in-frastructure. The urban forests variable was measured based on the level of importance the mayor assigned to urban forests being included in climate change strate-gies (Tab. 1). Theurban forest planvariable was based on whether the city had an urban forest plan in place or not. The prioritization of urban forests was based
on the ranking assigned when compared to other envi-ronmental priorities. These variables have been cited as important to climate adaptation (Gill et al. 2007). To understand how the independent variables affect the un-observed latent variable y∗, the marginal effects of the corresponding variables, which are a function of both the estimated parameters and the values of the explanatory variables, can be calculated using:
∂yi
∂xk
∂P(yi= 1|z)
∂xk
= φ(β0xi)βk (9)
where φis the probability density function of the stan-dard normal cumulative distribution function and z rep-resents x1, x2. . . x15. Thus the marginal effect of
in-creasing xk resulted in a change iny of the magnitude
φ(xiβ)βkwhich varies according to values of x which are
selected. Most software use a default value of the sample means for the x vector.
Table 1: Preferred environmental priority actions (1=least preferred; 5=most preferred)
Environmental Action Mean (n=184)
Green building 3.0652 Energy conservation 3.0489 Transportation 2.9457 Urban forests/green spaces 3.1848 Alternative energy 2.9783
2.3 Urban Forests’ Role in Climate Change Strategies
For the third research question regarding what role ur-ban forests played in climate change strategies, we an-alyzed responses to urban forest survey questions and additional text provided by respondents. Questions in-cluded whether the city already had an urban forest plan, how strongly the respondent felt urban forests should be part of climate change strategies, and if the city planned to increase urban forests within the next five years.
3
Results
Table 2: Survey respondents and nonrespondents compared to all U.S. MCPA cities
Characteristics All cities receiving survey (n=1,001)
Responding cities (n=244)
Nonresponding cities (757) Population 91,481,412.0 29,213,566.0 622,667,846.0 Average population 91,390.0 119,727.7 82,256.1 Median household income (dollars) 61,880.6 65,205.0 60,809.1 Education (% bachelor’s or higher) 36.4 40.5 35.1 Political leaning (% Democrat) 55.5 56.6 55.1 Population density (population per square mile) 3,309.2 3,481.9 3,254.8
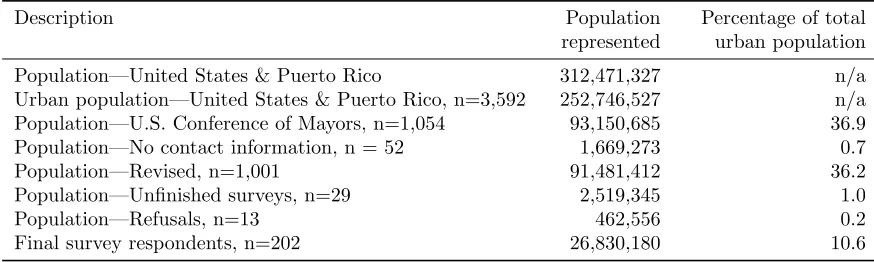
Table 3: Survey respondents compared to total urban U.S. and Puerto Rico populations, 2010
Description Population
represented
Percentage of total urban population
Population—United States & Puerto Rico 312,471,327 n/a Urban population—United States & Puerto Rico, n=3,592 252,746,527 n/a Population—U.S. Conference of Mayors, n=1,054 93,150,685 36.9 Population—No contact information, n = 52 1,669,273 0.7 Population—Revised, n=1,001 91,481,412 36.2 Population—Unfinished surveys, n=29 2,519,345 1.0
Population—Refusals, n=13 462,556 0.2
Final survey respondents, n=202 26,830,180 10.6
The responding mayors’ (or their designated represen-tatives’) cities represented 38 states and one territory covering 26.2 million people or about 28.7 percent of the revised sample population (Tab. 3). The population of Puerto Rico was included in this study because there were several mayors from Puerto Rico who signed onto the Climate Protection Agreement, with one mayor from Puerto Rico participating in this study.
In comparison to the surveys performed by the U.S. Conference of Mayors, the 24.4 percent response rate was on par with previous studies. The first survey conducted by the U.S. Conference of Mayors in 2007 to benchmark the efforts of all the signatories yielded a 25.3 percent re-sponse rate (U.S. Council of Mayors 2007). The second survey was performed in 2008 to assess resource con-straints on climate protection strategies yielded a 15.5 percent response rate (U.S. Council of Mayors 2008). A third survey was performed in 2014 to assess the cli-mate change mitigation and adaptation actions of may-ors yielded a 26.9 percent response rate (U.S. Council of Mayors 2014). We contributed to these studies by extending quantitative analysis to examine what factors may affect mayors’ decision-making.
The representativeness of respondents was assessed with the revised MCPA cities surveyed. The average population size of the responding cities was 129,860, which was about 41 percent larger than the revised MCPA average of 92,124. The median household in-come for the responding cities was $64,789, which was
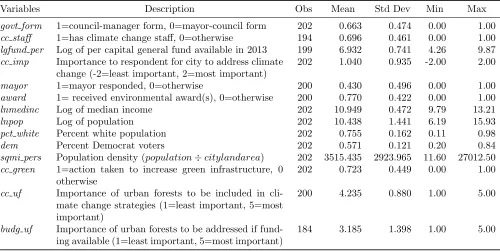
Table 4: Descriptive statistics for independent variables
Variables Description Obs Mean Std Dev Min Max
govt form 1=council-manager form, 0=mayor-council form 202 0.663 0.474 0.00 1.00
cc staff 1=has climate change staff, 0=otherwise 194 0.696 0.461 0.00 1.00
lgfund per Log of per capital general fund available in 2013 199 6.932 0.741 4.26 9.87
cc imp Importance to respondent for city to address climate change (-2=least important, 2=most important)
202 1.040 0.935 -2.00 2.00
mayor 1=mayor responded, 0=otherwise 200 0.430 0.496 0.00 1.00
award 1= received environmental award(s), 0=otherwise 200 0.770 0.422 0.00 1.00
lnmedinc Log of median income 202 10.949 0.472 9.79 13.21
lnpop Log of population 202 10.438 1.441 6.19 15.93
pct white Percent white population 202 0.755 0.162 0.11 0.98
dem Percent Democrat voters 202 0.571 0.121 0.20 0.84
sqmi pers Population density (population÷citylandarea) 202 3515.435 2923.965 11.60 27012.50
cc green 1=action taken to increase green infrastructure, 0 otherwise
202 0.723 0.449 0.00 1.00
cc uf Importance of urban forests to be included in cli-mate change strategies (1=least important, 5=most important)
200 4.235 0.880 1.00 5.00
budg uf Importance of urban forests to be addressed if fund-ing available (1=least important, 5=most important)
184 3.185 1.398 1.00 5.00
survey topic and evaluation apprehension; and therefore, weighting did not lead to better results (Van Goor and Stuiver 1998).
3.1 Differences in Perception between Mayors and Designated Officials
To compare the attitudes of respondents who were mayors and those who were designated representatives, a Kruskal-Wallis test was performed to determine if any significant differences between the two groups existed. The null was that the two groups were from identical populations. Differences were found for the following variables (values): Increase Urban Green Spaces, p-value = 0.016; Land Use Planning, p-p-value = 0.001; Storm Drain and Water-Absorbing Improvements, p-value = 0.002; and Change in Environmental Budget, p-value = 0.002, suggesting that there could be a small difference between the responses of mayors and desig-nated representatives. Thus the dummy variable may-ors, where 1 = mayor and 0 = designated representative, was added to regression models.
3.2 Factors Contributing to Climate Change Actions
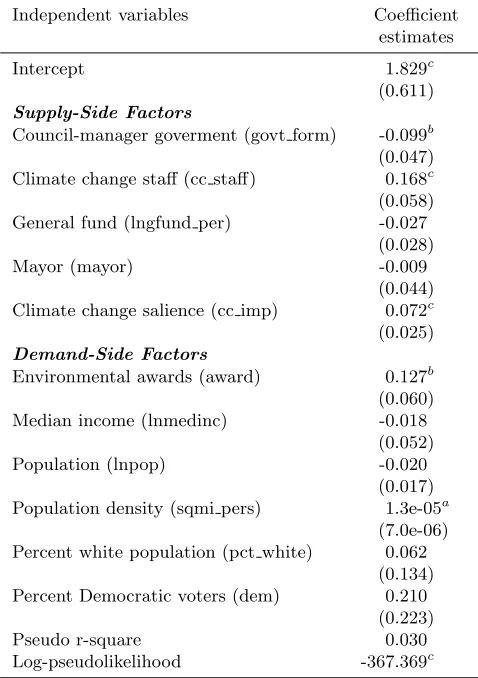
Table 4 reports descriptive statistics of the variables used in the Poisson estimation for the number of climate change actions taken. The estimation of Poisson re-gression model resulted in significant supply-side factors for the mayor-council government form, climate change
staff, and climate change salience (Tab. 5). Government form was negative and significant, suggesting that the mayor-council form contributes to the increase in the number of climate change actions taken. This also sug-gests that climate change actions taken during the last five years may be more likely aimed at community-wide measures rather than government operations. Bae and Feiock (2013) found that the mayor-council form of gov-ernment more likely addressed climate change policies at the community-at-large level and that the council-manager form tended to focus more on government op-erations. These so-called “strong mayors,” elected at large in the mayor-council system, may be more inter-ested in taking climate change actions to attract or re-tain political resources and electoral support in their community, as indicated by the positive and signifi-cant variable climate change salience. Having climate change staff increased the probability of increased cli-mate change actions, indicating a higher level of capacity and/or the punctuated emphasis of climate change pol-icy. The demand-side policy variables ofenvironmental awards andpopulation densityresulted in significant co-efficients. Support from environmental stakeholders and higher population density has been shown to be impor-tant to the number of climate change activities (Bae and Feiock 2013).
The pseudo R2 measure of 0.03 at first glance seems
Table 5: Poisson regression for number of climate change actions taken in respondent’s city (n=187)
Independent variables Coefficient
estimates
Intercept 1.829c
(0.611)
Supply-Side Factors
Council-manager goverment (govt form) -0.099b
(0.047)
Climate change staff (cc staff) 0.168c
(0.058)
General fund (lngfund per) -0.027
(0.028)
Mayor (mayor) -0.009
(0.044)
Climate change salience (cc imp) 0.072c
(0.025)
Demand-Side Factors
Environmental awards (award) 0.127b
(0.060)
Median income (lnmedinc) -0.018
(0.052)
Population (lnpop) -0.020
(0.017)
Population density (sqmi pers) 1.3e-05a
(7.0e-06) Percent white population (pct white) 0.062
(0.134)
Percent Democratic voters (dem) 0.210
(0.223)
Pseudo r-square 0.030
Log-pseudolikelihood -367.369c
Note: (a) 10% significant level; (b) %5 significance level; (c) 1%
significance level; robust standard errors are in parentheses.
the proportion of variation accounted for by the model as R2 does in OLS regression. We examined the model fit graphically and also obtained goodness-of-fit tests, one based on deviance residuals and one based on Pearson residuals. Both tests yielded probabilities greater than 0.05, suggesting that the predicted counts are insignif-icantly different from the observed ones, and therefore the Poisson model was a good fit.
3.3 Factors Contributing to Climate Change Adaptation
The probit model yielded and significant coefficient estimates for the following variables: government form, climate change salience, green infrastructure, and urban forests (Tab. 6). The coefficient estimate for government form was positive, different from in the previous model, suggesting that respondents with council-manager gov-ernments may be more likely to prioritize and pursue climate change adaptation strategies. Whether a
respon-Table 6: Probit regression for city officials’ motivations to prioritize adaptation as method to address climate change (n=168).
Independent variables Coef. Margin.
Esti- Effect at
mates Mean x
Intercept 1.792
(-0.839)
Supply-Side Factors
Council-manager government 0.470a 0.187
(govt form) (0.245)
Climate change staff (cc staff) -0.351 -0.121 (0.270)
General fund (lngfund) 0.125 0.056
(0.150)
Mayor (mayor) -0.300 -0.114
(0.224)
Climate change issue salience -0.381c -0.149
(cc imp) (0.146)
Urban forest plan (uf plan) 0.364 0.142
(0.315)
Action on green infrastructure 0.728c 0.269
(cc green) (0.270)
Importance of urban forests if 0.024 0.009
funding available (budg uf) (0.079) . Importance of urban forests in 0.300b 0.111
climate change strategies (0.224) (cc uf)
Demand-Side Factors
Environmental awards (award) -0.209 -0.063
(0.266)
Median income (lnmedinc) -0.404 -0.170
(0.292)
Population (lnpop) 0.128 0.053
(0.098)
Population density (sqmi pers) 4.1e-1 4.8e-6 (1.1e-0)
Percent white population 0.587 0.278
(pct white) (0.876)
Percent Democrat (dem) 0.409 0.192
(1.084)
Pseudo r-square 0.142
Log-pseudolikelihood -99.289c
Note: (a) 10% significant level; (b) %5 significance level; (c) 1%
significance level; standard errors are in parentheses.
im-portance a mayor assigns on addressing climate change issues, the more likely climate change adaptation is ad-dressed. This result supports the premise that the level of importance assigned to limit or reduce climate change has no bearing on the importance of addressing risks or vulnerabilities associated with climate change. The pro-bit model yielded no significant coefficients for the so-ciodemographic characteristics, which is consistent with Wang’s (2012) California study.
To assess the magnitude of the effects of the indepen-dent variables on the depenindepen-dent variable, examining ei-ther the conditional marginal effects for continuous vari-ables or the conditional discrete effects for the binary variables is necessary. The conditional marginal effects appear in Table 5. For the variablemayor, the marginal effect at the mean was 0.187. For two hypothetical may-ors with average values, the predicted probability of pri-oritizing adaptation would be 0.187 greater for a mayor of a city that has a council-manager government form than one that has a mayor-council government form.
3.4 Actions on Urban Forests
The majority of respondents (75 percent) indicated that urban forests should be part of climate change strategies and 87 percent of respondents stated that ur-ban forests were already part of city planning. In ad-dition, more than half of the respondents responded that there were plans for their city to increase urban forests within the next five years. Some respondents who did not plan on increasing forests said that they were located adjacent to forested public land, were al-ready quite forested alal-ready, had significant forest health issues with current forests, or already had been increas-ing forests for many years.
4
Discussion and Conclusion
Local government leaders are important to facilitate the implementation of climate change actions in forward-ing both the mitigation and adaptation agenda, where government form was an important variable, although differing depending on the agenda emphasized. This article suggests that the political market framework is useful to examining form of government and its effects on local policy decisions in climate change. It is easy to assume that increased vulnerability to climate change re-sults in increased support of mitigation measures; how-ever, this study shows that this is not the case. Although adaptation and mitigation are inexorably intertwined, drivers to act are different for each measure.
Costs related to climate protection require high level of investments, yet the amount of government budget available per capita was not a significant variable in ei-ther model, suggesting that motivations to pursue
cli-mate change activities may not be based on available resources and perhaps political willpower and commu-nity consensus instead. Although 47 percent of the re-spondents had a carbon inventory, only 20.8 percent of the respondents had taken some sort of action on carbon offset programs, suggesting funding constraints. How-ever, from those 20.8 percent, 60 percent were respon-dents in cities with council-manager forms of government and the balance had mayor-council governments. Pre-vious research showed that the presence of fiscal stress increased the likelihood of mayor-council cities joining climate change programs, but decreased the likelihood that the same cities would make progress on implement-ing the program (Sharp et al. 2011). This suggests that mayor-council governments are more likely to use cli-mate change programs and networks as symbolic policy. In model 1, the presence of a mayor-council govern-ment, the presence of climate change staff, increased population density, and environmental awards received increased the propensity for the number of climate change actions MCPA cities have taken. Competing sup-ply and demand forces seem to compel political respon-siveness in addressing climate change mitigation, partic-ularly for mayor-council governments. The results seem to support Lubell et al. (2009) conclusion that as may-oral power increases, increased socioeconomic status of the population shifts the balance of changes to be more pro-environment. The effect of environmental awards received also aligns with the belief that resources help-ing reelect the mayor are favored in the mayor-council government form (Feiock and Bae 2011). The results to model 1 are consistent with past studies, but in addi-tion, we also found that climate change issue salience, the level of importance a mayor assigns to addressing climate change, was an important factor.
would (Carr 2015). Furthermore, climate change adap-tation was selected as the top method to address cli-mate change by half of the respondents, notable because there is little evidence in literature showing that climate change adaptation at the urban level exists (Bulkeley and Tuts 2013). When we evaluated qualitative data provided by the respondents, we found that adaptation actions taken have included dealing with sea level rise and code requirements, protecting vulnerable green ar-eas, recycled water programs, and better tree care and planting.
Urban forests can be considered in approaches for both climate change mitigation and adaptation. Many of the respondents believed that urban forests should be included in climate change strategies and planned to in-crease urban forests over the next five years. Most cities already had some form of urban forest planning in place (87 percent) and integrating it into climate change con-siderations as well as coordinating with bordering mu-nicipalities and governments as well as state-level enti-ties is a logical next step. Urban forests ranked highest on the list when respondents were asked to rank envi-ronmental priorities according to preference, contingent on available funding. Large cities often receive more at-tention due to high visibility, leaving smaller cities to be neglected. However, there are many lessons learned from the larger cities. For instance, theMillionTreesNYC ini-tiative leveraged the engagement of thousands of vol-unteers from diverse communities to adequately plant and care for the trees (Fisher et al. 2015). However, the actual prioritization of urban forests was not signif-icant in predicting the increased motivation to address climate adaptation, but the past actions of increasing ur-ban forests and green infrastructure were. Many cities have long-standing urban forests programs, indicating maturity in such programs. Priorities may be placed on more innovative adaptation actions or needs not yet addressed.
Although the MCPA may not increase the number of local climate change actions, assessing their environmen-tal priorities would help guide national climate change policies. Transportation and electricity generation have been shown to be the sectors with the largest shares of greenhouse gas emissions (U.S. Environmental Pro-tection Agency 2015). The results of this study indi-cated that cities are pursuing actions to improve land use planning and energy efficiency of buildings, and address-ing electricity generation. Transportation improvements are last on the list of environmental priorities for cities, which is not surprising because addressing transporta-tion is more challenging and costly, requiring infrastruc-ture investments affecting both spatial and housing poli-cies and indirectly affecting other markets such as real estate.
Overall, this study shows that multiple and varied lo-cal actions to address climate change are being pursued by member MCPA cities. Examining local action pro-vides insight for understanding the political economy of climate change policy. The capacity for adaptation is highly variable and shaped by a range of social and physical attributes, making it difficult for a one-size-fits-all approach (Bulkeley and Tuts 2013), underscored by this study’s examination of one potential adaptation strategy: urban forests. Local governments have the possibility of reforming existing local policies and prac-tices such as urban forests and other green infrastructure to integrated adaptation to expected climate impacts as well as mitigating emissions. However, cities will need additional scientific assessments on how climate change will impact people, urban settlements, and local infrastructure. Funding will need to come from national governments to stimulate meaningful adaptation across urban regions with particular attention to small- and medium-sized cities. The international climate change regime does not acknowledge the role of cities tackling climate change, even though they are vulnerable settle-ments and important emitters at the same time (Drey-fus 2013). However, because of climate change risks, cities have been taking action on climate change adap-tation rather than wait for national government response (Hughes et al. 2013). Since the signatories of the MCPA represent the most heavily populated states as well as the majority of the state capitals, international and fed-eral policymakers may choose to seriously consider the role these mayors have in tackling climate change. The mayors of these cities (or their representatives) not only think that it is important to address climate change is-sues, but also think that local governments should have more of a role in national climate change policy design.
Acknowledgements
We are grateful to three anonymous reviewers for their valuable comments helping in improvement of the manuscript.
References
Bae, J., & Feiock, R. 2013. Forms of government and climate change policies in U.S. cities. Urban Studies, 50(3), 776–788.
Benedict, M. A., & McMahon, E. T. 2006. Green in-frastructure: smart conservation for the 21st century.
Washington, DC: Sprawl Watch Clearinghouse.
Bulkeley, H. 2010. Cities and the governing of cli-mate change.Annual Review of Environment and Re-sources, 35, 229–253.
Bulkeley, H., & Tuts, R. 2013. Understanding urban vul-nerability, adaptation and resilience in the context of climate change.Local Environment, 18(5), 646–662.
Carmin, J., Nadkarni, N., & Rhie, C. 2012.Progress and challenges in urban climate adaptation planning: Re-sults of a global survey. Cambridge, MA: MIT. 30pp.
Carr, J. B. 2015. What have we learned about the per-formance of council-manager government? A review and synthesis of research. Public Administration Re-view, 75(4), 673–689.
Clingermayer, J. C., & Feiock. R. C. 1993. Constituen-cies, campaign support, and council member interven-tion in city development policy.Social Science Quar-terly, 74(1), 199–215.
Congressional Budget Office. 2003.The economics of cli-mate change: A primer. Washington, DC: The United States Congress Congressional Budget Office.
Congressional Quarterly Voting and Elections Collec-tion [Electronic Resource]. 2003. Washington, DC: CQ Press. University of Georgia Catalog. Web. 24 April 2015.
Cottrell, S. P. 2003. Influence of sociodemographics and environmental attitudes on general responsible envi-ronmental behavior among recreational boaters. En-vironment and Behavior, 35(3), 347–375.
Dreyfus, M. 2013. Are cities a relevant scale of action to tackle climate change? Carbon & Climate Law, 7(3), 283–292.
Feiock, R. C., Lubell, M., & Lee, I. W. 2010. The po-litical market framework and policy change. Working paper, Local Governance Research Lab Florida State University. https://localgov.fsu.edu/publication files/essays/Politcal Market Policy Change 2010 5 16 -ML.pdf [accessed July 11, 2016].
Feiock, R. C., & Bae, J. 2011. Politics, institutions and entrepreneurship: City decisions leading to invento-ried GHG emissions.Carbon Management, 2(3), 443– 453.
Feiock, R. C., & Coutts, C. 2013. Guest editors introduc-tion: governing the sustainable city.Cityscape, 15(1), 1–7.
Feiock, R. C., & West, J. P. 1993. Testing compet-ing explanations for policy adoption: Municipal solid
waste recycling programs. Political Research Quar-terly, 46(2), 399–419.
Fisher, D. R., Svedsen, E. S., & Connolly, J. 2015.Urban environmental stewardship and civic engagement: how planting trees strengthens the roots of democracy. New York, NY: Routledge. 132pp.
Gill, S. E., Handley, J. F., Ennos, A. R., & Pauleit, S. 2007. Adapting cities for climate change: The role of green infrastructure.Built Environment, 33(1), 115–133.
Granovetter, M. 1985. Economic action and social struc-ture: The problem of embeddedness.American Jour-nal of Sociology, 91(3), 481–510.
Hakelberg, L. 2014. Governance by diffusion: Transna-tional municipal networks and the spread of local cli-mate strategies in Europe.Global Environmental Pol-itics, 14(1), 107–129.
Hallegatte, S., & Corfee-Morlot, J. 2011. Understand-ing climate change impacts, vulnerability and adapta-tion at city scale: an introducadapta-tion.Climatic Change, 104(1), 1–12.
Heinzl, H., & Mittlb¨ock, M. 2003. Pseudo R-squared measures for Poisson regression models with over-or underdispersion. Computational Statistics & Data Analysis, 44(1–2), 253–271.
Hughes, S., Pincetl, S., & Boone, C. 2013. Triple ex-posure: Regulatory, climatic, and political drivers of water management changes in the city of Los Angeles.
Cities, 32, 51–59.
Jabareen, Y. 2013. Planning the resilient city: Concepts and strategies for coping with climate change and en-vironmental risk.Cities, 31, 220–229.
Kalof, L., Dietz, T., Guagnana, G., & Stern, P. C. 2002. Race, gender and environmentalism: The atypical val-ues and beliefs of white men. Race, Gender & Class, 9(2), 112–130.
King, G. 1988. Statistical models for political science event counts: Bias in conventional procedures and ev-idence for the exponential Poisson regression model.
American Journal of Political Science, 32(3), 838–863.
Krause, R. M. 2010. Policy Innovation, intergovernmen-tal relations, and the adoption of climate protection initiatives by U.S. cities. Journal of Urban Affairs, 33(1), 45–60.
protection. Environment and Planning C: Govern-ment and Policy, 29(1), 46–62.
Krause, R. M. 2012. An assessment of the impact that participation in local climate networks has on cities’ implementation of climate, energy, and transportation policies.Review of Policy Research, 29(4), 585–604.
Kwon, M., Jang, H. S., & Feiock, R. C. 2014. Climate protection and energy sustainability policy in Califor-nia cities: what have we learned? Journal of Urban Affairs, 36(4), 905–924.
Lee, T. & Koski, C. 2015. Multilevel governance and urban climate change mitigation. Environment and Planning C: Government and Policy, 33(5): 1501– 1517.
Lee, T., & Koski, C. 2012. Building green: Local polit-ical leadership addressing climate change. Review of Policy Research, 29(4), 605–624.
Lubell, M., Feiock, R. C., & Ramirez de la Cruz, E. 2009. Local institutions and the politics of urban growth.
American Journal of Political Science, 53(3): 649– 665.
Lubell, M., Feiock, R. C., & Ramirez, E. 2005. Political institutions and conservation by local governments.
Urban Affairs Review, 40(5), 706–729.
Lynn, B. H., Carlson, T. N., Rosenzweig, C., Goldberg, R., Druyan, L., Cox, J., Gaffin, S., Parshall, L., & Civerolo, K. 2009. A modification to the NOAH LSM to simulate heat mitigation strategies in the New York City metropolitan area.Journal of Applied Meteorol-ogy & ClimatolMeteorol-ogy, 48(2), 199–216.
Manning, W. J. 2008. Plants in urban ecosystems: Es-sential role of urban forests in urban metabolism and succession toward sustainability. International Jour-nal of Sustainable Development and World Ecology, 15(3), 370.
McPherson, E. G., Xiao, Q., & Aguaron, E. 2013. A new approach to quantify and map carbon stored, sequestered and emissions avoided by urban forests.
Landscape and Urban Planning, 120, 70–84.
Poudyal, N. C., Siry, J. C., & Bowker, J. M. 2010. Urban forests’ potential to supply marketable carbon emis-sion offsets: A survey of municipal governments in the United States. Forest Policy and Economics, 12(5), 432–438.
Roy, S., Byrne, J., & Pickering, C. 2012. A systematic quantitative review of urban tree benefits, costs, and assessment methods across cities in different climatic
zones.Urban Forestry & Urban Greening,11(3), 351– 363.
Satterthwaite, D. 2008. Cities’ contribution to global warming: notes on the allocation of greenhouse gas emissions. Environment and Urbanization, 20, 539– 549.
Sharp, E. B., Daley, D. M., & Lynch, M. S. 2011. Un-derstanding local adoption and implementation of cli-mate change mitigation policy.Urban Affairs Review, 47(3), 433–457.
Stern, N. 2006.Stern review on the economics of climate change. Her Majesty’s Treasury. London, UK. 712pp.
Stone, B. 2012a.The city and the coming climate: Cli-mate change in the places we live. New York, NY: Cambridge University Press. 187pp.
Stone, B. 2012b. Managing climate change in cities: Will climate action plans work? Landscape and Urban Planning, 107(3), 263–271.
Stone, B., Vargo, J., Peng, L., Yongtao, H., & Russell, A. 2013. Climate change adaptation through urban heat management in Atlanta, Georgia.Environmental Science & Technology, 47(14), 7780–7786.
Thomas, K., & Geller, L. 2013. Urban forestry: toward an ecosystem services research agenda: a workshop summary. Washington, DC: National Academy Press. 65pp.
Tiebout, C. M. 1956. A pure theory of local expendi-tures.Journal of Political Economy, 64(4), 416–424.
United Nations Habitat. 2011. Global report on human settlements: Cities and climate change. United Na-tions Habitat Settlements Programme. Washington, DC: Earthscan. 250pp.
U.S. Council of Mayors. 2007.Survey on mayoral lead-ership on climate protection. Washington, DC: United States Conference of Mayors.
U.S. Council of Mayors. 2008.The impact of gas prices, economic conditions, and resource constraints and cli-mate protection strategies in U.S. cities. Washington, DC: United States Conference of Mayors.
U.S. Council of Mayors. 2014. Climate mitigation and adaptation actions in America’s cities. Washington, DC: United States Conference of Mayors. 12pp.
Van Goor, H., & Stuiver, B. 1998. Can weighting com-pensate for nonresponse bias in a dependent variable? An evaluation of weighting methods to correct for sub-stantive bias in a mail survey among Dutch munici-palities.Social Science Research, 27(3), 481–499.
Walton, Z. L., Poudyal, N. C., Hepinstall-Cymerman, J., Johnson-Gaither, C., & Boley, B. B. 2016. Explor-ing the role of forest resources in reducExplor-ing community vulnerability to heat effects of climate change.Forest Policy and Economics, 71, 94–102.
Wang, R. 2012. Adopting local climate policies: What have California cities done and why? Urban Affairs Review, 49(3), 593–613.
Wooldridge, J. M. 2010.Econometric Analysis of Cross Second and Panel Data(2nded.). Cambridge and Lon-don: MIT Press. 1062 pp.
Zahran, S., Grover, H., Brody S. D., & Vedlitz, A. 2008. Risk, stress, and capacity: Explaining metropolitan commitment to climate protection.Urban Affairs Re-view, 43(3), 447–474.
Zhou, Y., & Shepherd, J. M. 2009. Atlanta’s urban heat island under extreme heat conditions and potential mitigation strategies. Natural Hazards, 52(3), 639– 668.