Spectra-based sentiment analysis
ALEXANDREBARBOSA DELIMA1
MARCOSR. PEREIRABARRETO2
JOSÉROBERTO DEALMEIDAAMAZONAS3
Faculty of Sciences and Technology, Pontifical Catholic University of São Paulo
Mechatronics and Mechanical Systems Department, School of Engineering, University of São Paulo Telecommunications and Control Engineering Department, School of Engineering, University of São Paulo
Department of Computer Architecture, Universitat Politècnica de Catalunya 1
[email protected],[email protected]
Abstract. This paper introduces a method to identify the emotions conveyed by voice signals based on spectral analysis. The adopted tool is the periodogram associated to the measurement of the cumulative energy. It is shown that the variation of the emotional state produces a shift of the spectrum that can be taken as a emotional blueprint of the speaker and can be used to track his/her mood along the time.
Keywords:sentimental analysis, spectral analysis, periodogram, machine learning
(Received October 5th, 2018 / Accepted November 5st, 2018)
1 Introduction
1.1 Definition of sentiment analysis
Sentiment analysis demands a reference model for emo-tions. In other words: which are the emotions? Many models have been proposed; they can be divided basi-cally into two categories: dimensional models and dis-crete models. Dimensional models search for the iden-tification of the dimensions which defines emotions, as an analogy to position which can be defined in the Cartesian plane. Willhelm Max Wundt, recognized as the father of psychology, was the first to propose a3 -dimensions model in 1897 [4]. Most dimensional mod-els are2−or3−dimensional. Dimensional models with physiologic correlation have also been proposed, such as [5]. Discrete models, by they turn, search for the identification of emotions by enumeration. A funda-mental debate, in this field, is the existence of an innate set of emotions, which would be cross-culturally rec-ognizable. Paul Ekman model of the “Big Six” (hap-piness, sadness, fear, anger, disgust, surprise) is, per-haps, the most acknowledged result in this line [6]. The
Ortony/CLore/Collins OCC Model is also a fundamen-tal reference in this field, by defining twenty two (22) categories of emotions depending on the events, agents or objects in the environment [11].
1.2 Detection of emotion in voice signals as part of sentiment analysis
Emotion are conveyed in voice, gestures, semantic meaning and personal experiences. They are an integral part of human communication. Therefore, to build “in-telligent computers” or even “sociable robots” [1], it is mandatory to give them the ability to recognize, under-stand and (perhaps) express emotions. This idea came from the seminal work of Rosalind Picard, defining the expression “affective computing” [14].
recognition being more frequent. But emotion recog-nition in speech is more and more relevant nowadays, with smart assistants such as Alexa and Siri being a trending topic.
1.3 State of art and trends in detection of emotion in voice signals
Most works on speech emotion recognition follow the same basic experimental procedure: a number of phys-ical features is extracted from voice signal and an Arti-ficial Intelligence algorithm is used to identify the con-veyed emotion. The number of physical features varies from 100s to 1000s [17]. They include features directly extracted and transforms such as Mel Frequency Cep-stral Coefficients (MFCC). Features are frequency- and intensity-related. The features are fed into a classifier, using algorithms such as Artificial Neural Networks (ANN), Support Vector Machines (SVM), k Nearest Neighbors (kNN), Gaussian Mixture Model (GMM) and others [13], [9], [8], [18]. Each paper analyses dif-ferent things, such as best algorithm, best feature set, intercultural differences, etc.
1.4 Contribution of the paper
This paper takes a step back into this process, to deeper analyse the dynamic characteristics of voice signals in presence of emotions. It has been motivated by search-ing for a justification for some well-known rules in Pho-netics, such as those in [15], stating some acoustic pat-terns of basic emotions, such as intensity, mean f01, f0variability,f0range, high frequency energy. For in-stance, it´s known that joy makesf0to increase whilst decreases in sadness. If a small set of feature character-izes emotion in speech, why do we have to use 100s or 1000s of features to identify emotions? Factorial exper-iments do not allow to reduce this quantity [17]. There-fore, a deeper reflection seems to be advisable.
The search is for an algorithm easy to implement, with a small set of features that can be computed in real time, considering the different timescales of speech, which are very distinct from facial or gesture. Perhaps,
1A continuous time signalx(t)with finite energy and duration
T0, where T1
0 =f0is the fundamental frequency (or fundamental
harmonic) ofx(t), can be reconstructed using the Fourier Series [7]
x(t) =C0+
∞
X
k=1
Ckcos (k2πf0t+θk)
t1 ≤ t≤t1+T0, k = 0,±1,±2, . . ., where the amplitudeCk
versuskf0defines anamplitude spectrum, the phaseθkversuskf0
is thephase spectrum, and the|Ck|2versuskf0is thepower
spec-trum. These plots together are the frequency spectra ofx(t).
this search leads to a small set of features, amenable to fed into a machine learning algorithm.
1.5 Organization of the paper
This paper is organized in three sections, besides this. Section 2 discusses spectral analysis of random signals, with emphasis on periodogram and Daniell method, as periodograms were used as the main tool for sentiment analysis. Section 3 presents experiments conducted on the use of periodograms in sentiment analysis. Finally, Section 4 presents our conclusion and directions for fu-ture works.
2 Spectral Anaysis of Random Signals 2.1 The Notion of Time Series
Spectral analysis is part of time series analysis [12]. Therefore, we must first introduce the notion of time series.
Figure 1 presents and example of a time series. Roughly speaking, a time series consists in a set of numbers corresponding to the observation of a certain phenomenon. By nature, such numbers are random variables. This figure shows the speech signal corre-sponding to the vocalization ofaaa...hhh. It is easy to observe a periodic behavior and a decrease of the power as the time increases [3].
AAAhhh
Time
Speech signal
0 200 400 600 800 1000
0
1000
2000
3000
4000
Figure 1:Speech signal: aaa...hhh. Source: [3]
2.2 Discrete Fourier Transform
Spectral analysis is a well-established research area. It continues to be a very useful tool in many areas of phys-ical sciences such as oceanography, engineering, geo-physics, astronomy and hydrology [12]. However, the
estimation of the power spectrum of a signal is not a trivial matter. There are two classes of spectral analy-sis techniques currently in use: parametric (or model-based) and nonparametric analysis.
The fundamental idea of parametric spectral analy-sis is fairly simple. The parametric approach assumes that the signal satisfies a generating model with known functional form and then proceed by estimating the pa-rameters in the assumed model [16]. In this way, the parametric approach introduces the additional problem of model identification, and it is for this reason that we opt for the alternative technique, since the nonparamet-ric approach (the one adopted in this article) is very use-ful for the purpose of this work (i. e., the search for an algorithm easy to implement, with a small set of fea-tures that can be computed in real time).
LetT be an arbitrary set. A stochastic process is a family {xt, t ∈ T}, such that, for eacht ∈ T,xtis
a random variable [10]. When the set T is the set of integer numbersZ, then{xt}is a discrete time
stochas-tic process (or random sequence);{xt}is a continuous time stochastic process ifT is taken as the set of real numbers R. Then, the estimation of the Power
Spec-tral Density (PSD) of a random sequence{xt} can be made using periodogram methods based on the Discrete Fourier Transform (DFT), which can be efficiently cal-culated by an Fast Fourier Transform (FFT) Algorithm. In the sequence we present the periodogram method used in this paper.
2.3 Power Spectral Density of Random Sequences
Consider a random sequence {xt} with N values or
samples, i. e., xt = 0outside the time interval 0 ≤
t≤N−1. In some cases of interest, we consider that
{xt}has a sizeN, even if its actual size isM ≤N (in such cases the sequence{xt}must be completed with
(N−M)zeros (zero padding). The equation (1) is the DFT of{xt}:
X[k] =
N−1
P
t=0
xte−j2π
k
Nt, 0≤k≤N−1
0, otherwise
(1)
2.4 The Periodogram
The PSD of {xt} can be estimated by calculating the periodogram, given by
Px(fk) =|X[k]| 2
N
whereX[k]denotes the DFT of{xt}, and
fk = 0,
1 N , . . . , k N , . . . ,
N−1
N
The periodogram is an asymptotically unbiased spectral estimator of the PSD of a random signal [16]. Its main problem lies in its large variance. In other words, the periodogram is inconsistent (i. e., the dis-persion of the estimates is independent of N). This motivates the a “refined periodogram method”, like the Daniell method.
2.5 Daniell Method
It is possible to show that the periodogram values Px(fk) are asymptotically uncorrelated random vari-ables [12]. Thus we may reduce its large variance by weight averaging the periodogram over small intervals centered on the current frequency fk. The practical
form of the Daniell estimate can be performed using the FFT. The Daniell kernel used in this worked is given in Section 3.2. For further details, please refer to [16], [12].
3 Results
In this section the simulation environment, the scenario setup and the simulations results are presented.
3.1 The simulation environment and scenario setup
All the results were obtained using the R-software that is a free software environment for statistical comput-ing and graphics. It compiles and runs on a wide va-riety of UNIX platforms, Windows and MacOS. It can
be downloaded fromhttps://www.r-project.
org.
The simulation scenario is made of voice samples obtained from 22 different speakers, 50% women and 50% men. Each speaker produced 4 samples corre-sponding to different emotional states, namely: i) sad; ii) neutral; iii) happy and iv) angry. The emotional states were provoked by the texts offered to them to read. In this experiment, there was no means to check the real emotional state of the speaker and this may ac-count for some discrepancies of the results, however this does not jeopardize neither the method nor the ob-tained results. All the voice samples were padded with zeros to have the same length ofn = 524,288 = 219 points. For a sample rate of 8 kHz, this number of points corresponds to a 65.54 s long signals(t). All samples were normalized to have unitary energy, i.e., Pn
i = 1s(t)
3.2 Simulation results
The first step of the analysis consisted in obtaining an estimation of the signals’ power spectral density. This was done by evaluating the periodogram using a Daniell’s window with weights{hk} ={41,24,14}and
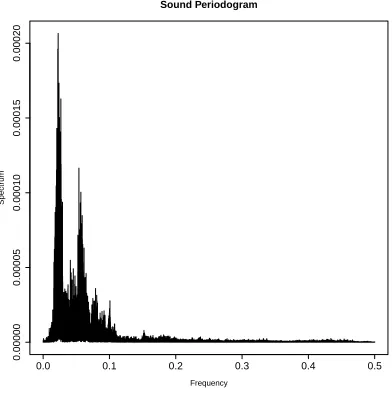
a taper of 10%. Figure 2 shows a typical result. In this case the speaker is Allan and the emotion ishappy.
0.0 0.1 0.2 0.3 0.4 0.5
0.00000
0.00005
0.00010
0.00015
0.00020
Sound Periodogram
Frequency
Spectr
um
Figure 2:A typical periodogram: speaker - Allan; emotion - happy.
Figure 3 shows the periodograms for the four emo-tions of a typical speaker. Not surprisingly, it can be clearly seen that the power spectral density of the voice is affected by the emotional state. In fact, this result corroborates the common knowledge that when a per-son ishappyorangryhe or she tends to produce more higher frequency tones, while in thesadmood he or she tends to produce more lower frequency tones.
This result also suggests that the detection of the power spectral density shift may be a useful tool to identify the emotional state of a speaker.
Figure 3:Periodograms for the four emotions of a typical speaker.
A convenient way to detect the power spectral den-sity shift is by means of the cumulative energy given by Cum_En(k) =Pk
i = 1P SD(k), whereP SD(k)is the
power spectral density at the normalized frequencyk. Figure 4 shows the cumulative energy for the four emo-tional states of a typical speaker. This figure clearly shows the spectral shift and each emotional state is characterized by a distinctive curve.
Figure 4:The cumulative energy of Allan’s periodograms.
Figure 5 shows the cumulative energy of four speak-ers. In all cases we can realize that there is a spectral shift due to the variation of the emotional state. How-ever, this shift is not exactly the same for all speakers.
Figure 5:The cumulative energy of four speakers periodograms.
In Figures ?? and 5 the horizontal dotted black lines correspond to specific levels of the
cumulative energy, namely, Cum_En(k) =
{0.60,0.65,0.70,0.75,0.80,0.85,0.90}. The measure-ment of the frequency at which each of these energy levels is reached constitutes the basis of the emotional state identification method outlined in Section 3.3.
3.3 Interpretation and discussion
Conceptually, the results shown in Figure 5 can be rep-resented as illustrated in Figure 6. In this figure the horizontal axis representsCum_En(k)and the vertical axis represents the normalized frequency. Each color represents an emotional state, and each star indicates the frequency at the specific cumulative energy level for the corresponding emotional state.
Figure 6:The emotional blueprints energy of four speakers.
This representation is designated as the emotional blueprint of the speakerbecause it can be assumed as
a personal emotional identification of the speaker. For example, Lucas (bottom right figure) always remains in the same frequency curve whatever the cumulative energy is. When in the neutral mood the frequency curve is the lowest one and when in theangry mood the frequency curve is the highest. Amanda (top left), on the other hand, when in theneutralmood the fre-quency curve is the second lowest, as the energy level increase the frequency shifts to a lower level, but above Cum_En(k) = 0.6 the frequency shifts back to the second lowest value.
These results suggest that spectra-based sentiment analysis can be implemented. Let’s assume a stress-ful working environment as, for example, help desks or telemarketing, where the operators are under different stimuli for many hours. It may be important to detect the operator’s emotional state to protect him/her from a psychological breakdown. Periodically, voice sam-ples could be collected, the frequency reached for dif-ferent cumulative energy levels evaluated and compared to the operator’s blueprint enabling the identification of his/her emotional state. Alternatively, the measurement of the frequency could be made always at the same cu-mulative energy level and the observed shifts would in-dicate the variation of the emotional state.
4 Conclusions and Future Work
In this paper we have conceptually shown the possi-bility of identifying emotional states by means of the spectral analysis of voice signals. The outlined method, based on the cumulative energy of the power spectral density is quite parsimonious in terms of number of voice parameters to consider. We do not claim that the alternative presented in this paper is the most ad-equate as further and deeper research and comparisons are needed. However, it is clear that spectra-based anal-ysis is a very promising path to be followed.
In future work we intend to:
• perform dynamic Fourier analysis and use wavelets transforms;
• introduce the measurement of energy as an addi-tional tool to identify the emoaddi-tional state;
• use the results of spectral analysis as input to ma-chine and deep learning algorithms.
References
[2] Datcu, D. and Rothkrantz, L. Semantic Audio-Visual Data Fusion for Automatic Emotion Recognition.EUROMEDIA, 2008.
[3] de Lima, A. B. and de Almeida Amazonas, J. R.Internet Teletraffic Modeling and Estimation. Gistrup: Rivers Publishers, 2013.
[4] Eerola, T. and Vuoskoski, J. K. The production and recognition of emotions in speech: features and algorithms.Psychology of Music, Vol. 39:18– 41, 2011.
[5] Eerola, T. and Vuoskoski, J. K. A new three-dimensional model for emotions and monoamine neurotransmitters. Medical Hypotheses, Vol. 78:341–348, 2012.
[6] Ekman, P. An argument for basic emotions. Cog-nition and Emotion, Vol. 6:169–200, 1992.
[7] Fourier, J. Mémoire sur la propagation de la chaleur dans les corps solides. In Présenté le 21 décembre 1807 à l’Institut national - Nouveau Bulletin des sciences par la Société philomatique de Paris, t. I, p. 112-116, n. 6. march 1808.
[8] Kanchandani, K. B. and Hussain, M. A. Emotion recognition using multilayer perceptron and gen-eralized feed forward neural network. Journal of Scientific and Industrial Research, Vol. 68:367– 371, 2009.
[9] Kim, S., Georgiou, P. G., Lee, S., and Narayanan, S. Real time emotion detection system using speech: multimodal fusion of different timescale features. InIEEE Workshop on Multimedia Sig-nal Processing. 2007.
[10] Morettin, P. A. Econometria Financeira. Associ-ação Brasileira de Estatística, 2006.
[11] Ortony, A., Clore, G. L., and Collins, A.The Cog-nitive Structure of Emotions. Cambridge Univer-sity Press, 1990.
[12] Percival, D. B. and Walden, A. T. Spectral Anal-ysis for Physical Applications: Multitaper and Conventional Univariate Techniques. Cambridge University Press, 1993.
[13] Petrushin, V. A. Emotion recognition in speech signal: experimental study, development and ap-plication. InProceedings of the Internation Con-ference on Spoken Language Processing. 2008.
[14] Picard, R.Affective Computing. MIT Press, 1997.
[15] Scherer, K. R. Vocal communication of emotion: a review of research paradigm.Speech Communi-cation, Vol. 40:227–256, 2003.
[16] Stoica, P. and Moses, R.Spectral Analysis of Sig-nals. Pearson Prentice Hall, 2005.
[17] Vogt, T. and Andre, E. Comparing feature sets for acted and spontaneous speech in view of auto-matic emotion recognition. InIEEE Int. Conf. on Multimedia. Netherlands, 2005.
[18] Vogt, T., Andre, E., and Bee, N. Emovoice-a frEmovoice-amework for online recognition of emotions from voice. Perception in Multimodal Dialogue Systems, 2008.
![Figure 1: Speech signal: aaa...hhh. Source: [3]](https://thumb-us.123doks.com/thumbv2/123dok_us/8363672.1672552/2.596.313.509.481.637/figure-speech-signal-aaa-hhh-source.webp)