An Intelligent Model to Predict Breaking Strength of Rotor
Spun Yarns Using Gene Expression Programming
Abdolrasool Moghassem, Ph.D.1, Alireza Fallahpour2, Mohsen Shanbeh3
1
Department of Textile Engineering, Qaemshahr Branch, Islamic Azad University, Qaemshahr, IRAN
2
Department of Management, Firoozkooh Branch, Islamic Azad University, Firoozkooh, IRAN
3
Department of Textile Engineering, Isfahan University of Technology, Isfahan, IRAN
Correspondence to:
Abdolrasool Moghassem email: [email protected] ABSTRACT
Exploring relationships between characteristics of a yarn and influencing factors is momentous subject to optimize the selection of the variables. Different modelling methodologies have been used to predict spun yarn properties. Developing a prediction approach with higher degree of precision is a subject that has received attention by the researchers. In the last decade, Artificial Neural Network (ANN) has been developed successfully for textile nonlinear processes. In spite of the precision, ANN is a black box and does not indicate inter-relationship between input and output parameters. Hence, Gene Expression Programming (GEP) is presented here as an intelligent algorithm to predict breaking strength of rotor spun yarns based on draw frame parameters as one of the most important stages in spinning line. Forty eight samples were produced and different models were evaluated. Prediction performance of the GEP was compared with that of ANN using Mean Square Error (MSE) and correlation coefficient (R2 -Value) parameters on test data. The results showed a better capability of the GEP model in comparison to the ANN model. The R2-value and MSE were 97% and 0.071 respectively which means desirable predictive power of GEP algorithm. Finally, an equation was extracted to predict breaking strength of the yarns with a high degree of accuracy using GEP algorithm.
Keywords: Rotor spun yarn – Gene expression programming – Artificial neural network – Draw frame – Production speed – Break draft – Breaking strength.
INTRODUCTION
Breaking strength of a yarn is an important quality parameter that affects determination of its application possibilities [1]. This property is related to raw materials factors, process variables, machine
parameters and machine parts selection [2]. A survey of the literature reveals that, there has been a great deal of research done on roller drafting of staple fiber assemblies such as sliver[2]. The purpose of the draw frame is to attenuate the sliver to the desired linear density. It also reduces irregularity by the process of doubling [3]. Drafting quality affects fiber arrangement, fiber parallelization and fiber distribution in a sliver. The effect of the drafting quality may transmit up to the fibrous assembly in spun yarn, affecting its structure and properties consecutively [2].
Drafting quality is governed by process variables such as break draft, roller setting, delivery speed and top arm pressure. There is a high degree of interaction between these variables and quality of the product in this step [4-6]. The complexity of a fiber-to-yarn process is very high and models that consider all the variables are not available for such kind of the problems [7].
A model can be defined as the group of expressions that determines the relationship between the elements in order to examine the behavior of a system under changing conditions, to control it, and to make assumptions about the future [8].
Statistical models were the first that used in textile disciplines to explore relationships between variables and characteristics of product and to optimize processing parameters [9]. The prediction ability of regression analysis may be limited for highly non-linear problems [10].
inputs and outputs without understanding any physical information about the process [11, 12]. On the other hand, it is not easy to relate inputs of ANN with its outputs in an analytical equation form.
A new soft computing approach from the family of evolutionary programming that is known as Gene Expression Programming (GEP) (Ferreira, 2001) is also a promising candidate for complex prediction problems. GEP is able to provide prediction equations without requiring a cast equation as in the case of regression analysis [10, 13].
This paper makes an attempt by using GEP for predicting breaking strength of rotor spun yarns based on the draw frame variables of break draft, production speed, and distance between back and middle rolls.
A BRIEF OVERVIEW OF ARTIFICIAL NEURAL NETWORKS
An artificial neural network is an information-processing system that has certain performance characteristics in common with biological neural networks. This technique is useful when there are a large number of effective factors on the specific process [12, 14].
A neural network consists of a large number of simple processing elements called neurons, units, cells, nodes. Each neuron receives connections from other neurons and/or itself, each with an associated weight. The interconnectivity defines the topology of the ANN. The weights represent information being used by the neural network model to solve a problem. One of the central issues in neural network design is to utilize systematic procedures (a training algorithm) to modify the weights directly from the training data without any assumptions about the data's statistical distribution [14, 15].
There are different kinds of topologies and training algorithms but the feed forward neural network with back-propagation learning algorithms is more popular. In this structure, the neurons are located in layers and from one layer to another one connected with each other with links to carry the signals between them. There is a weight for each connection link which acts as a multiplication factor to the transmitted signal. An activation function such as linear or sigmoid. is applied to each neuron’s input to determine the output signal. Usually a feed forward neural network consists of several layers of nodes,
The training of a neural network by back-propagation involves three stages: the feed-forward of the input training pattern, the calculation and back-propagation of the associated error, and the adjustment of the weights [14]. The calculation of error vector to adjust the weights is done according to the calculated mean square error (MSE) form the difference between actual and predicted outputs according to the following relationship. NP y t MSE p j N i ij ij
0 0
) (
(1)
Where tij and yijare the target output and predicted
output respectively for ith training pattern at jth output neuron. Pis the total number of output neurons and Nindicates the number of training patterns.
In the backward pass, this error signal is propagated backwards to the neural network and the synaptic weights are adjusted in such a manner that the error signal decreases with each iteration process. Thus, the neural network model approaches closer and closer to producing the desired output. The corrections necessary in the synaptic weights are carried out by a delta rule, which is expressed by the following equation. ] / ) ( [ ( ) )
(n jin
ji MSE W
W
(2)
Where Wjinis the weight connecting the
neuronsjand iat the n th iteration;Wji(n), the correction applied to Wji(n)at the nth iteration; and , a constant known as learning rate [16, 17].
A BRIEF OVERVIEW OF GENE EXPRSSION PROGRAMMMING (GEP)
Genetic algorithm (GA) (Goldberg, 1989) is another component of soft computing methods. This method has different domains of applications in various engineering fields [26]. Nonetheless, offshoots of GA, namely, gene expression programming (Ferreira, 2001), a natural development of Genetic algorithm (GA), and Genetic programming (GP) have not received attention by the researchers.
Similarly to GA, GP needs only the problem to be defined. Then the program searches for a solution in a problem-independent manner. The process begins with the random generation of the chromosomes of each of the initial population. Then the chromosomes are expressed and the fitness of each individual is assessed. The individuals are then selected on the basis of fitness to reproduce with modification, leaving progeny with new train. The individuals of the new generation are subjected to the same developmental process until a solution has been found.
GEP is a genetic algorithm that consists of mainly five components; the function set, terminal set, fitness function, control parameters and stop condition. In GEP, the individuals are encoded as linear strings of fixed length (the genome or chromosomes) which are afterwards expressed as non-linear entities of different sizes and shapes (simple diagram representations or expression trees (ET)). A chromosome might be modified by one or several operators at a time or not be modified at all. The advantages of GEP are: first, the chromosomes are simple entities: linear, compact, relatively small, easy to genetically manipulate (replicate, mutate, recombine, transpose) and second, the expression trees are exclusively the expression of the respective chromosomes.
GEP genes are composed of a head and a tail. The head contains symbols that represent both functions and terminals, whereas the tail contains only terminals. For each problem, the length of the head is chosen, whereas the length of the tail is a function of
the length of the head and the number of arguments of the function with more arguments.
A typical GEP gene with the given function and terminal sets can be Eq. (3).
2 . . . . . . . . . . * . . . *
. Sqrt c a d c Sqrt d e
(3)
Where ‘.’ is used to separate elements for easy reading, Sqrt is the square-root function; 2 is a constant and a, b, c, d are variable names. The above-mentioned equation is known as Karva or K-expression. For a detailed explanation of GEP, refer to reference No 27.
MATERIALS AND METHODS
Sample Yarn Production and Experiment
The data used in the GEP and ANN models were collected from 48 rotor spun yarn samples. Cotton fiber with 27 mm mean fiber length, 3.6 micronaire fineness and 0.85 fiber maturity index were furnished as a second draw frame sliver with linear density of 5.2 ktex. The 30Ne yarn was spun on a Rieter RU04 rotor spinning machine with 900 tpm. The opening roller speed was 8200 t.min-1. The 35mm diameter rotor worked at a speed of 75000 t.min-1.
TABLE I. Specifications of the cotton rotor-spun-yarn samples.
TABLE II. Quality parameters of the sample yarns.
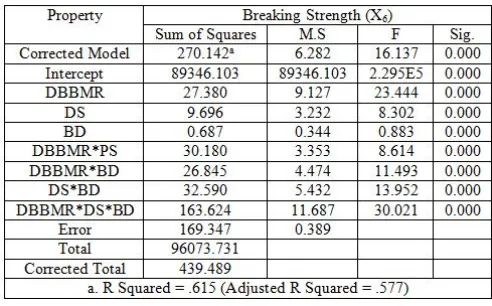
A one-way ANOVA test was applied to determine the effect of the parameters on the breaking strength of rotor spun yarns. Average breaking strength values (Table II) were compared at the 5% significance level and grouped according to the Duncan Multiple Range Test. Results of the Univariate analysis are summarized in Table III. Duncan Multiple Range Test results cannot be shown due to space limitation. Statistical analysis confirmed that, main effect and
interactive effect of the three variables on yarn strength were statistically significant. In this study, the effect of draw frame parameters on the breaking strength of rotor spun yarns was evaluated and fiber qualities were the same in all the samples. Although the fiber parameters interact with draw frame parameters in general, the effect of fiber properties on draw frame parameters and breaking strength of rotor spun yarns is beyond the scope of this research.
DEVELOPING PREDICTION MODELS
Model Construction and Analysis Using GEP Algorithm
Forty eight pairs of input-output patterns were available from the experiments. These patterns were randomly divided into training and testing sets. It should be noted that the testing data are those that are different from training data in at least one of the input parameters. This means that the data sets used are not the same as ones used in training. Besides, the range of each independent parameter (break draft, distance between middle and back rolls and production speed) was selected in such a way that covers all possible ranges of practical variations on the draw frame which is one of the main criteria to develop predictive models. Thirty-eight data pairs were selected as training set and 10 data pairs as testing set. In the proposed models, the input units were break draft, production speed, distance between back and middle rolls and the output unit was the breaking strength of spun yarns.
The major task is to define the hidden function connecting the input variables (X1, X2, X3) and output variable (Y). In this study, Y is the breaking strength (cN/tex); X1 is the break draft; X2 is the distance between back and middle rolls (mm); and X3 is the production speed (m.min-1). This can be written in the form of the Y = f (X1, X2, X3). The function developed
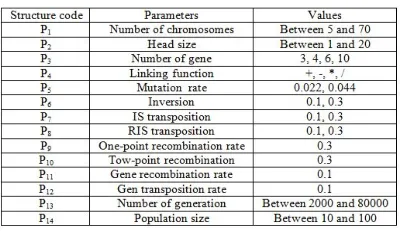
by GEP can be used to predict the breaking strength of rotor spun yarns. The parameters used in the GEP algorithm are summarized in Table IV. There were many different combinations of the parameters which means several GEP models. Since running the GEP for all of them requires a long computational time, a subset of these combinations was selected to investigate the performance of the GEP in predicting the breaking strength of rotor spun yarns.
TABLE IV. Parameters of the GEP algorithm.
Model Construction and Analysis Using Artificial Neural Network
The artificial neural network parameters were adapted by applying the same data sets used in GEP algorithm. The number of hidden neurons and the number of hidden layers are usually adjusted by trial and error.
The studies of various researchers have shown that, neural networks with one hidden layer are suitable for majority of applications and the second hidden layer can improve the performance of the network, if there is a complex relationship between input and output parameters. In order to obtain the best topology and to evaluate the capability of ANN algorithm, 12 topologies with different numbers of hidden layers and different numbers of hidden neurons (processing elements) were used. Therefore, 8 different network structures with only one hidden layer consisting of 3 to 10 neurons and four architectures with two hidden layers were used in this study. All the designed networks had three input units and one output neuron in output layer as explained in the prior section.
One of the important parameters in back-propagation algorithms is learning rate. Choosing a large learning rate value accelerates the training but cause big errors at the output or unstable the training cycles, but small values provide convergence with smaller errors and prolong training time. Therefore using an adaptive learning rate enhances the training performance. In this study, the adaptive learning rate with momentum training algorithm was used to enhance the training performance. Momentum rate was optimized at 0.90. The testing and training data were normalized in such a way that they got zero mean and unit standard deviation. After some trials the hyperbolic tangent and linear function were applied for hidden neurons and output neuron respectively.
RESULTS AND DISCUSSION Artificial Neural Network Model
Table V shows the training results of ANN models after 1000 epochs. The mean square error (MSE) and correlation coefficient (R2-value) of testing data were used to judge the performance of different models. The results showed that, the ANN model with two hidden layers and 4 processing elements into first and second hidden layers gives the best performance and the least MSE for predicting the breaking strength of rotor spun yarns on testing data. The MSE of testing and training data was 0.106 and 0.052 respectively. The R2-value of testing and training data was 0.93 and 0.97 respectively.
TABLE V. The performance of different ANN architectures on training and testing data sets.
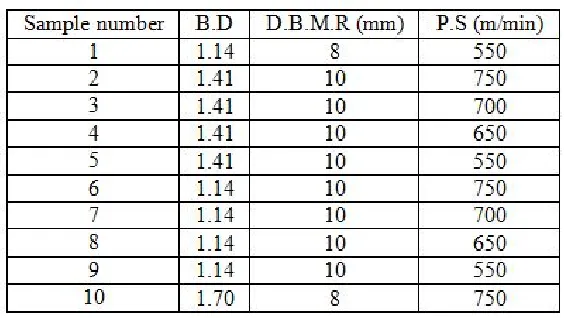
TABLE VI. Specifications of the yarn samples selected for testing set.
FIGURE 1. Evaluation of the ANN model to predict the yarn breaking strength.
GENE Expression Programming Algorithm In Table VIII, the 10 best solutions obtained from the tests are presented. As can be seen in this table, the best result obtained from the GEP algorithm has a 0.97 R2-value. The MSE of the test data was 0.071. Equation (4) represents mathematical function generated by the best structure of the GEP approach to predict the breaking strength (BS) of rotor spun yarns based on three independent variables namely, distance between back and middle rolls (DBBMR), production speed (PS), and break draft (BD).
TABLE VIII. The performance of different GEP architectures on training and testing data sets.
)) 3 ^ (BD))) (DBBMR) (
2) ^ 4.0885 (((( atan
)))) 3 ^ 6.8349 ( * (PS)) cos (( sin ( sin
((BD)))) cos 7.7377 ( 7.7377 (
) (DBBMR)))) (BD)
(( (cos (atan atan BS
(4
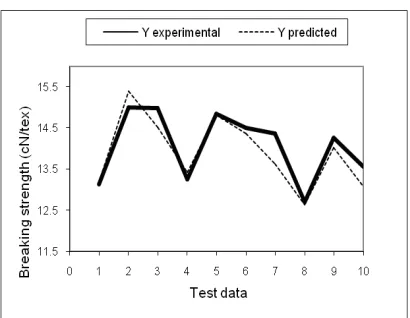
)The performance of the best gene expression programming architecture (equation 4) on the same test data as used in the ANN model is shown in Figure 2 and Table IX. According to Figure 2, there was a closer match between the actual and predicted yarn strength values than with ANN model. The average absolute error of the yarn breaking strength prediction was as low as 1.90%. According to Table IX, the minimum and maximum error for the best GEP model for the test data was 0.202% and 2.979% respectively. Therefore, the GEP function was able to closely follow the trend of the actual data.
TABLE IX. Comparison between experimental and predicted values for testing data set in GEP model.
COMPARING PREDICTION PERFORMANCE OF ANN AND GEP MODELS
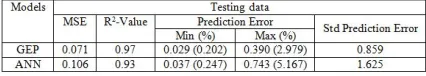
Table X shows a comparison of the prediction performance of ANN and GEP models. The difference between the MSE values for predicting the breaking strength of test data was 0.035 or 33.02%, although the difference between the R2-value of these two models was as low as 4.30%. The maximum error of ANN model for predicting testing data was 5.167% and belonged to sample 7. That was 2.970% for the GEP model. In addition, the ANN model exhibited a minimum error of 0.247% compared to 0.202% for the GEP model, which indicates the margin difference between two models.
TABLE X. Comparison between the prediction power of two models on testing data.
The difference between the maximum prediction errors of two models was 42.34%, which again confirmed the excellent capability of GEP model in predicting breaking strength of cotton rotor spun yarns compared to ANN model. As shown in Table X, the standard deviation of prediction error of GEP model was 0.859 and this value was obtained 1.625 for ANN model that again confirms the better capability of GEP model than ANN model.
The better performance of GEP algorithm can be explained based on the method of optimization of its parameter, which was based on the genetic algorithm. Although applying the genetic algorithm to optimize the ANN model parameters is a useful method to
Obtaining a specific mathematical equation describing the relation between dependent and independent parameters was a time consuming process, especially when there was not a clear relationship between input and output parameters, but this case was easily obtainable by the GEP algorithm. The GEP algorithm results in an equation that can be easily programmed even into a pocket calculator to use in future predictions. All of the obtained results accompanied with this benefit demonstrate the advantages of the GEP model when compared to the ANN model.
CONCLUSION
REFERENCES
[1] Sette, S.; Boullart, L.; Langenhove, A. V.; Kiekens, P.; Optimizing the Fibre-to-Yarn Production Process with a Combined Neural Network/Genetic Algorithm Approach; Textile Research Journal 1997, 67, 84-92.
[2] Plonsker, H. R.; Backer. S.; The Dynamics of Roller Drafting, Part I: Drafting Force Measurement; Textile Research Journal 1967, 37, 673-687.
[3] Das, A.; Ishtiaque, S. M.; Niyogi, R.; Optimization of Fibre Friction, Top Arm Pressure and Roller Setting at Various Drafting Stages; Textile Research Journal 2006, 76, 913-921.
[4] Balasubramanian, N.; The Effect of Top-Roller Weighting, Apron Spacing and Top-Roller Setting Upon Yarn Quality; Textile Research Journal 1975, 45, 322-325.
[5] Ishtiaque, S. M.; Mukhopadhyay, A.; Kumar, A.; Influence of Draw Frame Speed and Its Preparatory Process on Ring-Yarn Properties; Journal of The Textile Institute 2008, 99, 533-538.
[6] Ishtiaque, S. M.; Mukhopadhyay, A.; Kumar, A.; Impact of High-Speed Draw Frame and Its Preparatory on Packing and Related Characteristics of Ring Spun Yarn; Journal of The Textile Institute 2009, 100, 657-667. [7] Silva, E. A.; Paiva, A. P.; Balestrassi, P. P.;
Silva, C. E. S.; New Modelling and Process Optimisation Approach for the False-Twist Texturing of Polyester; Fibres and Textiles in Eastern Europe 2009, 17, 57-62.
[8] Unal, B. Z.; Koc, E.; Optimization of the Production Cost and/or Selected Performance Properties of Towel Fabrics; Journal of the Textile Institute 2010, 101, 996-1005.
[9] Erol, R.; Sagbas, A.; Multiple Response Optimisation of the Staple-Yarn Production Process for Hairiness, Strength and Cost; Fibres and Textiles in Eastern Europe 2009, 17, 40-42.
[10] Baykasoglu, A.; Oztas, A.; Ozbay, E.; Prediction and Multi-Objective Optimization of High-Strength Concrete Parameters via Soft Computing Approaches; Expert Systems with Applications 2009, 36, 6145-6155. [11] Chen, T.; Zhang, C.; Chen, X.; Li, L.; A Soft
Computing Model for Predicting Yarn Breaking Strength; Research Journal of Textile and Apparel 2007, 11, 80-86.
[12] Rajamanickam, R.; Hansen, S.; Jayaraman, S.; Analysis of the Modelling Methodologies for Predicting the Strength of Air-jet Spun Yarns; Textile Research Journal 1997, 67, 39-44.
[13] Dayik, M.; Prediction of Yarn Properties Using Evaluation Programming; Textile Research Journal 2009, 79, 963-972.
[14] Fausett, L.; Fundamentals of Neural Networks; Prentice Hall, New Jersey.; 1994.
[15] Principe, J. C.; Euliano, N. R.; Lefebvre, W. C.; Neural and Adaptive Systems; John Wiley & Sons, USA, New York.; 1999.
[16] Beltran, R.; Wang, L.; Wang, X.; Predicting Worsted Spinning Performance with an Artificial Neural Network Model; Textile Research Journal 2004, 74, 757-763.
[17] Majumdar, A.; Majumdar, P. K.; Sarkar, B.; Application of Linear Regression, Artificial Neural Network and Neuro-Fuzzy Algorithms to Predict the Breaking Elongation of Rotor-Spun Yarns; Indian Journal of Fibers & Textile Research 2005, 30, 19-25.
[18] Beltran, R.; Wang, L.; Wang, X.; Predicting the Pilling Tendency of Wool Knits; Journal of the Textile Institute 2005, 97, 129-136.
[19] Nasiri, M.; Shanbeh, M.; Tavanai, H.; Comparison Statistical Regression, Fuzzy Regression and Artificial Neural Network Modelling Methodologies in Polyester Dying, Proceeding of International Conference on Computational intelligence for Modelling, Control and Automation, Austria, IEEE Computer Society, Vienna , 2005.
[20] A. Babay, A.; Cheikhrouhou, M.; Vermeulen, B.; Rabenasolo, B.; Castelain, J. M.; The Optimal Neural Network Architecture for Predicting Cotton Yarn Hairiness; Journal of the Textile Institute 2004, 96, 185-192. [21] Ertugrul, S.; Ucar, N.; Predicting Bursting
Strength of Cotton Plain Knitted Fabrics Using Intelligent Techniques; Textile Research Journal 2000, 70,845-851.
[22] Turhan, Y.; Tokat, S.; Eren. R.; Statistical and Computational Intelligence Tools for the Analysis of Warp Tension in Different Back-rest Oscillations; Information Science 2007, 177, 5237-5252
[23] Submramanian, S. N.; Venkatachalam, A.; Submramanian, V.; Prediction and Optimization of Yarn Properties Using Genetic Algorithm/Artificial Neural Network; Indian Journal of Fibre and Textile Research 2007, 32, 409-413.
[25] Ramesh, M. C.; Rajamanickam, R.; Jayaraman, S.; The Prediction of Yarn Tensile Properties by Using Artificial Neural Networks; The Journal of the Textile Institute 1995, 86, 459-469.
[26] Majumdar, A.; Mitra, A.; Banerjee, D.; Majumdar, P. K.; Soft Computing Applications in Fabrics and Clothing; A Comprehensive Review; Research Journal of Textile and Apparel 2010, 14, 1-17.
[27] Ferreira, C.; Gene Expression Programming; A New Adaptive Algorithm for Solving Problems; Complex Systems 2001, 13, 87-129.
AUTHORS’ ADDRESSES Abdolrasool Moghassem, Ph.D. Islamic Azad University, Gaemshahr Branch
Departement of Textile Engineering
Nezami Street, Ghaemshahr, Mazandaran, 163 IRAN
Alireza Fallahpour Department of Management Firoozkooh Branch
Islamic Azad University Firoozkooh
IRAN
Mohsen Shanbeh
Department of Textile Engineering Isfahan University of Technology Isfahan