The Performance of Different Clustering Methods in the
Objective Assessment of Fabric Pilling
Siamak Saharkhiz, Ph.D, Mohammad Abdorazaghi
Amirkabir University of Technology, Tehran IRAN, ISLAMIC REPUBLIC OF
Correspondence to:
Siamak Saharkhiz email: [email protected];[email protected]
ABSTRACT
In the present work, the performance clustering methods for classifying the pilling of knitted fabric and comparison among different classification algorithms is presented, Median- cut, K-mean, and Competitive Learning algorithms of K-mean were investigated in order to objectively evaluate fabric pilling. To achieve objective assessment, the fabric surface was scanned by a non-contact method using a laser triangulated device with no interfere to the fabric surface. The 2-D Fast Fourier Transform method considering low pass filtration and suitable cut-off frequency was applied to identify and separate pills from fabric fuzzy surfaces and fabric textures. Several fabric surface parameters were extracted but the number of pills, protruding geometrical volume, and area of pills were found to have better correlation with subjective evaluation. A pill grade intensity vector, comprising the three mentioned parameters was introduced for developing the clustering algorithms. The results show that K-mean and Competitive Learning algorithms of K-mean give a fair agreement between objective and subjective grades, while the Median-cut method has a poor correlation.
INTRODUCTION
Development of pills on a fabric surface is a quality problem in apparel. The International Fabricate Institute Education and Consumer Relations Department define a pill as a mass of entangled fibers connected to fabrics [1]. The pills are a combining of two phenomena: fuzzing, the protruding of fibers from the fabric surface, and pills, the persistence of formed neps at the same surface [2]. Pilling is also a good indication of the performance of a spinning process which is intended to produce quality yarns with a lower tendency to pill.
Despite cited theoretical works and a variety of techniques and methods for objective evaluation of pilling, this phenomenon is still assessed subjectively by comparison with standard pilling test images. The visual fabric pilling assessment is prone to individual
bias, so it is still desirable to develop an objective and accurate method to evaluate the pilling intensity.
During the years there have been many attempts to develop an objective method as a replacement for the common subjective evaluation method. Different methods and techniques have been employed and cited in the literatures. In general, they can be categorized into three main fields.
Some of the methods represent pure image analysis techniques by studying the images as a point view of image information such as brightness of pixels, and color shades. Behera et al. tried to develop a method for objective measurement of pilling using an image processing technique [3]. Jasińska developed a method consisting of analyzing fabric surfaces after the pilling process by means of color image analysis (RGB model channels) [4]. His [5] and Kang [6] tried to identify the pills from the background texture by digital image techniques using pixel-based brightness.
function of Bayes’ rule for pill classification [9]. Palmer and Wang suggested that the pilling intensity can be classified by the standard deviation of the horizontal detail coefficients of two-dimensional discrete wavelet transform at one given scale [10,11].
The third approach in this field is the analytical analysis of the data grabbed from the fabric surface. The height of the fabric surface is measured and analyzed by mathematics and the data of pills are
represented. Ramgulam et al. used a laser
triangulation scanning device in order to collect information from the fabric surface. Later the information of pills from the data was extracted. Using the triangulated laser method was first cited in this paper [12].
The aims of this study were to implement clustering methods for classifying fabric pilling and to provide a comparison among different clustering methods (Median-cut, K-mean, and Competitive Learning algorithms of K-mean) in order to investigate the performance of each clustering method.
Applications of 2-D fast Fourier transform in pill identification and user friendly data analysis software were also developed in this study.
EXPERIMENTAL
Sample Preparation and Subjective Evaluation
In this study, knitted fabrics with rib structure and average weight of 233 g/m2 were used. After scouring and drying of the fabric, 50 samples with dimension of 105 by 105 mm2 were prepared. In order to develop pills on the fabric surface, an Atlas Random Tumbling pilling tester was used. The procedure employed was according to ASTM D3517 [13]. With the aim of having five grades of pill severity, samples were treated in the random tumbling testing machine for different length of times. Minimum required time was 30 minutes, and by adding extra times the severity of the fabric pills increased. After preparing the samples with five grades of pilling severity, subjective assessment was done by ten quality control experts.
Fabric Scanning and Data Preparation
In order to give an objective analysis of fabric surface, a non-contact method was employed with the aim of not altering the fabric surface. The device was comprised of a laser triangulate sensor, capable of measuring the height of the fabrics with five micron accuracy, and a two directional movable X-Y table. In order to optimize the time of the sampling and also obtain accuracy, the step of 0.2 mm and the area of 55 cm for each sample was selected. Therefore
62500 data points were collected for each sample. In order to remove noise involved, data preparation needed to be implemented. To configure the fabric surface, median algorithm for smoothness showed better results (Figure 1).
a
b
FIGURE 1. a) Original data from laser scanning, b) effect of median smoothness filtration.
RESULTS and DISCUSSION
2-D Fast Fourier Transform Method to Identify Pills
Basically, the Fourier method expresses any periodical function as the sum of sines and / or cosines of different frequencies, each multiplied by a different coefficient. Even the functions that are not periodic can be expressed as integrals of sines and / or cosines multiplied by a weighting function. The important characteristic of Fourier Transform is that it can be reconstructed (recovered) completely via an inverse process, with no loss of information. The 2D Fourier transform of non-continuous f (x, y) function and its reverse are defined as following equations [14].
1 ,..., 2 , 1 , , 1 ,..., 2 , 1 , / / 2 exp , 1 , 1 1 N v M u N vy M ux j y x f MN v u F M x N y
1 ,..., 2 , 1 , , 1 ..., , 2 , 1 , ) / / ( 2 . exp , 1 ) ,( 1 1
N y M x N vy M ux j v u F MN y x f M u N v
(2)
It was assumed that laser scanning data from a knitted fabric can be expressed as a discontinuous function of f(x,y) where x, y is the coordinate of each point on fabric surface and f(x,y) is the height of fabric at that point. Due to the nature of fabric structure and repetition of weave, there is a uniform wavy pattern on the fabric surface. Therefore the whole fabric surface with no pill can be considered as periodic data.
In considering the fabric structure, its surface can be expressed as a function of f(x,y). A pill on the fabric can be considered as a disorder in the arrangement of the data network of the fabric surface. Therefore by separating and removing fabric structure data as periodic data, it is possible to isolate the data of the pills which are considered as non-periodic data.
In order to remove the data related to fabric structure, which represents high frequency data, a low pass filter was utilized in the Fourier transform of f(x, y) function. If H(u,v) and F(u,v) define filter transform function and Fourier Transform function respectively, the filtered Fourier transform G(u,v) of function f(x,y) is as:
G(u,v)= H(u,v). F(u,v) (3)
The ideal low pass filtration is defined as following:
if D u v D
D v u D if v u H ) , ( , 1
, (4)
In the above equation D0 is a positive number and named cut off frequency. D(u,v) is the frequency of (u,v) from frequency center Eq. (4).
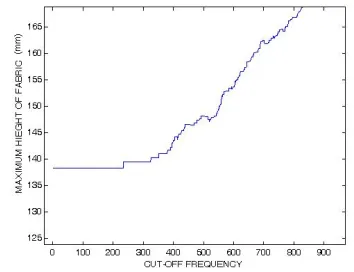
Usually D0 is defined in such a way that special part of the frequency remains in frequency criteria. By using low pass filter and some changes in Eq. (4) and suitable cut off frequency, it is possible to remove pill frequency from the Fourier transform of the original fabric function. Later, by recovering the filtered Fourier transform, actual fabric without pills is assessable. In Figure 2 the effect of cut off frequency to remove high frequency data from Fourier Transform fabric data is shown in several steps. The threshold level can be defined in such a way as to separate the fabric surface dada from the pill data. By choosing a suitable cut-off frequency the surface of fabric can be recovered without pills.
Figure 3 shows the maximum height of the recovered fabrics in each step.
a
b
c
FIGURE 2. Effect of cut-off frequency to removing high frequency data from fabric, a) original fabric, b) and c) recovered fabric with cut off frequency 850, 300 respectively.
Classification
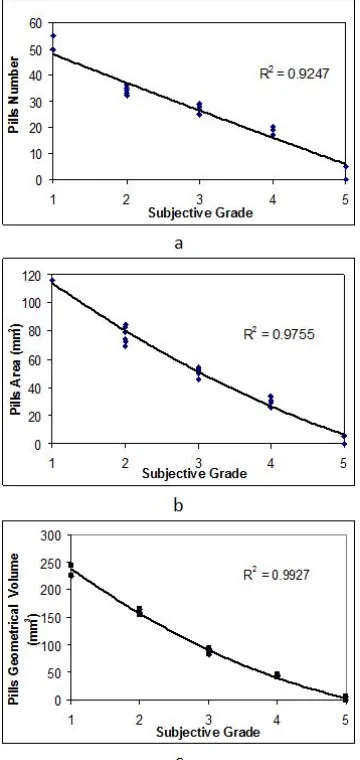
By analyzing the pill data separated from the fabric data several parameters were extracted including shape, height, geometrical volume, number of pills, and area of pills. Further analysis showed that among these parameters, the number of pills, their area, and geometrical volumes gave a better correlation with the quality control experts’ evaluation grading (Figure 4).
FIGURE 4. Correlation between subjective grade and calculated pills parameters. a) pills number, b) pills area, c) pills geometrical volumes.
In order to define a suitable pill classification, three clustering algorithms, namely, Median-cut, K-mean, and Competitive Learning of K-mean algorithms were applied [14]. Normalized parameters of geometrical volume, number of pills, and area of pills (which represents as an input data vector of (x(i), x(j), x(k))) were regarded as a three classification algorithm. Due to subjective evaluation of grading by comparing the samples with five standards photos, in
each algorithm five divided class were defined. Each input data (Vk) can be expressed as:
) , ,
( () ( ) (k)
v j v i v
k x x x
V (5)
In the Median-cut method the total input vectors are classified according to the dispersion of the input data. In this method the smallest area including all input data is defined and all the data in a specific area sorted. In next step the area is divided into two areas of median value input data from previous step. This algorithm is continued by repeating the mentioned steps to favor areas, as in our study five areas, and the representative of the each class is defined from the mean value of the each area (Figure 5).
FIGURE 5. Schematic diagram of classes in Median-cut algorithm: In this algorithm the area of input data will be divided in non equal classes and the mean value of each area will be defined as representative of each class.
In the K-mean method each input vector represents only one class. The function of classification is obtained by optimization of Eq. (6) to minimum value.
Ck X S
k k
V
X
1
)
(
(6)In Eq. (6), C is the number of the classes, Sk is the data in each classes, X is the data belongs to one class and Vk will calculate from following equations.
k k
s X
s X k
X V
1 (7)
] ) min[(
arg 2
k j j X V
S
X (8)
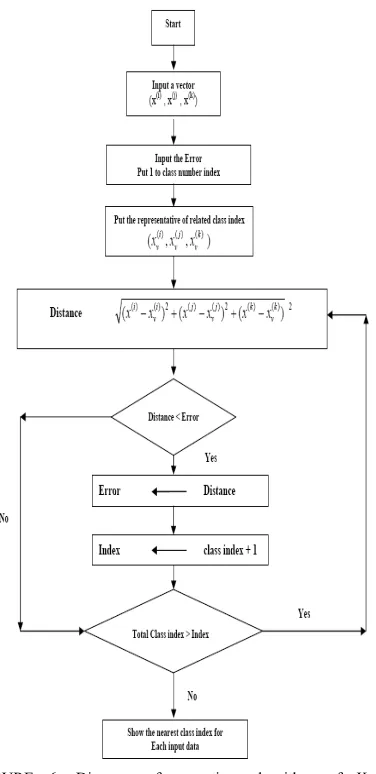
FIGURE 6. Diagram of operating algorithm of K-mean classification.
In order to reach more efficient classification from the K-mean algorithm, the Competitive Learning of K- mean algorithm was used. One way to optimizing Eq. (9) is using sequence in order to reach the results. In other words, the new representative in each class is defined by the following equation.
(9)
where t shows the index of the sequence and α (t) is defined as the speed of the learning coefficient. In this algorithm if a data point belongs to one class
introduced to algorithm, the nearest center will move to x (t), while other centers of classes will remain at fixed. In actuality, t automatically chooses to a value of one that will decrease uniformly. This algorithm is very sensitive to the first position of center points, and if the first data point would be near target values, this algorithm will yield more efficient results.
In order to evaluate the performance of the algorithms, all the samples were scanned and their data files were processed. The correlation factors of objective and subjective evaluation of the pilling of the samples by using Median-cut, K-mean and Competitive Learning of K-mean algorithms were found to be 0.826, 0.963 and 0.825 respectively. As shown in Figure 7 the comparison among three different methods shows that using Competitive Learning of K-mean algorithm is more reliable in objective evaluation of pilling.
FIGURE 7. The comparison among correlation factor of objective and subjective fabric pill grading by using Median-cut, K-mean, Competitive Learning of K-mean methods.
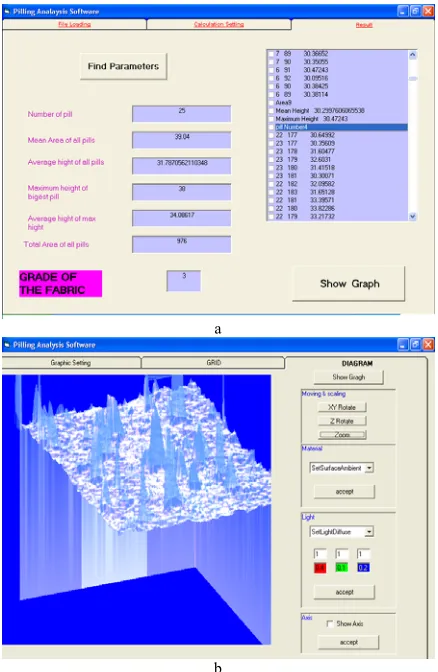
In order to implement the algorithms, user-friendly application software was developed using Visual Basic (version 6) programming language. By feeding the fabric surface data to the software, the information related to pills including number of pills, individual height, area, and geometrical volume of the pills, average area and height of all pills, height and area of the biggest pill, and finally the objective numerical grade of fabric are presented. In addition, three dimensional view of the fabric surface with the possibility of rotation in every direction and view the fabric surface in desirable view point is provided (Figure 8).
)] ( ) ( [ ) ( ) ( ) 1
(t V t t X t V t
a
b
FIGURE 8. Data analysis software for pilling classification, a) data analysis, b) 3D visual image of fabric.
CONCLUSION
In this research, the performance of implementing clustering methods for pilling classification on knitted fabric by using Median-cut, K-mean and Competitive Learning of K-mean algorithms was examined. By implementing the different methods of clustering five classification rules compatible with five objective classification reference images were developed. The comparison among the applied methods revealed that the correlation factor in objective and subjective evaluation of the pilling of the samples by using Competitive Learning of K- mean algorithm is 0.985 and is more reliable when compared to K-mean and Median-cut methods. These findings show that clustering methods can successfully be implemented in recognition and grading of fabric pilling with a good correlation between expert’s subjective evaluation and objective grading. In addition, one of the goals of this research was to develop user friendly data analysis application software to implement the necessary complicated mathematics involved and also apply the developed algorithm in an easy and fast way. The software is capable of providing a detailed profile of the pills
effectively; including the number of pills, individual pill height, area, and geometrical volume, average area, and height all pills, height and area of the biggest pill, and finally an objective numerical grade of the fabric pilling.
REFERENCES
[1] Harrison, P.W., Pilling, Textile Institute, 1998. [2] Naik, A., Lopez-Amo, F., Pilling Propensity of
Blended Textiles, Melliand Textilberichte, 1982, 6, 416.
[3] Behera, B.K.; Mohan, T.E. Madan, Objective Measurement of Pilling by Image Processing Technique, International Journal of Clothing Science and Technology, 2005, vol. 17, Number 5, pp. 279-291(13).
[4] Jasińska, I., Assessment of a Fabric Surface after the Pilling Process Based on Image Analysis, Fibers & Textiles in Eastern Europe, 2009, 17, pp. 55-58.
[5] Hsi, C.H., Bresee, R.R., Annis, P. A.,
Characterizing Fabric Pilling by Using Image-analysis Techniques, Part I: Pill Detection and Description, J. of Textile Inst., 1998, 89, pp. 80-95.
[6] Kang, T.J., Cho, D.H., Kim, S.M., Objective Evaluation of Fabric Pilling Using Stereovision, Textile Research Journal, 2004, 74, pp.1013-1017.
[7] Xu, B., Instrumental Evaluation of Fabric Pilling, J. of Textile Institute, 1997, 88, pp. 488-500.
[8] Sirikasemlert A., Tao X., Objective Evaluation of Textural Changes in Knitted Fabrics by Laser Triangulation, Textile Research Journal, December, 2000, vol. 70, no.12, pp. 1076-1087.
[9] Zhang, Junmin, Wang, Xungai and Palmer, Stuart, Objective pilling evaluation of wool fabrics, Textile research journal, 2007, vol. 77, no. 12, pp. 929-936.
[10] Palmer, S., Wang, X., Objective Classification of Fabric Pilling Based on the Two-Dimensional Discrete Wavelet Transform,
Textile Research Journal, 2003, 73, pp. 713-720.
[11] Zhang, J., Wang, X., Palmer, S., The
Robustness of Objective Fabric Pilling Evaluation Method, Fibers and Polymers, 2009, 10, pp.108-115.
[13] ASTM D 3512, Standard Test method for Pilling Resistance and other Related Surface Changes of Textile Fabrics: Random Tumble Pilling Tester Method.
[14] Mirkin, B., Mathematical Classifications Clustering, Kluwer Academic, 1996.
AUTHORS’ ADDRESSES Siamak Saharkhiz, Ph.D. Mohammad Abdorazaghi
Textile Engineering Department Amirkabir University of Technology No. 454, Hafez Ave.
Tehran Tehran 15914