Pharmacophore
2012, Vol. 3 (2), 130-155
ISSN 2229 – 5402
Pharmacophore
(An International Research Journal)
Available online at http://www.pharmacophorejournal.com
Original Research Paper
ANALYTICAL METHOD DEVELOPMENT FOR SIMULTANEOUS
ESTIMATION OF OXYBENZONE, OCTOCRYLENE, OCTINOXATE AND
AVOBENZONE IN SUNSCREEN BY HIGH PERFORMANCE LIQUID
CHROMATOGRAPHY AND ITS VALIDATION
Chirag Bhuva
1*, Rambir Singh
2and Anil Sharma
11
* Department of Quality Assurance, Gyan Vihar School of pharmacy,
Suresh Gyan Vihar University, Jaipur, 302025, India
2
Department of Pharmaceutical Chemistry, Gyan Vihar School of pharmacy,
Suresh Gyan Vihar University, Jaipur, 302025, India
ABSTRACT
The separation of oxybenzone, octocrylene, octinoxate and avobenzone were carried out on waters C18, 5
μ (250 X 4.6 mm) column. The compounds were eluted using a mobile phase of MeOH : H2O (90:10 %
v/v) at a flow rate of 1.0 mL/min and were monitored using UV detector at 330 nm. The retention times were 4.5, 7.6, 11.2 and 12.4 for octocrylene, octinoxate and avobenzone respectively. The reliability and analytical performance of the proposed RP-HPLC procedure were statistically validated with respect to linearity, ranges, system suitability, precision, accuracy, robustness, ruggedness, detection and quantification limits. The linear correlation coefficient at range of 12-28 μg/mL of assay concentration levels was found to be 0.999 for all drugs. Repeatability, inter day precision, intraday precision, ruggedness and robustness expressed as the percentage relative standard deviation (% RSD) were less than 2, accuracy by recovery study of were found to be between 99.0 % and 101.0 %. LOD values were found to be 0.07, 0.28, 2.12 and 2.54 μg/mL for octocrylene, octinoxate and avobenzone respectively. LOQ values were found to be 0.00, 0.00, 0.03 and 0.04 μg/mL for oxybenzone, octocrylene, octinoxate and avobenzone respectively.
Keywords:
Oxybenzone, Octocrylene, Octinoxate, Avobenzone, RP-HPLC, Method development, Method validation,Simultaneous estimation,High Performance Liquid Chromatography.INTRODUCTION
Analytical methods development and validation play important roles in the discovery, development and manufacture of pharmaceuticals.1 Pharmaceutical products formulated with more than one drug,
(Spectrophotometric, HPLC) for drug products containing more than one active ingredient. The official test methods that result from these
processes are used by quality control laboratories to ensure the identity, purity,
potencyand performance of drug products.2
METHOD DEVELOPMENT
The purpose of method development is to establish the applicability of an analytical method for its intended use on a certain sample. There are many tests that need to be carried out in the pharmaceutical field such as assay, dissolution, identification and related substance. Each of these tests, particularly the quantitative analysis has to be developed for its fit for use before approving it for routine application. Method development is on certain consideration. It exists today a good practical understanding of chromatographic separation. Any approach towards HPLC method development should be based upon knowledge of chromatographic process. A good method development requires more experimental runs as they are necessary to achieve final result.1
Accuracy (Recovery)7
Accuracy expresses the closeness of agreement between the value found and the value that is accepted as either a conventional true value or an accepted reference value. It may often be
(spiked placebos) are prepared normally covering 50% to 150% of the nominal sample preparation concentration. These samples are analyzed and the recoveries of each are calculated. Spiking can be performed as wet (e.g. via solution) or dry.
Precision7
Repeatability (method precision)
Repeatability evaluates the variation experienced by a single analyst on a single instrument. Repeatability does not distinguish between variation from the instrument or system alone and from the sample preparation process. Repeatability is performed by analyzing multiple replicates of an assay composite sample using the analytical method. The recovery value is calculated and reported for each value.
Intermediate precision
Chirag Bhuva / Pharmacophore 2012, Vol. 3 (2), 130-155 day using different conditions and different
instruments. The recovery values are calculated and reported. A statistical comparison is made to the first analysts results.
Specificity and/or Selectivity7
Specificity is the ability to assess unequivocally the analyte in the presence of components that may be expected to be present such as impurities, degradation products and excipients. There must be inarguable data for a method to be specific. Specific measure only the desired component without interference from other species which might be present; separation is not necessarily required. Selectivity is the ability of the analytical method to resolve each and every related compound in the mixture. Specificity is required for assay but selectivity is not. Both specificity and selectivity are required for impurities analysis. Specificity and selectivity is determined by analyzing blanks, sample matrix (placebo) and known related impurities to determine whether interferences occur. Specificity and selectivity are also demonstrated during forced degradation studies.
Detection Limit7
The detection limit (DL) or Limit of detection (LOD) of an individual procedure is the lowest amount of analyte in a sample that can be detected but not necessarily quantitated as an exact value. In analytical procedures that exhibit baseline noise, the LOD can be based on a signal to noise ratio (3 to 1), which is usually expressed as the concentration (e.g. percentage, parts per billion) of analyte in the sample. There are several ways in which it can be determined, but usually involves injecting samples which generate S/N of 3:1 and estimating the DL. For instrumental methods limit of detection is calculated by using the following equation,
LOD = 3 * SD/slope of calibration curve
Where SD = Standard deviation of blank readings or intercepts of calibration curves
Quantitation Limit7
The quantitation limit (QL) or Limit of quantitation (LOQ) of an individual analytical procedure is the lowest amount of analyte in a sample that can be quantitatively determined with suitable precision and accuracy. The quantitation limit is a parameter of quantitative assays for low concentrations of compounds in sample matrices and is used particularly for the determination of impurities and/or degradation products. It is usually expressed as the concentration (e.g. percentage, parts per million etc.) of analyte in the sample. For analytical procedures that exhibit baseline noise the LOQ is generally estimated from a determination of signal-to-noise ratio (10 to 1) and is usually confirmed by injecting standards which give this S/N ratio and have acceptable % RSDs as well. For instrumental method LOQ can be calculated as follows,
LOQ=10 * SD/slope of calibration curve
Where SD = Standard deviation of blank readings or intercepts of calibration curves
Linearity7
Linearity evaluates the analytical procedure ability (within a give range) to obtain a response that is directly proportional to the concentration (amount) of analyte standard. If the method is linear, the test results are directly or by well-defined mathematical transformation, proportional to the concentration of analyte in samples within a given range. Note that this is different than Range (sometimes referred to as linearity of method) which is evaluated using samples and must encompass the specification range of the component assayed in the drug product. Linearity may be established for all active substances, preservatives and expected impurities. Evaluation is performed on standards.
Range7
Range is the interval between the upper and lower concentrations (amounts) of analyte in the sample (including these concentrations) for which it has been demonstrated that the analytical procedure has a suitable level of precision, accuracy and linearity. Range is normally expressed in the same units as test results (e.g. percent, parts per million etc.) obtained by the analytical method. Range (sometimes referred to as linearity of method) is evaluated using samples (usually spiked placebos) and must encompass the specification range of the component assayed in the drug product.
Robustness Testing7
Description of robustness testing robustness is the measure of the ability of an analytical method to remain unaffected by small but deliberate variations in method parameters (e.g. pH, mobile phase composition, temperature, instrument settings etc.) and provides an indication of its reliability during normal usage. Robustness testing is a systematic process of varying a parameter and measuring the effect on the method by monitoring system suitability and/or the analysis of samples.
Ruggedness7
Ruggedness is the degree of reproducibility of test results obtained by the analysis of the same sample under a variety of normal test conditions such as different laboratories, different analysts, different instruments, different lots of reagents, different elapsed assay times and different assay temperature etc.
MATERIALS AND METHODS
HPLC Grade Methanol, Acetonitrile (Merck)
HPLC Grade Water (Milli-Q)
Potassium Dihydrogen Phosphate GR Grade (Merck)
Milli–Q water and 0.2μ Nylon filter were used throughout the experimental work All the chemicals used during this project
work were of either AR grade or HPLC grade, procured from Rankem chemicals, Ranbaxy, Mumbai and Qualigen chemicals, Qualigen Fine Chemicals, Mumbai
Instruments and equipments
HPLC LC-2010C HT Shimadzu with LC Solution
Column: Water C18, 5 μ (250 X 4.6 mm) Shimadzu SPD-M20A Prominence Diode
array detector
Perkin Elmer lambda 25 UV/Vis Double beam spectrophotometer
Sartorius BT 224 S balance
pH Meter Thermo electron corporation Orion 3 star pH Benchtop
Calibrated glassware’s were used for the study
Filter used: Pall Life Sciences. Ultipor N66 Nylon 6.6 Membrane 0.2μ 47 mm
Methods
Development and validation of assay method for simultaneous estimation of oxybenzone, octocryline, octinoxate and avobenzone in sunscreen by RP-HPLC
Selection of Chromatographic Method
Chirag Bhuva / Pharmacophore 2012, Vol. 3 (2), 130-155 An accurately weighed quantity of 50.0 mg
Oxybenzone, 50.0 mg Octinoxate, 50 mg Avobenzone and 50.0 mg Octocrylene were transferred in 100.0 mL volumetric flask, dissolved with HPLC grade methanol and volume was made up to the mark with HPLC grade methanol, sonicated for 10 min. From the
prepared solution, pipette out 10.0 mL in 100.0 mL volumetric flask and volume was made up to the mark with HPLC grade methanol to make final Concentrations: 50.0 ppm Oxybenzone, 50.0 ppm Octinoxate, 50.0 ppm Avobenzone and 50.0 ppm Octocrylene.
Figure 1: Isobestic point
Optimization of Chromatographic Condition
Preparation of Standard Solution
An accurately weighed quantity of 30.0 mg Oxybenzone, 75.0 mg Octinoxate, 20.6 mg Avobenzone and 30.0 mg Octocrylene were transferred in 100.0 mL volumetric flask, dissolved with HPLC grade methanol and volume was made up to the mark with HPLC grade methanol, sonicated for 10 min.-Stock Solution. From the prepared solution, pipette out 5.0 mL in 50.0 mL volumetric flask and volume was made up to the mark with HPLC grade methanol to make final Concentrations: 30.0
ppm Oxybenzone, 75.0 ppm Octinoxate, 20.6 ppm Avobenzone and 30.0 ppm Octocrylene.
Initial Chromatographic Condition
System : Shimadzu
LC-2010 C HT
Column : Chromatopack
Peerless Basic C18, 5 μ (250 X 4.6 mm)
Flow rate : 1.0 mL/min
Detection Wavelength : 330 nm
Column Temperature : 25°C
Injection volume : 20 μL
Mobile Phase : The various
mobile phases tried are shown in Table 1
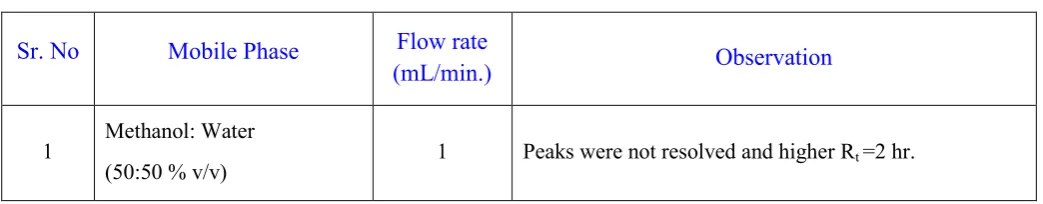
Table 1: Trial and error
Sr. No Mobile Phase Flow rate
(mL/min.) Observation
1 Methanol: Water
2 Methanol: Water
(60:40 % v/v) 1 Peaks were not resolved and higher Rt =1.5 hr.
3 Methanol: Water
(70:30 % v/v) 1 Peaks were not resolved and higher Rt =1.0 hr.
4 Methanol: Water
(80:20 % v/v) 1
Peaks were slightly resolved as compare to above trial and less Rt =0.4 hr.
5 Methanol: Water
(88:15 % v/v) 1
Peaks were more resolved as compare to above trial and less Rt =0.3 hr., Intensity is not good.
6 Methanol: Water
(90:10 % v/v) 1
Peaks were resolved and good Rt =0.15 hr.
and good resolution, tailing factor <1.5.
Rt 4.660 7.974 11.694 12.916
7 Methanol: Water
(95:05 % v/v) 1
Peaks were merge Rt =0.07 hr.
and good resolution, tailing factor <1.5,
Rt 3.847 4.923 6.807 7.443
8 Methanol:Water:ACN:IPA
(85:10:05:0 % v/v) 1 Intensity good but peak were merge together
9 Methanol:Water:ACN:IPA
(80:15:05:0 % v/v) 1
Intensity good but peak were merge slightly and tailing factor > 1.5
10 Methanol:Water:ACN:IPA
(83:12:05:0 % v/v) 1
Intensity good but peak were merge slightly and tailing factor > 1.5
11 Methanol:Water:ACN:IPA
(83:12:05:0 % v/v) 1
Intensity good but peak were merge slightly and tailing factor > 1.5
12 Methanol:Water:ACN:IPA
(85:10:0:05 % v/v) 1 Intensity good but tailing factor > 1.8 and resolution =2
13 Methanol:Water:ACN:IPA
(80:15:0:05 % v/v) 1 Intensity good but tailing factor > 1.7 and resolution =2
14 Methanol: Water
Final optimized chromatographic condition
System : Shimadzu LC-2010 C HT
Column : Chromatopack Peerless Basic C18, 5 μ (250 X 4.6 mm)
Detection Wavelength : 330 nm
Flow rate : 1.0 ml/min
Column Temperature : 25 °C
Injection volume : 20 μL
Mobile Phase : Methanol: Water (90:10 % v/v)
Solvent Ratio : MeOH
Operating pressure : 205 kgf (± 1)
VALIDATION OF RP-HPLC METHOD Linearity and Range
Preparation of standard solution
An accurately weighed quantity of 30.0 mg Oxybenzone, 30.0 mg Octocrylene 75.0 mg Octinoxate and 20.6 mg Avobenzone were transferred in 100.0 mL volumetric flask, dissolved with HPLC grade methanol and volume was made up to the mark with HPLC grade methanol, sonicated for 10 min. Stock Solution. From that stock solution pipette out 2, 2.7, 3.4, 4, 4.7 mL in six 50.0 mL volumetric flask individually and volume was made up to the mark with HPLC grade water to make final Concentration: 12, 16, 20, 24, 28 μg/ mL.
Procedure
The selected stationary phase was allowed to equilibrate with mobile phase till steady base line was obtained. Then each solution was injected and chromatograms ware recorded. The observations of concentration of the drug and their area under curves are showed in Table: 2.
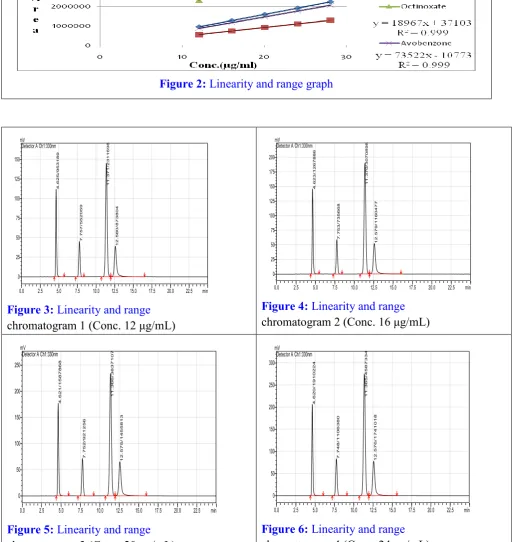
Table 2: Linearity and range
Sr. No. Conc.
( μg/ mL)
Peak area
Figure
Oxybenzone Octocrylene Octinoxate Avobenzone
1 12 953189 552059 2311698 873804 6.3
2 16 1270426 734763 3067800 1165039 6.4
3 20 1587868 921256 3837107 1455813 6.5
4 24 1906100 1106100 4595054 1753868 6.6
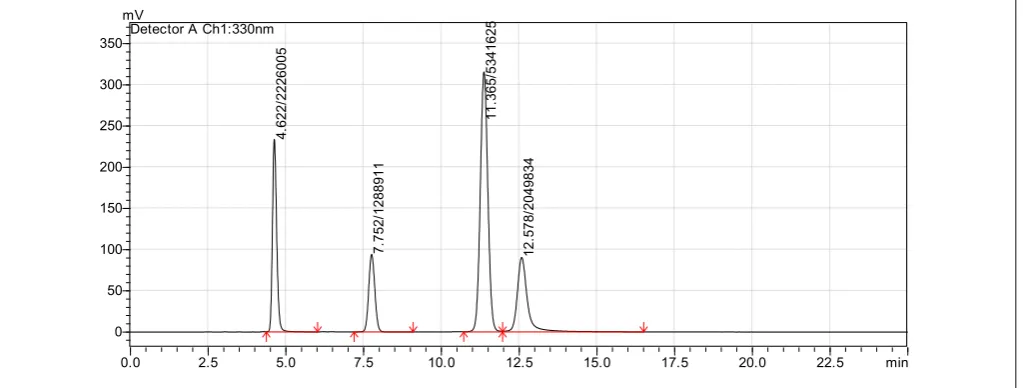
5 28 2226005 1288911 5341625 2049834 6.7
Slope 79533 46126 18967 73522
Intercept 1935 1902 37103 10773
Correlation Coefficient
Figure 2: Linearity and range graph
0.0 2.5 5.0 7.5 10.0 12.5 15.0 17.5 20.0 22.5 min
0 25 50 75 100 125 150 mV Detector A Ch1:330nm
4 . 62 5/ 9 53 18 9 7 . 75 7/ 5 52 05 9 1 1. 3 71 / 23 11 69 8 1 2. 5 80 / 87 38 04
Figure 3: Linearity and range
chromatogram 1 (Conc. 12 μg/mL)
0.0 2.5 5.0 7.5 10.0 12.5 15.0 17.5 20.0 22.5 min
0 25 50 75 100 125 150 175 200 mV
Detector A Ch1:330nm
4 .62 3/ 1 26 78 86 7 .75 3/ 7 35 66 8 1 1. 3 70 /30 70 89 8 1 2. 5 79 /11 60 47 7
Figure 4: Linearity and range
chromatogram 2 (Conc. 16 μg/mL)
0.0 2.5 5.0 7.5 10.0 12.5 15.0 17.5 20.0 22.5 min
0 50 100 150 200 250 mV
Detector A Ch1:330nm
4 . 62 1/ 1 58 78 68 7 . 75 2/ 9 21 25 6 1 1. 3 66 / 38 37 10 7 1 2. 5 75 / 14 55 81 3
Figure 5: Linearity and range
chromatogram 3 (Conc. 20 μg/mL)
0.0 2.5 5.0 7.5 10.0 12.5 15.0 17.5 20.0 22.5 min
0 50 100 150 200 250 300 mV Detector A Ch1:330nm
4 . 62 0/ 1 91 02 24 7 . 74 8/ 1 10 63 80 1 1. 3 65 / 45 87 33 4 1 2. 5 76 / 17 41 01 8
Figure 6: Linearity and range
Chirag Bhuva / Pharmacophore 2012, Vol. 3 (2), 130-155
Figure 7:Linearity and range chromatogram 5 (Conc. 28 μg/mL)
Limit of Detection And Limit of Quantification
Based on the Standard Deviation of the Response and the Slope
Limit of detection(LOD) = 3.3 σ/S
Limit of quantification(LOQ) = 10σ/S
Where σ = the standard deviation of the response
S = the slope of the calibration curve
Table 2: Limit of Detection and Limit of Quantification
Sr. No. Slope Intercept
OXY OCL OXT AVO OXY OCL OXT AVO
1 79533 46126 18967 73522 1935 1902 37103 10773
2 80546 45841 19101 72547 1938 1905 38154 10988
3 78011 46879 18754 72545 1889 2001 36874 99875
4 77266 45257 17586 74112 2001 1897 37541 11012
5 81425 46752 18324 73658 1945 2045 37456 10098
6 75044 44874 17254 73584 2014 2058 37589 10954
SD 2340.99 798.37 760.44 640.28 46.33 68.49 488.14 493.45
LOD (µg/mL) 0.07 0.28 2.12 2.54 - - - -
LOQ (µg/mL) 0.00 0.00 0.03 0.04 - - - -
System Suitability Parameters And Specificity: Blank And Placebo Interference
System Suitability Parameters
0.0 2.5 5.0 7.5 10.0 12.5 15.0 17.5 20.0 22.5 min
0 50 100 150 200 250 300 350
mV
Detector A Ch1:330nm
4.
62
2/
222
60
05
7.
75
2/
128
89
11
11.
365
/53
41
62
5
12.
578
/20
49
83
For proposed method System suitability parameters like Number of Theoretical plates(N), Peak Asymmetry(As), Resolution(Rs), Tailing Factor included in Table 3.
Table 3: System Suitability Parameters
Parameters Oxybenzone Octocrylene Octinoxate Avobenzone Limits required
Number of
Theoretical plates 5899.31 7953.53 10672.41 9375.59 More than 2000
Rt 0.093 7.72 11.3 12.49 Less than 2
Resolution(Rs) 0 10.55 9.13 2.48 More than 2
Tailing Factor 1.261 1.09 1.06 1.35 Less than 2
Specificity: Blank and Placebo Interference
Specificity is the ability of the test method to measure an analyte without interference from other samples and the matrix components. In quantitative analysis, a method is called completely selective when it produces correct analytical signal. A method is called completely selective when it produces correct analytical results for mixture without any mutual interaction of the components. Blank (water), Placebo, Standard and Sample solutions were injected and interference was observed.
Figure 8: Blank chromatogram Figure 9: Placebo chromatogram
Precision
Repeatability
Preparation of standard solution
An accurately weighed quantity of 30.0 mg Oxybenzone, 30.0 mg Octocrylene 75.0 mg Octinoxate and 20.6 mg Avobenzone were transferred in 100.0 mL volumetric flask, dissolved with HPLC grade methanol and volume was made up to the mark with HPLC grade methanol, sonicated for 10 min. Stock Solution. From the prepared solution, pipette out 5.0 mL in 50.0 mL volumetric flask and volume was made up to the mark with HPLC grade methanol to make final concentrations: 30.0 ppm Oxybenzone, 75.0 ppm Octinoxate, 20.6 ppm Avobenzone and 30.0 ppm Octocrylene.
0.0 2.5 5.0 7.5 10.0 12.5 15.0 17.5 20.0 22.5 min -25
0 25 50 75 100 125 150 175 200 mV
Detector A:330nm
0.0 2.5 5.0 7.5 10.0 12.5 15.0 17.5 20.0 22.5 min -25
0 25 50 75 100 125 150 175 200 mV
Chirag Bhuva / Pharmacophore 2012, Vol. 3 (2), 130-155
The selected stationary phase was allowed to equilibrate with mobile phase till steady base line was obtained. Then 6 injections were injected and chromatograms were recorded. The observations are showed in Table 4.
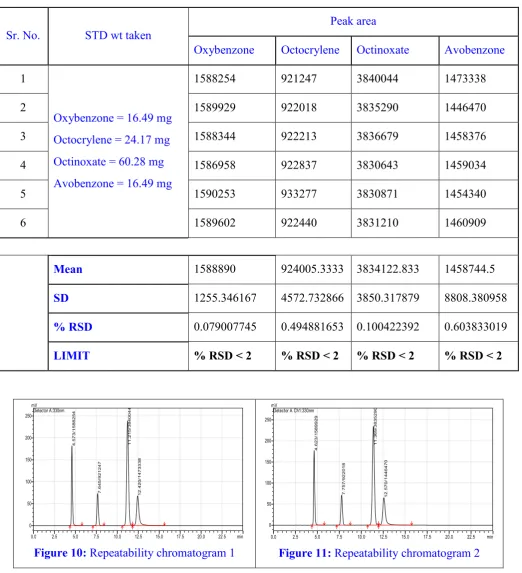
Table 4: Repeatability
Sr. No. STD wt taken
Peak area
Oxybenzone Octocrylene Octinoxate Avobenzone
1
Oxybenzone = 16.49 mg
Octocrylene = 24.17 mg Octinoxate = 60.28 mg
Avobenzone = 16.49 mg
1588254 921247 3840044 1473338
2 1589929 922018 3835290 1446470
3 1588344 922213 3836679 1458376
4 1586958 922837 3830643 1459034
5 1590253 933277 3830871 1454340
6 1589602 922440 3831210 1460909
Mean 1588890 924005.3333 3834122.833 1458744.5
SD 1255.346167 4572.732866 3850.317879 8808.380958
% RSD 0.079007745 0.494881653 0.100422392 0.603833019
LIMIT % RSD < 2 % RSD < 2 % RSD < 2 % RSD < 2
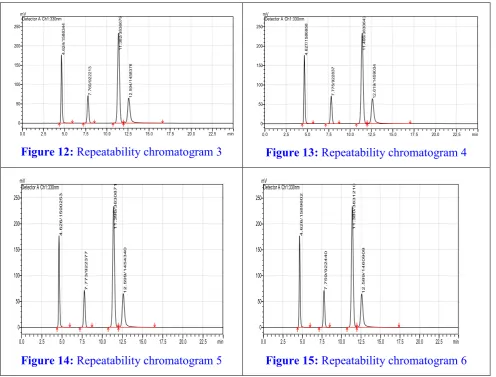
Figure 10: Repeatability chromatogram 1 Figure 11: Repeatability chromatogram 2
0.0 2.5 5.0 7.5 10.0 12.5 15.0 17.5 20.0 22.5 min 0
50 100 150 200 250 mV
Detector A:330nm
4
.57
3/
1
58
82
54
7
.64
5/
9
21
24
7
1
1.
2
15
/38
40
04
4
1
2.
4
20
/14
73
33
8
0.0 2.5 5.0 7.5 10.0 12.5 15.0 17.5 20.0 22.5 min 0
50 100 150 200 250 mV
Detector A Ch1:330nm
4
.62
3/
1
58
99
29
7
.75
7/
9
22
01
8
1
1.
3
69
/38
35
29
0
1
2.
5
70
/14
46
47
0.0 2.5 5.0 7.5 10.0 12.5 15.0 17.5 20.0 22.5 min 0 50 100 150 200 250 mV
Detector A Ch1:330nm
4 .62 4/ 1 58 83 44 7 .76 0/ 9 22 21 3 1 1. 3 82 /38 36 67 9 1 2. 5 94 /14 58 37 6
Figure 12: Repeatability chromatogram 3
0.0 2.5 5.0 7.5 10.0 12.5 15.0 17.5 20.0 22.5 min 0 50 100 150 200 250 mV
Detector A Ch1:330nm
4 .62 7/ 1 58 69 58 7 .77 5/ 9 22 83 7 1 1. 4 06 /38 30 64 3 1 2. 6 19 /14 59 03 4
Figure 13: Repeatability chromatogram 4
0.0 2.5 5.0 7.5 10.0 12.5 15.0 17.5 20.0 22.5 min
0 50 100 150 200 250 mV
Detector A Ch1:330nm
4 .62 6/ 1 59 02 53 7 .77 3/ 9 22 37 7 1 1. 3 96 /38 30 87 1 1 2. 5 99 /14 54 34 0
Figure 14: Repeatability chromatogram 5
0.0 2.5 5.0 7.5 10.0 12.5 15.0 17.5 20.0 22.5 min
0 50 100 150 200 250 mV
Detector A Ch1:330nm
4 . 62 6/ 1 58 96 02 7 . 75 9/ 9 22 44 0 1 1. 3 80 / 38 31 21 0 1 2. 5 89 / 14 60 90 9
Figure 15: Repeatability chromatogram 6
Inter Day Precision
Inter day precision was done carrying out the analysis of standard solutions at three different concentrations in the linearity range for three different days and % RSD was calculated.
Preparation of standard solutions
An accurately weighed quantity of 30.0 mg Oxybenzone, 30.0 mg Octocrylene 75.0 mg Octinoxate and 20.6 mg Avobenzone were transferred in 100.0 mL volumetric flask, dissolved with HPLC grade methanol and volume was made up to the mark with HPLC grade methanol, sonicated for 10 min.Stock Solution. From that stock solution pipette out 2, 3.4, 4.7 mL in six 50.0 mL volumetric flask individually and volume was made up to the mark with HPLC grade water to make final concentration: 12, 20, 28 μg/ mL.
Procedure
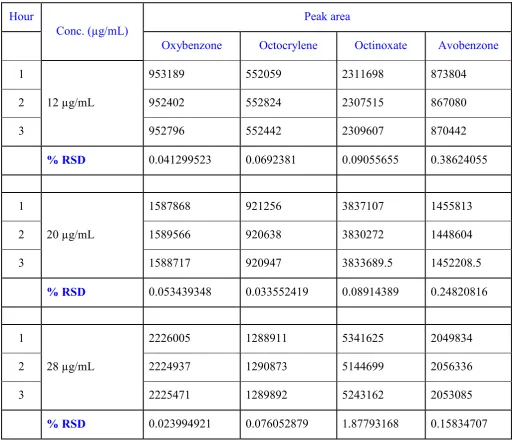
Chirag Bhuva / Pharmacophore 2012, Vol. 3 (2), 130-155 Table 5: Inter day precision
Hour
Conc. (µg/mL)
Peak area
Oxybenzone Octocrylene Octinoxate Avobenzone
1
12 µg/mL
953189 552059 2311698 873804
2 952402 552824 2307515 867080
3 952796 552442 2309607 870442
% RSD 0.041299523 0.0692381 0.09055655 0.38624055
1
20 µg/mL
1587868 921256 3837107 1455813
2 1589566 920638 3830272 1448604
3 1588717 920947 3833689.5 1452208.5
% RSD 0.053439348 0.033552419 0.08914389 0.24820816
1
28 µg/mL
2226005 1288911 5341625 2049834
2 2224937 1290873 5144699 2056336
3 2225471 1289892 5243162 2053085
% RSD 0.023994921 0.076052879 1.87793168 0.15834707
Intraday precision
Intraday precision was done carrying out the analysis of standard solutions at three different concentrations in the linearity range with in a one day and % RSD was calculated.
Preparation of standard solutions
An accurately weighed quantity of 30.0 mg Oxybenzone, 30.0 mg Octocrylene 75.0 mg Octinoxate and 20.6 mg Avobenzone were transferred in 100.0 mL volumetric flask, dissolved with HPLC grade methanol and volume was made up to the mark with HPLC grade methanol, sonicated for 10 min.-Stock
Solution. From that stock solution pipette out 2, 3.4, 4.7 mL in six 50.0 mL volumetric flask individually
and volume was made up to the mark with HPLC grade water to make final concentration: 12, 20, 28 μg/ mL.
Procedure
procedure was repeated by making new samples, after 3 and 6 hours with in a day, chromatograms were recorded and observations are shown in Table 6.
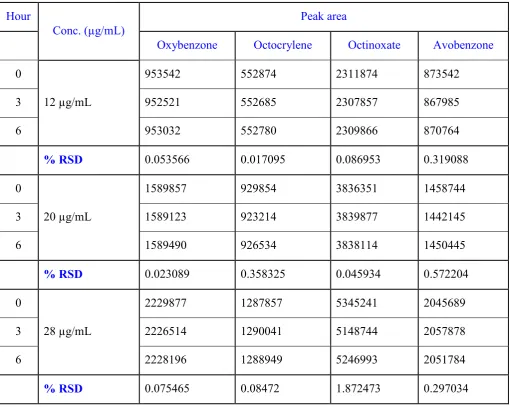
Table 6: Intraday precision
Hour
Conc. (µg/mL)
Peak area
Oxybenzone Octocrylene Octinoxate Avobenzone
0
12 µg/mL
953542 552874 2311874 873542
3 952521 552685 2307857 867985
6 953032 552780 2309866 870764
% RSD 0.053566 0.017095 0.086953 0.319088
0
20 µg/mL
1589857 929854 3836351 1458744
3 1589123 923214 3839877 1442145
6 1589490 926534 3838114 1450445
% RSD 0.023089 0.358325 0.045934 0.572204
0
28 µg/mL
2229877 1287857 5345241 2045689
3 2226514 1290041 5148744 2057878
6 2228196 1288949 5246993 2051784
% RSD 0.075465 0.08472 1.872473 0.297034
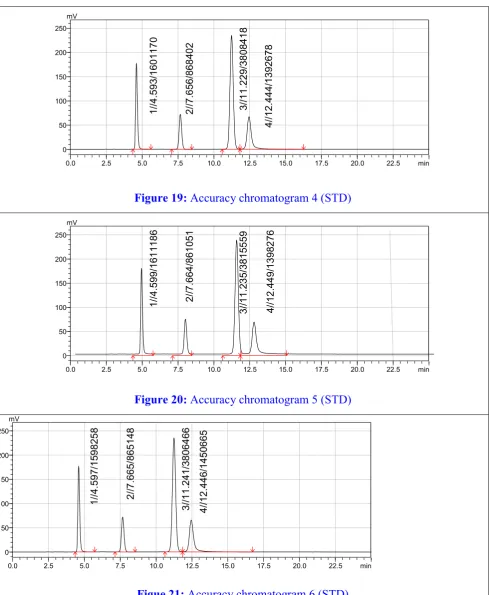
Accuracy
Accuracy of the proposed method was ascertained on the basis of recovery studies performed by standard addition method.
Preparation of sample
Chirag Bhuva / Pharmacophore 2012, Vol. 3 (2), 130-155 Table 7: Accuracy
STD wt taken Peak area
Oxybenzone = 30.2 mg Octocrylene = 30.2 mg
Octinoxate = 77.0 mg
Avobenzone = 20.7 mg
Oxybenzone Octocrylene Octinoxate Avobenzone
1594544 865377 3782540 1451587
1594540 865381 3782548 1451580
1596110 870672 3807070 1457659
1601170 868402 3808418 1392678
1611186 871051 3815559 1398276
1598258 865148 3806466 1450665
MEAN 1599301 867672 3800434 1433741
Wt added in base (mg)
Peak area of sample % Recovery
OXY OCL OXT AVO OXY OCL OXT AVO
80 %
1350507 719185 3142090 1155075
100.67 100.39 100.12 100.60 1353928 720842 3145156 1139761
1354548 719523 3146857 1139483
Mean 1352994 719850 3144701 1144773
100 %
1676788 991718 4035490 1445188
99.61 99.52 100.48 100.06 1676002 991755 4027142 1432195
1678167 994063 4038114 1426513
Mean 1676986 992512 4033582 1434632
120 %
1950821 1059882 4659162 1675425
100.06 100.12 100.13 100.14 1953767 1060362 4655817 1669327
1949839 1057832 4649275 1663578
Mean 1951476 1059359 4654751 1669443 100.06 100.12 100.13 100.14
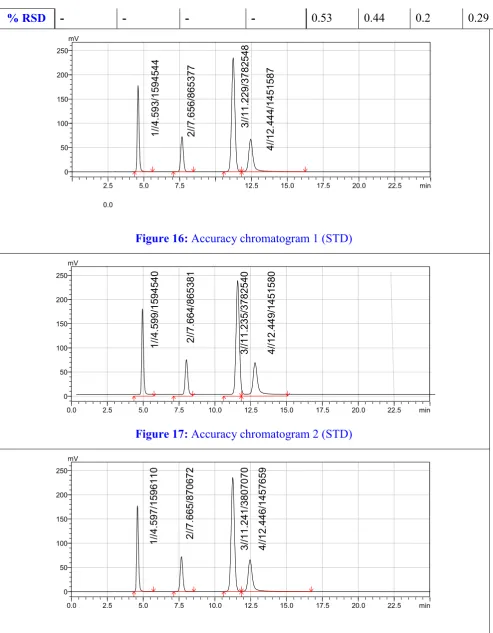
% RSD - - - - 0.53 0.44 0.2 0.29
Figure 16: Accuracy chromatogram 1 (STD)
Figure 17: Accuracy chromatogram 2 (STD)
Figure 18: Accuracy chromatogram 3 (STD)
2.5
0.0
5.0 7.5 12.5 15.0 17.5 20.0 22.5 min
0 50 100 150 200 250 mV 1// 4. 59 3/ 15 9 45 4 4 2// 7. 65 6/ 86 5 3 77 3// 11 .22 9/3 7 82 5 48 4// 12 .44 4/1 4 51 5 87
0.0 2.5 5.0 7.5 10.0 12.5 15.0 17.5 20.0 22.5 min
0 50 100 150 200 250 mV 1// 4. 59 9/ 15 9 45 4 0 0 2// 7. 66 4/ 86 5 38 1 1 3// 11 .23 5/3 7 82 5 40 4// 12 .44 9/1 4 51 5 80 0
0.0 2.5 5.0 7.5 10.0 12.5 15.0 17.5 20.0 22.5 min
Chirag Bhuva / Pharmacophore 2012, Vol. 3 (2), 130-155
Figure 19: Accuracy chromatogram 4 (STD)
Figure 20: Accuracy chromatogram 5 (STD)
Figue 21: Accuracy chromatogram 6 (STD)
0.0 2.5 5.0 7.5 10.0 12.5 15.0 17.5 20.0 22.5 min
0 50 100 150 200 250 mV 1// 4. 59 3/ 16 0 11 7 0 2// 7. 65 6/ 86 8 40 2 3// 11 .22 9/3 8 08 4 18 4// 12 .44 4/1 3 92 6 78
0.0 2.5 5.0 7.5 10.0 12.5 15.0 17.5 20.0 22.5 min
0 50 100 150 200 250 mV 1// 4. 59 9/ 16 1 11 8 6 6 2// 7. 66 4/ 86 1 05 1 1 3// 11 .23 5/3 8 15 5 59 4// 12 .44 9/1 3 98 2 76 6
0.0 2.5 5.0 7.5 10.0 12.5 15.0 17.5 20.0 22.5 min
Figure 22: Accuracy chromatogram 7 (80 %) Figure 23: Accuracy chromatogram 8 (80 %)
Figure 24: Accuracy chromatogram 9 (80 %) Figure 25: Accuracy chromatogram 10 (100 %)
Figure 26: Accuracy chromatogram 11 (100 %) Figure 27: Accuracy chromatogram 12 (100 %)
0.0 2.5 5.0 7.5 10.0 12.5 15.0 17.5 20.0 22.5 min 0 25 50 75 100 125 150 175 200 mV Detector A:330nm 4 . 60 8/ 1 35 05 07 7 . 79 6/ 7 19 18 5 1 1. 4 84 / 31 42 09 0 1 2. 7 56 / 11 55 07 5
0.0 2.5 5.0 7.5 10.0 12.5 15.0 17.5 20.0 22.5 min 0 25 50 75 100 125 150 175 200 mV Detector A:330nm 4 . 60 8/ 1 35 05 07 7 . 79 6/ 7 19 18 5 1 1. 4 84 / 31 42 09 0 1 2. 7 56 / 11 55 07 5
0.0 2.5 5.0 7.5 10.0 12.5 15.0 17.5 20.0 22.5 min 0 25 50 75 100 125 150 175 200 mV Detector A:330nm 4 . 64 3/ 1 35 45 48 7 . 90 9/ 7 19 52 3 1 1. 6 47 / 31 46 85 7 1 2. 9 24 / 11 39 48 3
0.0 2.5 5.0 7.5 10.0 12.5 15.0 17.5 20.0 22.5 min 0 50 100 150 200 250 mV Detector A:330nm 4 . 64 4/ 1 67 67 88 7 . 89 3/ 9 91 71 8 1 1. 6 18 / 40 35 49 0 1 2. 8 94 / 14 45 18 8
0.0 2.5 5.0 7.5 10.0 12.5 15.0 17.5 20.0 22.5 min 0 50 100 150 200 250 mV Detector A:330nm 4 . 64 7/ 1 67 60 02 7 . 92 9/ 9 91 75 5 1 1. 6 41 / 40 27 14 2 1 2. 9 03 / 14 32 19 5
Chirag Bhuva / Pharmacophore 2012, Vol. 3 (2), 130-155
Figure 28: Accuracy chromatogram 13 (120 %) Figure 29: Accuracy chromatogram 14 (120 %)
Figure 30: Accuracy chromatogram 15 (120 %)
RUGGEDNESS Preparation of Sample
An accurately weighed quantity of 30.0 mg Oxybenzone, 30.0 mg Octocrylene, 75.0 mg Octinoxate and 20.6 mg Avobenzone were transferred in 100.0 mL volumetric flask, dissolved with HPLC grade methanol and volume was made up to the mark with HPLC grade methanol, sonicated for 10 min. Stock Solution. From the prepared solution, pipette out 5.0 mL in 50.0 mL volumetric flask and volume was made up to the mark with HPLC grade methanol to make final concentrations: 30.0 ppm Oxybenzone, 75.0 ppm Octinoxate, 20.6 ppm Avobenzone and 30.0 ppm Octocrylene.
Procedure
The selected stationary phase was allowed to equilibrate with mobile phase till steady base line was obtained. The ruggedness of the proposed method has been verified by analyzing the six injections used for method precision by two different analysts, using two different instruments and on different days. The ruggedness results were compared with method precision data. The overall mean, standard deviation (SD) and % RSD of the assay values are shown in table 8 and table 9.
0.0 2.5 5.0 7.5 10.0 12.5 15.0 17.5 20.0 22.5 min 0 50 100 150 200 250 300 mV Detector A:330nm 4 . 66 5/ 1 95 08 21 8 . 00 1/ 1 05 98 82 1 1. 7 60 / 46 59 16 2 1 3. 0 27 / 16 75 42 5
0.0 2.5 5.0 7.5 10.0 12.5 15.0 17.5 20.0 22.5 min 0 50 100 150 200 250 300mVDetector A:330nm
4 . 66 9/ 1 95 37 67 8 . 02 2/ 1 06 03 62 1 1. 8 11 / 46 55 81 7 1 3. 0 86 / 16 69 32 7
0.0 2.5 5.0 7.5 10.0 12.5 15.0 17.5 20.0 22.5 min
Table 8: Ruggedness (Analysis 1 Result)
Analysis 1 Result
Day 1, Analyst 1, Instrument 1
Sr. No. Oxybenzone Octocrylene Octinoxate Avobenzone
Rt Peak area Rt Peak area Rt Peak area Rt Peak area
1 4.62 1608445 7.74 933293 11.34 3877974 12.54 1522755
2 4.62 1607963 7.73 930283 11.33 3892070 12.53 1495022
3 4.62 1604563 7.74 932936 11.34 3886629 12.53 1485779
4 4.63 1608958 7.74 930478 11.33 3878958 12.53 1464883
5 4.63 1607848 7.73 933199 11.32 3877817 12.51 1465169
6 4.63 1607283 7.73 930624 11.32 3876033 12.51 1457748
MEAN 4.62 1607510 7.74 931802.17 11.33 3881580.17 12.52 1481892.6
SD 0.00 1550.92 0.00 1477.07 0.01 6329.93 0.01 24532.38
% RSD 0.10 0.10 0.06 0.16 0.07 0.16 0.09 1.66
Table 9: Ruggedness (Analysis 2 Result)
Analysis 2 Result
Day 2, Analyst 2, Instrument 2
Sr. No.
Oxybenzone Octocrylene Octinoxate Avobenzone
Rt Peak area Rt Peak area Rt Peak area Rt Peak area
1 4.63 1611026 7.72 929215 11.31 3865412 12.50 1477528
2 4.67 1605411 7.71 925860 11.29 3875676 12.48 1472493
3 4.63 1599133 7.72 929195 11.30 3874330 12.49 1477786
4 4.62 1604419 7.72 932490 11.33 3874159 12.52 1475444
5 4.63 1599509 7.74 929558 11.34 3876234 12.53 1477377
Chirag Bhuva / Pharmacophore 2012, Vol. 3 (2), 130-155
MEAN 4.63 1603861.67 7.73 929473.83 11.32 3871826.83 12.51 1474727.5
SD 0.02 4367.62 0.02 2163.97 0.02 5131.75 0.02 3964.61
% RSD 0.36 0.27 0.22 0.23 0.19 0.13 0.19 0.27
OVER ALL MEAN
4.63 1605685.83 7.73 930638 11.32 3876703.50 12.52 1478310.1
OVER
ALL SD 0.01 2959.27 0.01 1820.52 0.01 5730.84 0.02 14248.49
OVER ALL
% RSD
0.23 0.18 0.14 0.20 0.13 0.15 0.14 0.96
Robustness
The robustness of the method was evaluated by deliberately varying the chromatographic conditions viz. composition of organic phase in mobile phase, flow rate, column oven temperature and change in wavelength of detection. For that STD (normal chromatographic condition) and after change (alteration in chromatography) solutions were injected. The amount of sunscreen lotion was calculated from STD (normal chromatographic condition) and After Change (alteration in chromatography). The results were compared and results are tabulatedindicated that the method is robust under varied conditions.
Table 10: Set 1 - Change in column temperature by + 5.0 °C (30 ºC)
Sr. No Results
Peak area Retention time %
Obser-vation
OXY OCL OXT AVO OXY OCL OXT AVO
1 STD 1597651 926458 3871377 1460465 4.62 7.74 11.33 12.52 100.0 %
2 After 1597244 926541 3871654 1460545 4.6 7.75 11.29 12.46
-
3 Change 1595841 926874 3865445 1460874 4.61 7.74 11.3 12.44
Table 11: Set 2 - Change in column temperature by - 5.0 °C (20 ºC)
Sr. No Results
Peak area Retention time %
Obser-vation
2 After 1597548 926548 3871987 1460254 4.66 7.77 11.34 12.57 -
3 Change 1597548 926874 3871258 1460123 4.65 7.76 11.36 12.59
Table 12: Set 3 - Change in flow rate by +0.1 mL/min (1.1 mL/min)
Sr. No Results
Peak area Retention time %
Obser-vation
OXY OCL OXT AVO OXY OCL OXT AVO
1 STD 1597651 926458 3871377 1460465 4.62 7.74 11.33 12.52 100.0 %
2 After 1596658 926154 3870654 1460258 4.6 7.71 11.28 12.5
-
3 Change 1596745 926254 3870325 1459874 4.59 7.72 11.3 12.49
Table 13: Set 4 - Change in flow rate by - 0.1 mL/min (0.9 mL/min)
Sr. No Results Peak area Retention time
% Obser-vation
OXY OCL OXT AVO OXY OCL OXT AVO
1 STD 1597651 926458 3871377 1460465 4.62 7.74 11.33 12.52 100.0 %
2 After 1598456 924578 3870632 1458478 4.65 7.76 11.29 12.48
-
3 Change 1598471 924562 3870654 1458689 4.64 7.77 11.31 12.49
Table 14: Set 5 - Change in wavelength by + 2.0 nm (332 nm)
Sr. No Results
Peak area Retention time %
Obser-vation
OXY OCL OXT AVO OXY OCL OXT AVO
1 STD 1597651 926458 3871377 1460465 4.62 7.74 11.33 12.52 100.0 %
2 After 1596547 925874 3869548 1459548 4.62 7.74 11.33 12.52
-
3 Change 1596987 925148 3869487 1459423 4.62 7.74 11.33 12.52
Table 15: Set 6 - Change in wavelength by - 2.0 nm (228 nm)
Sr. No Results
Peak area Retention time %
Obser-vation
Chirag Bhuva / Pharmacophore 2012, Vol. 3 (2), 130-155
2 After 1596541 925874 3869541 1459874 4.62 7.74 11.33 12.52
-
3 Change 1596548 925841 3869523 1459587 4.62 7.74 11.33 12.52
Table 16: Set 7 - Change in organic phase composition in mobile Phase by MeOH: H2O (92:08)
Sr. No Results
Peak area Retention time %
Obser-vation
OXY OCL OXT AVO OXY OCL OXT AVO
1 STD 1597651 926458 3871377 1460465 4.62 7.74 11.33 12.52 100.0 %
2 After 1599874 927586 3872548 1464265 4.65 7.75 11.36 12.54
-
3 Change*\ 1599632 927584 3872548 1464875 4.65 7.77 11.38 11.53
Table 17: Set 8 - Change in organic phase composition in mobile Phase by MeOH: H2O (88:12)
Sr. No Results
Peak area Retention time %
Obser-vation
OXY OCL OXT AVO OXY OCL OXT AVO
1 STD 1597651 926458 3871377 1460465 4.62 7.74 11.33 12.52 100.0 %
2 After 1596487 927485 3870648 1459875 4.59 7.71 11.28 12.48
-
3 Change 1596325 927412 3870951 1459254 4.58 7.72 11.3 11.49
Application of the Proposed Method in Marketed Formulation Preparation of sample
An accurately weighed quantity of sunscreen lotion equivalent to 30.0 mg Oxybenzone, 30.0 mg Octocrylene, 75.0 mg Octinoxate and 20.6 mg Avobenzone were transferred in 100.0 mL volumetric flask, dissolved with HPLC grade methanol and volume was made up to the mark with HPLC grade methanol, sonicated for 10 min (50 μg/mL ) and filtered through 0.2 μ nylon filter. Six sample solutions were injected, after equilibration of stationary phase, the chromatograms were recorded. The content of sunscreen lotion were calculated by comparing the peak area of sample with that of standard using following formula,
Au Wstd dilution 1
% Label Claim = --- x --- x --- x --- x P As dilution Wcrm L .C.
As = Peak area of Standard
Wstd = Wt (mg) of STD.
Wcrm = Wt of cream
P = Potency of Standard (% purity)
L.C. = Label Claim in mg of cream
Table 18: Application of the proposed method in marketed formulation (STD)
Sr. No Weight of standard
Peak area of standard
Oxybenzone Octocrylene Octinoxate Avobenzone
1 1594991 868285 3861902 1395401
2 Oxybenzone = 30.0 mg 1588187 864630 3853488 1390401
3 Octocrylene = 30.1 mg 1587105 864809 3846455 1385371
4 Octinoxate = 77.4 mg 1588146 863935 3845529 1371623
5 Avobenzone = 20.7 mg 1588654 865412 3850458 1385426
6 1590245 866254 3850658 1389548
Mean 1589554.67 865554.167 3851415 1386295
SD 2852.97043 1549.09566 5916.2487 8089.95676
% RSD 0.17948237 0.17897154 0.1536123 0.58356676
Table 19: Application of the proposed method in marketed formulation (Sample)
Weight of Sample
Peak area of sample % Label claim
OXY OCL OXT AVO OXY OCL OXT AVO
0.1005 mg of
Sunscreen Lotion
1642169 870523 3883971 1172037 99.87 100.26 100.57 99.95 1642884 870302 3881997 1172306 100.34 100.66 100.74 100.33 1649780 872004 3896708 1167818 100.83 100.83 101.31 100.31
1647376 870623 3889289 1178967 100.62 100.77 101.14 102.29 1645875 870654 3886854 1178541 100.49 100.61 100.95 101.23 1644875 870354 3885748 1178548 100.33 100.47 100.91 100.93
Mean 1645493 870743 3887428 1174703 100.41 100.60 100.94 100.84
Chirag Bhuva / Pharmacophore 2012, Vol. 3 (2), 130-155
0.0 2.5 5.0 7.5 10.0 12.5 15.0 17.5 20.0 22.5 min
0 50 100 150 200 250
mV
Detector A:330nm
4.
63
0/
16
42
16
9
7.
83
4/
87
05
23 11
.5
36
/3
88
39
71
12
.8
14
/1
17
20
37
Figure 31: Application of the proposed method in marketed formulation.
RESULTS AND DISCUSSION
Clinically, Oxybenzone, Octocrylene, Octinoxate and Avobenzone used in sun-screen formulation for prevention against A & UV-B rays. No specific method on HPLC is reported for simultaneous estimation of Oxybenzone, Octocrylene, Octinoxate and Avobenzone in sun-screen lotion formulation. Hence, the project was undertaken in order to develop simple, accurate and rapid analytical methods for Simultaneous estimation of Oxybenzone, Octocrylene, Octinoxate and Avobenzone in sun-screen lotion.
The analysis was performed using Waters, 5 μ, C18 column (250 X 4.6mm), injection volume 20 μL and Methanol: Water (90:10) with gradient elution used as mobile phase which shows sharp peak when detected at same wavelength 330 nm. The linearity range of Oxybenzone, Octocrylene, Octinoxate and Avobenzone were found to be 12 μg/mL to 28 µg/mL.
Validation
Validation was performed to assure the reliability of the proposed method and was carried out as per ICH guidelines for the following parameters.
Accuracy
Accuracy of the proposed method was ascertained on the basis of recovery studies
recoveries of Oxybenzone, Octocrylene, Octinoxate and Avobenzone were observed to be in the range of 98 to 102 %. (Table 6)
Precision
Replicate estimation of Oxybenzone, Octocrylene, Octinoxate and Avobenzone in formulation analyzed by proposed method has yielded quite acceptable results. SD and RSD of series of measurement were found to satisfactory as shown and hence the proposed method was found to be precise. (Table 4, 5)
Linearity and Range
For Oxybenzone, Octocrylene, Octinoxate and Avobenzone the percent label claim vs. area under curve plot shows a linear relationship with correlation coefficient very close to 1. From linearity Study it can be concluded that sun-screen lotion having Oxybenzone, Octocrylene, Octinoxate and Avobenzone can be measured at concentration range 12 to 28 µg/mL in a formulation. (Table 2)
Ruggedness
The ruggedness of the proposed method has been verified by analyzing the six samples of same batch used for method precision by two different analysts using two different instruments, by different analytes.
for Oxybenzone, Octocrylene, Octinoxate and Avobenzone. This indicates the ruggedness of the method in the hands of different analysts.
Robustness
Deliberately varying the chromatographic conditions like flow rate ± 0.2 mL, column oven temperature by 5 oC units. The results of estimation for Oxybenzone, Octocrylene, Octinoxate and Avobenzone were very much reproducible with overall % label claim and overall S.D shown in (Table 9 to 16).
ACKNOWLEDGEMENT
The author thankful to Shree ICPA Health Products LTD., Ankleswer, Surat, for providing opportunity of research work, providing necessary chemicals, instruments and additional help for free of cost.
REFERENCES
1. Snyder, LR; Kirkland, JJ and Glajach JM (1997), “Practical HPLC Method Development”, 2nd Ed., Wiley-Inter science publication, USA, 1-2, 685-686. 2. Sethi, PD (2001), “HPTLC – High
Performance Thin Layer Chromatography”, 1st Ed., CBS
Publishers, New Delhi, 6-12, 69-63.
3. Mayer, VR “Practical High Performance Liquid Chromatography”,
4th Ed., John Wiley Sons, New York, 4-26.
4. Watson, DG (1998), “Pharmaceutical Analysis Modern Instrumentation Method & Techniques”, 2nd Ed., Churchill Livinstone, London, 237-270.
5. Rouessac, F and Rouessac, A (2008),
“Chemical Analysis Instrumentation Method & Techniques”, Wiley Publication, USA, 69-89.
6. Fifieild, FW and Kewey, D (2002),
“Principles & Practice of Analysis Chemistry”, 5th Ed., Blackwell Sciences, Inc, USA, 80-170.
Definition and terminology (CPMP III/5626/94)”, Geneva, Switzerland. 8. ICH–Guidelines Q2B (1996),
“Validation of Analytical Procedures:
Methodology (CPMP/ICH/281/95)”,
Geneva, Switzerland.
9. (2007),“United States Pharmacopoeia
(30) and National Formulary (27), the United States Pharmacopoeia Convention, 24th Asian Ed., 184, 1259, 1260, 1279.
10.(2005), USP 28, NF 23, United State Pharmacopeial Convention, Asian Edition, 2389.
11.(2000), “Guidance for Industry: Analytical Procedures and Methods Validation (Draft guidance)”, Food and Drug Administration. 501.