S H O R T R E P O R T
Open Access
The effects of caffeinated and decaffeinated
coffee on sex hormone-binding globulin and
endogenous sex hormone levels: a randomized
controlled trial
Nicole M Wedick
1*, Christos S Mantzoros
2,3, Eric L Ding
1,4, Aoife M Brennan
3, Bernard Rosner
4,5, Eric B Rimm
1,4,6,
Frank B Hu
1,4,6and Rob M van Dam
1,7Abstract
Background:Findings from observational studies suggest that sex hormone-binding globulin (SHBG) and
endogenous sex hormones may be mediators of the putative relation between coffee consumption and lower risk of type 2 diabetes. The objective of this study was to evaluate the effects of caffeinated and decaffeinated coffee on SHBG and sex hormone levels.
Findings:After a two-week run-in phase with caffeine abstention, we conducted an 8-week parallel-arm
randomized controlled trial. Healthy adults (n = 42) were recruited from the Boston community who were regular coffee consumers, nonsmokers, and overweight. Participants were randomized to five 6-ounce cups of caffeinated or decaffeinated instant coffee or water (control group) per day consumed with each meal, morning, and mid-afternoon. The main outcome measures were SHBG and sex hormones [i.e., testosterone, estradiol,
dehydroepiandrosterone sulfate].
No significant differences were found between treatment groups for any of the studied outcomes at week 8. At 4 weeks, decaffeinated coffee was associated with a borderline significant increase in SHBG in women, but not in men. At week 4, we also observed several differences in hormone concentrations between the treatment groups. Among men, consumption of caffeinated coffee increased total testosterone and decreased total and free estradiol. Among women, decaffeinated coffee decreased total and free testosterone and caffeinated coffee decreased total testosterone.
Conclusions:Our data do not indicate a consistent effect of caffeinated coffee consumption on SHBG in men or women, however results should be interpreted with caution given the small sample size. This is the first
randomized trial investigating the effects of caffeinated and decaffeinated coffee on SHBG and sex hormones and our findings necessitate further examination in a larger intervention trial.
Keywords:Coffee, Sex hormones, Randomized trial
* Correspondence:[email protected]
1
Department of Nutrition, Harvard School of Public Health, 665 Huntington Ave, Boston, MA 02115, USA
Full list of author information is available at the end of the article
Introduction
Coffee consumption has been consistently associated with a lower risk of type 2 diabetes (T2DM), but the underlying mechanisms remain unclear. Data from ob-servational studies suggest that sex hormone-binding globulin (SHBG) and endogenous sex hormones may modulate glycemia and risk of T2DM in men and women [1-5]. Caffeinated coffee consumption has been found to be associated with higher SHBG levels in data from cross-sectional studies in women [2,6-8]. It has been hypothesized that SHBG may be an intermediate pathway to explain the putative effect of coffee on lower-ing the risk of T2DM [3].
We conducted an 8-week parallel-arm randomized trial to determine the effects of caffeinated and decaffei-nated coffee on risk factors for T2DM. To our know-ledge, there have been no randomized trials to investigate this research question.
Participants and methods
The details of this study have been previously described [9]. Briefly, eligible participants were overweight (body mass index 25–35 kg/m2), nonsmoking men and women aged 18 years or older who habitually consumed coffee (at least two cups per day). Exclusion criteria included the presence of diabetes, heart disease, stroke, hyperten-sion, alcoholism or substance abuse, abnormal hepatic or renal function, gastro-esophageal reflux disease, a medical history of ulcers, or women planning a preg-nancy or breastfeeding. Exclusions were made for indivi-duals on medications for chronic health conditions.
Sixty-five adults were screened of which 11 were ineli-gible and 9 withdrew from the study prior to randomization. Three individuals did not continue the study after the baseline visit and were not included in the current analysis. The final study population included 14 men and 28 women. The study was approved by the institutional review boards of the Beth Israel Deaconess Medical Center and the Harvard School of Public Health and all participants provided written informed consent. The clinical trial registration number is NCT00305097.
After two weeks of caffeine abstention, participants attended the baseline visit in the morning after fasting overnight for at least 12 hours. Participants were rando-mized to either caffeinated coffee, decaffeinated coffee, or no coffee (control) treatment groups. Treatment assignments for the coffee arms were blinded to the study participants, investigators, and laboratory staff. Participants in the coffee treatment groups were given five two-gram portions of instant coffee per day (caffein-ated or decaffein(caffein-ated Nestlé’s Taster’s ChoiceW) to be mixed with approximately 6 ounces of boiling water and consumed with every meal and morning and mid-afternoon. Non-caloric sweetener and non-dairy creamer
were also provided. Participants in the control group were instructed to drink the equivalent amount of water at the same intervals throughout the day.
At baseline, week 4, and week 8, the study visits included a physical examination, anthropometric mea-surements, and a fasting blood draw. Sex hormone-binding globulin and all other endogenous sex hormones were measured via Access chemiluminescent immuno-assay (Beckman Coulter, Fullerton, CA). Free testoster-one and free estradiol were calculated using the Sodergard formula which is based on the law of mass ac-tion and assumpac-tions of equilibrium binding [10].
All analyses were performed separately for men and women. Using general linear models, we evaluated the change from baseline in SHBG, testosterone (total and free), estradiol (total and free), testosterone to estradiol ratio, and DHEAs regressed on treatment group as a main effect with baseline log values of the dependent variable and age as additional covariates. Both covariates were grand mean centered to improve the interpretabil-ity of the estimates. Because SHBG and sex hormones did not follow a normal distribution, the variables were log-transformed and subsequently back-transformed to yield geometric means. Differences between caffeinated and decaffeinated coffee compared with the control group were based on linear contrasts. The adjusted geo-metric means with standard errors were reported by treatment, and 95% confidence intervals (CI) were com-puted. In addition, we calculated the difference between the treatment groups versus control for change from baseline. This yielded a ratio (or percentage when sub-tracting the value one and multiplying by 100), given the principles of logged numbers.
Statistical significance was evaluated at an alpha level of 0.05. The Statistical Analysis System version 9.1.3 was used for all analyses (SAS Institute, Cary, NC).
Results
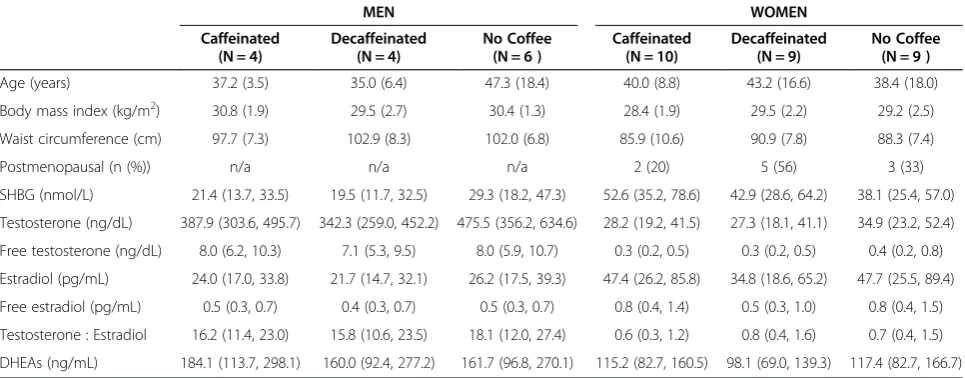
In men, mean concentrations were 25.3 nmol/L for SHBG, 411.3 ng/dL for testosterone, 8.0 ng/dL for free testosterone, 24.9 pg/mL for estradiol, 0.5 pg/mL for free estradiol, and 194.9 ng/mL for DHEAs. In women, mean concentrations were 51.5 nmol/L for SHBG, 35.9 ng/dL for testosterone, 0.5 ng/dL for free testosterone, 63.2 pg/mL for estradiol, 1.0 pg/mL for free estradiol, and 133.7 ng/mL for DHEAs. The baseline characteristics of the study population are shown in Table 1 according to treatment group. Ten women were postmenopausal. The average age was 40 years for both men (range 23–72 years) and women (18–69 years).
Mean body mass index was 30.3 kg/m2 for men and
after the 4-week visit. Four non-serious adverse events were reported during the course of the intervention.
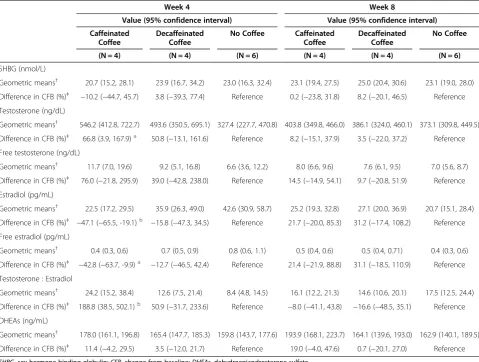
Adjusted geometric means followed by percent change from baseline estimates for the endpoints are shown for men (Table 2) and women (Table 3). At the final study visit (week 8) there were no significant differences for any of the outcomes. In addition, we did not observe an effect of coffee intake on SHBG levels in men, although a bor-derline significant increase for decaffeinated coffee was observed among women [difference in change from base-line (CFB): 38%; 95% CI: 1%, 88%; p = 0.04] compared with consuming no coffee at week 4. In contrast, several significant differences between the treatment groups were found at week 4. Among men, consumption of caffeinated coffee increased total testosterone (CFB: 67%; 95% CI: 4%, 168%; p = 0.04) and decreased total and free estradiol (CFB total: -47%; 95% CI: -19%, -65%; p = 0.01 and CFB free: -43%; 95% CI: -10%, -64%; p = 0.02). Among women, decaffeinated coffee decreased total and free testosterone (CFB total: -60%; 95% CI: -24%, -79%; p = 0.01 and CFB free: -68%: 95% CI: -26%, -86%; p = 0.01) and caffeinated coffee decreased total testosterone (p = 0.04). The ratio of testosterone to estradiol, a potential marker for aromatase activity, was significantly increased in men in the caffein-ated coffee group at week 4 (CFB: 189%; 95% CI: 39%, 502%; p = 0.01) whereas no significant differences were observed for women. We did not observe any significant effects for DHEAs in either men or women.
Discussion
In this randomized controlled trial with a caffeinated and decaffeinated coffee intervention, we did not find evidence of a consistent effect on SHBG levels in
overweight men or women. All significant effects for SHBG and the hormone measurements were limited to the week 4 visit with no significant effects observed at the time of the final week 8 visit.
Previous studies on coffee or caffeine consumption in relation to SHBG and sex hormone concentrations all had a cross-sectional design and have been almost exclu-sively conducted in women. The Additional file 1: Table S1 shows the characteristics and findings from these studies. Our results for caffeinated coffee and SHBG are consistent with two previous cross-sectional studies [11,12] which did not find an association with consump-tion of caffeine or caffeinated coffee, whereas other stud-ies did detect direct associations [2,3,6-8]. In contrast to our findings for caffeinated coffee, we found slightly ele-vated SHBG levels in the decaffeinated group as com-pared with the control group at week 4 in women, but this observation was limited to women and not observed at week 8 and may well represent a chance finding. Few studies have specifically studied decaffeinated coffee, but the Women’s Health Study [3] observed no association between decaffeinated coffee and SHBG.
Our results in women of a decrease in total testoster-one levels at week 4 in both caffeinated and decaffei-nated arms are not consistent with the lack of association between coffee consumption and testoster-one in previous observational studies [2,3,7]. We did not observe a significant effect of coffee consumption on es-tradiol concentrations among the women in our trial. This finding agrees with four cross-sectional studies that also found no association between caffeinated coffee consumption and estradiol [3,6,7,11]. In contrast, an in-verse association between coffee consumption and luteal
Table 1 Baseline characteristics for men and women by treatment group
MEN WOMEN
Caffeinated Decaffeinated No Coffee Caffeinated Decaffeinated No Coffee
(N = 4) (N = 4) (N = 6 ) (N = 10) (N = 9) (N = 9 )
Age (years) 37.2 (3.5) 35.0 (6.4) 47.3 (18.4) 40.0 (8.8) 43.2 (16.6) 38.4 (18.0)
Body mass index (kg/m2) 30.8 (1.9) 29.5 (2.7) 30.4 (1.3) 28.4 (1.9) 29.5 (2.2) 29.2 (2.5)
Waist circumference (cm) 97.7 (7.3) 102.9 (8.3) 102.0 (6.8) 85.9 (10.6) 90.9 (7.8) 88.3 (7.4)
Postmenopausal (n (%)) n/a n/a n/a 2 (20) 5 (56) 3 (33)
SHBG (nmol/L) 21.4 (13.7, 33.5) 19.5 (11.7, 32.5) 29.3 (18.2, 47.3) 52.6 (35.2, 78.6) 42.9 (28.6, 64.2) 38.1 (25.4, 57.0)
Testosterone (ng/dL) 387.9 (303.6, 495.7) 342.3 (259.0, 452.2) 475.5 (356.2, 634.6) 28.2 (19.2, 41.5) 27.3 (18.1, 41.1) 34.9 (23.2, 52.4)
Free testosterone (ng/dL) 8.0 (6.2, 10.3) 7.1 (5.3, 9.5) 8.0 (5.9, 10.7) 0.3 (0.2, 0.5) 0.3 (0.2, 0.5) 0.4 (0.2, 0.8)
Estradiol (pg/mL) 24.0 (17.0, 33.8) 21.7 (14.7, 32.1) 26.2 (17.5, 39.3) 47.4 (26.2, 85.8) 34.8 (18.6, 65.2) 47.7 (25.5, 89.4)
Free estradiol (pg/mL) 0.5 (0.3, 0.7) 0.4 (0.3, 0.7) 0.5 (0.3, 0.7) 0.8 (0.4, 1.4) 0.5 (0.3, 1.0) 0.8 (0.4, 1.5)
Testosterone : Estradiol 16.2 (11.4, 23.0) 15.8 (10.6, 23.5) 18.1 (12.0, 27.4) 0.6 (0.3, 1.2) 0.8 (0.4, 1.6) 0.7 (0.4, 1.5)
DHEAs (ng/mL) 184.1 (113.7, 298.1) 160.0 (92.4, 277.2) 161.7 (96.8, 270.1) 115.2 (82.7, 160.5) 98.1 (69.0, 139.3) 117.4 (82.7, 166.7)
n/a, not applicable; SHBG, sex hormone-binding globulin; DHEAs, dehydroepiandrosterone sulfate.
estradiol and luteal free estradiol was observed among premenopausal women [2] and a direct association was observed for follicular estradiol in another study among premenopausal women [12]. It is currently unclear whether the discrepancy between our findings and previ-ous studies is due to the limited power or duration of our trial or methodological limitations of the cross-sectional studies.
As mentioned previously, little data has been pub-lished on coffee consumption and SHBG or sex hor-mones in men. Our finding that caffeinated coffee, but not decaffeinated coffee, significantly increased total tes-tosterone and decreased both total and free estradiol after 4 weeks suggests that caffeine may act as an aroma-tase (or CYP19) inhibitor. One intervention trial [13] found that consumption of two cups of instant coffee
had no acute effect on testosterone or estradiol concen-trations after 30 minutes.
This is the first randomized controlled trial investigat-ing the effects of caffeinated and decaffeinated coffee on SHBG and sex hormones. Attrition was low among par-ticipants and non-fasting blood samples measured for caffeine and its major metabolites at the 6-week visit indicated that compliance was high. Our study also had several limitations that need to be considered. Most not-ably, our study has a small sample size which may have limited our ability to detect modest effects on SHBG and sex hormone levels. Thus, findings should be inter-preted with caution and require confirmation in larger trials. In addition, given the small sample size, stratifying analyses by menopausal status was not appropriate. In-clusion of age in the analysis of covariance models was
Table 2 Sex hormone-binding globulin and endogenous sex hormones by treatment group at week 4 and week 8 in men
Week 4 Week 8
Value (95% confidence interval) Value (95% confidence interval)
Caffeinated Decaffeinated No Coffee Caffeinated Decaffeinated No Coffee
Coffee Coffee Coffee Coffee
(N = 4) (N = 4) (N = 6) (N = 4) (N = 4) (N = 6)
SHBG (nmol/L)
Geometric means† 20.7 (15.2, 28.1) 23.9 (16.7, 34.2) 23.0 (16.3, 32.4) 23.1 (19.4, 27.5) 25.0 (20.4, 30.6) 23.1 (19.0, 28.0) Difference in CFB (%)‡ −10.2 (−44.7, 45.7) 3.8 (−39.3, 77.4) Reference 0.2 (−23.8, 31.8) 8.2 (−20.1, 46.5) Reference Testosterone (ng/dL)
Geometric means† 546.2 (412.8, 722.7) 493.6 (350.5, 695.1) 327.4 (227.7, 470.8) 403.8 (349.8, 466.0) 386.1 (324.0, 460.1) 373.1 (309.8, 449.5) Difference in CFB (%)‡ 66.8 (3.9, 167.9)a 50.8 (−13.1, 161.6) Reference 8.2 (−15.1, 37.9) 3.5 (−22.0, 37.2) Reference Free testosterone (ng/dL)
Geometric means† 11.7 (7.0, 19.6) 9.2 (5.1, 16.8) 6.6 (3.6, 12.2) 8.0 (6.6, 9.6) 7.6 (6.1, 9.5) 7.0 (5.6, 8.7)
Difference in CFB (%)‡ 76.0 (−21.8, 295.9) 39.0 (−42.8, 238.0) Reference 14.5 (−14.9, 54.1) 9.7 (−20.8, 51.9) Reference Estradiol (pg/mL)
Geometric means† 22.5 (17.2, 29.5) 35.9 (26.3, 49.0) 42.6 (30.9, 58.7) 25.2 (19.3, 32.8) 27.1 (20.0, 36.9) 20.7 (15.1, 28.4) Difference in CFB (%)‡ −47.1 (−65.5, -19.1)b −15.8 (−47.3, 34.5) Reference 21.7 (−20.0, 85.3) 31.2 (−17.4, 108.2) Reference Free estradiol (pg/mL)
Geometric means† 0.4 (0.3, 0.6) 0.7 (0.5, 0.9) 0.8 (0.6, 1.1) 0.5 (0.4, 0.6) 0.5 (0.4, 0.71) 0.4 (0.3, 0.6)
Difference in CFB (%)‡ −42.8 (−63.7, -9.9)a −12.7 (−46.5, 42.4) Reference 21.4 (−21.9, 88.8) 31.1 (−18.5, 110.9) Reference Testosterone : Estradiol
Geometric means† 24.2 (15.2, 38.4) 12.6 (7.5, 21.4) 8.4 (4.8, 14.5) 16.1 (12.2, 21.3) 14.6 (10.6, 20.1) 17.5 (12.5, 24.4) Difference in CFB (%)‡ 188.8 (38.5, 502.1)b 50.9 (−31.7, 233.6) Reference −8.0 (−41.1, 43.8) −16.6 (−48.5, 35.1) Reference DHEAs (ng/mL)
Geometric means† 178.0 (161.1, 196.8) 165.4 (147.7, 185.3) 159.8 (143.7, 177.6) 193.9 (168.1, 223.7) 164.1 (139.6, 193.0) 162.9 (140.1, 189.5) Difference in CFB (%)‡ 11.4 (−4.2, 29.5) 3.5 (−12.0, 21.7) Reference 19.0 (−4.0, 47.6) 0.7 (−20.1, 27.0) Reference
SHBG, sex hormone-binding globulin;CFB, change from baseline;DHEAs, dehydroepiandrosterone sulfate.
†Geometric mean as the dependent variable with treatment as a main effect, and baseline log value (grand mean centered) and age (grand mean centered) as
covariates.
‡Difference in change from baseline compared to No Coffee (i.e., ratio of ratios) adjusted for the above covariates. a
p < 0.05 compared to No Coffee. b
an attempt to address this issue. From the evidence to date, it is clear that heterogeneity among the observa-tional studies in timing of the hormone measurements in women has most likely led to some of the divergent findings. We inquired about the last menstrual period or menopausal status, in addition to having the two follow-up visits timed approximately four weeks apart to reduce the variation in measurement for sex hormones by fol-licular and luteal cycle timing. However, it is plausible that inadequate control for menopausal status attenu-ated our results given the variability in the women’s ages and that, for example, the majority of postmenopausal women were in the decaffeinated coffee group. In our trial, lack of finding any significant effects at the 8-week visit for any of the measurements lends to the hypothesis
that habituation may have occurred by the time of the final 8-week visit. Longer randomized trials with larger sample size will be necessary to elucidate the temporality of the potential effects.
In this randomized controlled trial with caffeinated and decaffeinated coffee interventions, we did not find evidence of a consistent effect on SHBG levels in over-weight men or women. This contrasts with the beneficial effects of coffee consumption on adiponectin and fetuin-A levels previously reported in this trial [9], suggesting that the SHBG level is not the major intermediate of the putative effect of coffee consumption on a lower risk of T2DM. Our findings necessitate further examination in a larger intervention trial of the effects of coffee on sex hormones to elucidate if this is a potential intermediary
Table 3 Sex hormone-binding globulin and endogenous sex hormones by treatment group at week 4 and week 8 in women
Week 4 Week 8
Value (95% confidence interval) Value (95% confidence interval)
Caffeinated Decaffeinated No Coffee Caffeinated Decaffeinated No Coffee
Coffee Coffee Coffee Coffee
(N = 10) (N = 9) (N = 9) (N = 10) (N = 9) (N = 9)
SHBG (nmol/L)
Geometric means† 43.8 (35.2, 54.5) 52.8 (42.5, 65.5) 38.2 (30.7, 47.6) 44.2 (37.3, 52.4) 45.8 (38.7, 54.1) 44.2 (37.3, 52.4) Difference in CFB (%)‡ 14.6 (−16.2, 56.7) 38.0 (1.5, 87.7)a Reference −0.0 (−21.6, 27.4) 3.6 (−18.4, 31.5) Reference Testosterone (ng/dL)
Geometric means† 51.3 (33.5, 78.6) 39.0 (24.8, 61.4) 98.3 (62.3, 155.2) 35.1 (26.2, 47.0) 32.4 (23.8, 44.2) 37.3 (27.3, 51.0) Difference in CFB (%)‡ −47.8 (−72.1, -2.3)a −60.3 (−79.3, -24.0)b Reference −5.9 (−38.7, 44.3) −13.1 (−44.3, 35.5) Reference Free testosterone (ng/dL)
Geometric means† 0.6 (0.3, 1.0) 0.4 (0.2, 0.7) 1.2 (0.7, 2.1) 0.4 (0.3, 0.6) 0.3 (0.2, 0.5) 0.4 (0.3, 0.6)
Difference in CFB (%)‡ −51.1 (−78.7, 12.0) −67.8 (−86.0, -26.2)b Reference −6.0 (−47.5, 68.5) −13.3 (−51.6, 55.4) Reference Estradiol (pg/mL)
Geometric means† 37.9 (26.5, 54.2) 42.6 (29.0, 62.3) 42.9 (28.7, 64.1) 41.8 (24.8, 70.6) 39.7 (22.7, 69.4) 40.6 (23.3, 70.6) Difference in CFB (%)‡ −11.8 (−48.4, 50.8) −0.9 (−43.2, 73.2) Reference 3.2 (−51.7, 120.5) −2.1 (−55.8, 116.6) Reference Free estradiol (pg/mL)
Geometric means† 0.6 (0.4, 0.9) 0.6 (0.4, 0.9) 0.7 (0.5, 1.1) 0.7 (0.4, 1.1) 0.6 (0.3, 1.0) 0.6 (0.4, 1.1)
Difference in CFB (%)‡ −19.3 (−56.1, 48.3) −13.4 (−53.5, 61.3) Reference 2.9 (−52.2, 121.6) −5.2 (−56.8, 108.2) Reference Testosterone : Estradiol
Geometric means† 1.4 (0.8, 2.3) 1.0 (0.6, 1.7) 2.1 (1.2, 3.8) 0.8 (0.5, 1.5) 0.8 (0.4, 1.5) 0.9 (0.5, 1.7)
Difference in CFB (%)‡ −36.0 (−71.0, 41.4) −54.1 (−79.6, 3.3) Reference −9.9 (−61.7, 111.9) −9.6 (−62.6, 118.3) Reference DHEAs (ng/mL)
Geometric means† 113.8 (101.0, 128.1) 101.7 (89.6, 115.5) 100.0 (87.5, 114.4) 111.7 (101.0, 123.6) 102.9 (92.3, 114.6) 120.4 (108.2, 134.1) Difference in CFB (%)‡ 13.7 (−4.9, 36.0) 1.7 (−15.6, 22.5) Reference −7.2 (−19.9, 7.4) −14.6 (−26.7, -0.4) Reference
SHBG, sex hormone-binding globulin;CFB, change from baseline;DHEAs, dehydroepiandrosterone sulfate.
†Geometric mean as the dependent variable with treatment as a main effect, and baseline log value (grand mean centered) and age (grand mean centered) as
covariates.
‡Difference in change from baseline compared to No Coffee (i.e., ratio of ratios) adjusted for the above covariates. a
p < 0.05 compared to No Coffee. b
mechanism to explain the beneficial effects observed of coffee intake and T2DM.
Additional file
Additional file 1:Table S1.Summary of the observational evidence for the relation between coffee and caffeine intake, SHBG and sex hormone levels.
Competing interests
The authors declare that they have no competing interests.
Authors’contributions
NW contributed towards the acquisition, analysis and interpretation of the data, drafted the manuscript, and critically reviewed the manuscript. CM contributed towards the study concept and design, the acquisition, analysis and interpretation of the data, and critically reviewed the manuscript. ED contributed towards the analysis and interpretation of the data, and critically reviewed the manuscript. AB contributed towards the study concept and design, the acquisition and interpretation of the data, and critically reviewed the manuscript. BR contributed towards the analysis and interpretation of the data, and critically reviewed the manuscript. ER contributed towards the analysis and interpretation of the data, and critically reviewed the manuscript. FH contributed towards the study concept and design, the analysis and interpretation of the data, and critically reviewed the manuscript. RVD contributed towards the study concept and design, the acquisition, analysis and interpretation of the data, drafted the manuscript, critically reviewed the manuscript, and obtained funding for the study. All authors have read and approved the final manuscript.
Acknowledgements
We gratefully thank the participants of the Coffee Trial for their participation. We also thank the General Clinical Research Center (GCRC) nurses at Beth Israel Deaconess Medical Center for assistance with collection of the samples for this research, and the GCRC nutritionists for conducting the dietary assessments, body composition measurements, and dispensing of treatment. We thank the Harvard Catalyst Human Research Center Laboratory for the timely and careful measurement of the sex hormones used for this analysis. The research for this study was financially supported by a Harvard Catalyst Human Research Center Laboratory Support Award, a Boston Obesity Nutrition Research Center pilot and feasibility grant (grant#: 2005-P-000377/ 2), and a National Institutes of Health - National Center for Research Resources grant M01-RR-01032 (Harvard Clinical and Translational Science Center) and grant number UL1 RR025758. The Mantzoros Lab is also supported by the National Institute of Diabetes and Digestive and Kidney Diseases grants 58785, 79929 and 81913, and AG032030.
The clinical trial registration number is NCT00305097. The coffee was supplied by Nestlé.
Author details
1Department of Nutrition, Harvard School of Public Health, 665 Huntington
Ave, Boston, MA 02115, USA.2Section of Endocrinology, Boston VA Healthcare System, Harvard Medical School, Boston, MA, USA.3Division of Endocrinology, Diabetes & Metabolism, Beth Israel Deaconess Medical Center, Harvard Medical School, Boston, MA, USA.4Channing Laboratory, Department of Medicine, Brigham and Women’s Hospital, and Harvard Medical School, Boston, MA, USA.5Department of Biostatistics, Harvard School of Public Health, Boston, MA, USA.6Department of Epidemiology, Harvard School of Public Health, Boston, MA, USA.7Saw Swee Hock School of Public Health and Department of Medicine, Yong Loo Lin School of Medicine, National University of Singapore, , Singapore.
Received: 14 June 2012 Accepted: 16 October 2012 Published: 19 October 2012
References
1. Ding EL, Song Y, Malik VS, Liu S:Sex differences of endogenous sex hormones and risk of type 2 diabetes: a systematic review and meta-analysis.JAMA2006,295:1288–1299.
2. Kotsopoulos J, Eliassen AH, Missmer SA, Hankinson SE, Tworoger SS:
Relationship between caffeine intake and plasma sex hormone concentrations in premenopausal and postmenopausal women. Cancer2009,115:2765–2774.
3. Goto A, Song Y, Chen BH, Manson JE, Buring JE, Liu S:Coffee and caffeine consumption in relation to sex hormone-binding globulin and risk of type 2 diabetes in postmenopausal women.Diabetes2011,60:269–275. 4. Ding EL, Song Y, Manson JE, Rifai N, Buring JE, Liu S:Plasma sex steroid
hormones and risk of developing type 2 diabetes in women: a prospective study.Diabetologia2007,50:2076–2084.
5. Ding EL, Song Y, Manson JE, Hunter DJ, Lee CC, Rifai N, Buring JE, Gaziano JM, Liu S:Sex hormone-binding globulin and risk of type 2 diabetes in women and men.N Engl J Med2009,361:1152–1163.
6. London S, Willett W, Longcope C, McKinlay S:Alcohol and other dietary factors in relation to serum hormone concentrations in women at climacteric.Am J Clin Nutr1991,53:166–171.
7. Ferrini RL, Barrett-Connor E:Caffeine intake and endogenous sex steroid levels in postmenopausal women. The Rancho Bernardo Study. Am J Epidemiol1996,144:642–644.
8. Nagata C, Kabuto M, Shimizu H:Association of coffee, green tea, and caffeine intakes with serum concentrations of estradiol and sex hormone-binding globulin in premenopausal Japanese women. Nutr Cancer1998,30:21–24.
9. Wedick NM, Brennan AM, Sun Q, Hu FB, Mantzoros CS, van Dam RM:Effects of caffeinated and decaffeinated coffee on biological risk factors for type 2 diabetes: a randomized controlled trial.Nutr J2011,10:93. 10. Sodergard R, Backstrom T, Shanbhag V, Carstensen H:Calculation of free
and bound fractions of testosterone and estradiol-17 beta to human plasma proteins at body temperature.J Steroid Biochem1982,16:801–810. 11. Cooper C, Atkinson EJ, Wahner HW, O’Fallon WM, Riggs BL, Judd HL, Melton
LJ 3rd:Is caffeine consumption a risk factor for osteoporosis? J Bone Miner Res1992,7:465–471.
12. Lucero J, Harlow BL, Barbieri RL, Sluss P, Cramer DW:Early follicular phase hormone levels in relation to patterns of alcohol, tobacco, and coffee use.Fertil Steril2001,76:723–729.
13. Phillips GB:The variability of the serum estradiol level in men: effect of stress (college examinations), cigarette smoking, and coffee drinking on the serum sex hormone and other hormone levels.Steroids1992,
57:135–141.
doi:10.1186/1475-2891-11-86
Cite this article as:Wedicket al.:The effects of caffeinated and decaffeinated coffee on sex hormone-binding globulin and
endogenous sex hormone levels: a randomized controlled trial.Nutrition Journal201211:86.
Submit your next manuscript to BioMed Central and take full advantage of:
• Convenient online submission
• Thorough peer review
• No space constraints or color figure charges
• Immediate publication on acceptance
• Inclusion in PubMed, CAS, Scopus and Google Scholar
• Research which is freely available for redistribution