A STUDY ON EFFECT OF TOOL RAKE
ANGLE ON MACHINING QUALITY IN
TURNING OF AL 6351
ALLOY-DESIRABILITY FUZZY LOGIC
APPROACH
P HEMA
Department of Mechanical Engineering, S.V.U College of Engineering, Tirupathi - 516227, India [email protected]
N HIMAJASRI2
Department of Mechanical Engineering, S.V.U College of Engineering, Tirupathi - 516227, India. [email protected]
G VIJAYA KUMAR3
Department of Mechanical Engineering, S.V.U College of Engineering, Tirupathi - 516227, India. [email protected]
B NARAYANA REDDY4
Department of Mechanical Engineering, S.V.U College of Engineering, Tirupathi - 516227, India. [email protected]
Abstract: Turning is one of the most important machining process among all the machining processes even though, Non-traditional machining processes are playing major roll. On other hand Aluminium alloys are the most promising materials in the fields of aeronautical, marine and automobile etc.,. Hence this research focused on the effect of rake angle with other machining parameters on machining quality in turning of Aluminium Alloy 6351 using. For this work Turning experiments are conducted on Al 6351 Alloy according to L32 Taguchi Orthogonal Array and the machining quality characteristics: surface roughness, temperature, power consumption, torque and thrust force are measured for each experimental run and are analyzed using Desirable-Fuzzy approach and optimum influential factors combination is identified. The identified combination of influential factors is tested through confirmation experiment and is satisfactory. In analysis of the results the tool angle acquired the 4th rank in influencing the multi responses and said to be the least influencing factor.
Keywords: Turning; HSS Tool; Aluminium 6351 Alloy; Process Parameters; Taguchi Orthogonal Array; Desirability Fuzzy Logic Approach.
1. Introduction
[3] evaluated the effect of cutting fluids on cutting force components in turning of AISI 4340 steel using Taguchi method. The results show that cutting speed and cutting fluid were significant factors on cutting force measurements. Borse [4] was focused on optimizing turning parameters based on the Taguchi method to minimize the surface roughness and maximize the metal removal rate by using SAE 52100 steel. Results of this study indicate that the feed rate is mostly influencing the surface roughness of the machined surface. Deore et al. [5] used Taguchi method for optimization of machining parameters for minimum cutting forces. Turning operation was done on lathe machine on EN 19 steel. Through ANNOVA it is found out that Depth of cut is the significant factor for thrust force, and feed rate is the significant factor for feed force. Multiple regression equation was established to estimate the value of performance level for any parameter level.El-Gallab and Sklad [6] have used several tool materials to compare its effectiveness. Davim [7] studied the drilling of metal matrix composites based on Taguchi technique to find the influence of cutting parameters on tool wear, torque and surface finish and the interactions between these factors. Uday et al. [8] presented an elaborative experimentation using Taguchi methods on four Al/SiC composites to analyze the effects of size (15 and 65 μm) and volume fraction (20% and 30%) of the reinforcements in the composites on machining forces and machined surface roughness. However, Taguchi method has shown some defects in dealing with the problems of multiple performance characteristics [9-11]. Optimum machining condition in turning A356/SiC/20p metal matrix composites for minimizing the surface roughness was determined using desirability function approach [12]. The responses in drilling of Al6061 are analyzed using hybrid approach (Grey-Fuzzy) and optimum controllable parameter combination is identified [13]. Optimum parameters are identified to develop an Aluminium metal matrix composite with respect to mechanical properties by using grey relational analysis the above literature revealed that the research on the effect of rake angle on machining quality in turning of aluminium is parameters is very low, hence the present work has been designed to overcome the lack of research.
2. Major Headings
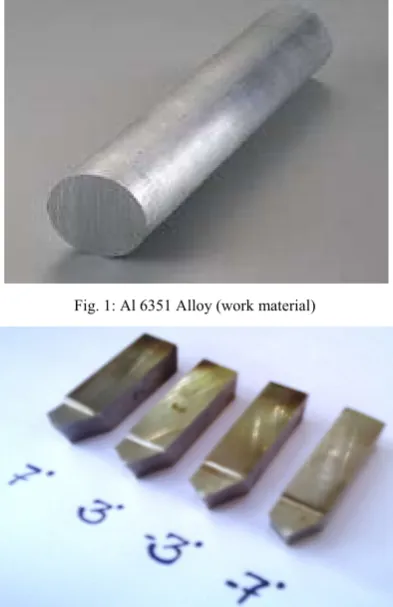
The base materials used in this project is Aluminium 6351 alloy. The work material is taken in the form of the solid cylindrical rod of length 360mm and diameter 50mm which is used for performing the turning operation with multiple process parameters.
The HSS cutting tools are especially grinded with specified rake and approach angles. The four rake angles (-70, -30, 30 and 70) are set on cutting tools but approach angles are set on the lathe while machining. HSS cutting tool bits used in turning operation are shown in Fig. 2.
2.1. Experimental Design and Machining of Work Material
To diminish the experimental cost as well the time, Taguchi experimental design Orthogonal Array (OA) L32 has been prepared and used for conducting experiments. Various factors like cutting environments, speed, feed, depth of cut and tool angle different are considered as input parameters and each parameter is set at four levels. The Experimental design (Table 1) is prepared by considering the factors and levels shown in the Table.1. As per the design of experiments Turning tests have been performed on work piece (Fig.1).
Table 1: Influential parameters and their levels
S. No Influential Parameters Level 1 Level 2 Level 3 Level 4
1 Cutting Environment (CE) D W - -
2 Speed (S) - rpm 280 450 710 1120
3 Feed (F) - mm / rev 1 1.25 1.5 1.75
4 Depth of Cut (DOC) - mm 0.1 0.2 0.3 0.4
5 Tool Angle (TA) - degrees -7 -3 +3 +7
Table 2: L32 Orthogonal Array Table 3: Experimental Results
S. No CE S F DOC TA S. No Temp. RoughneSurface Power Consu i
Thrust
Force Torque
1 D 280 1.00 0.1 -7 1 32.3 0.25 500 0.01 0.05
2 D 280 1.25 0.2 -3 2 33.3 0.71 400 0.02 0.07
3 D 280 1.5 0.3 3 3 24.3 1.77 400 0.03 0.07
4 D 280 1.75 0.4 7 4 34.6 1.32 600 0.05 0.12
5 D 450 1.00 0.1 -3 5 34.9 0.53 450 0.01 0.05
6 D 450 1.25 0.2 -7 6 32.3 0.37 500 0.02 0.11
7 D 450 1.50 0.3 7 7 34.6 1.25 450 0.04 0.11
8 D 450 1.75 0.4 3 8 34.5 2.76 500 0.04 0.08
9 D 710 1.00 0.2 3 9 36.3 2.03 600 0.02 0.04
10 D 710 1.25 0.1 7 10 34.0 0.36 300 0.01 0.05
11 D 710 1.50 0.4 -7 11 32.5 0.33 800 0.08 0.31
12 D 710 1.75 0.3 -3 12 41.4 0.91 700 0.04 0.11
13 D 1120 1.00 0.2 7 13 38.0 0.76 900 0.02 0.09
14 D 1120 1.25 0.1 3 14 36.1 0.53 900 0.01 0.03
15 D 1120 1.50 0.4 -3 15 35.2 1.12 900 0.05 0.12
16 D 1120 1.75 0.3 -7 16 34.0 0.3 950 0.06 0.31
17 W 280 1.00 0.4 -7 17 29.8 0.36 350 0.01 0.06
18 W 280 1.25 0.3 -3 18 36.0 1.7 400 0.02 0.07
19 W 280 1.50 0.2 3 19 34.3 1.87 500 0.02 0.05
20 W 280 1.75 0.1 7 20 32.2 1.09 500 0.01 0.05
21 W 450 1.00 0.4 -3 21 35.8 2.41 600 0.03 0.08
22 W 450 1.25 0.3 -7 22 32.0 0.46 500 0.03 0.12
23 W 450 1.50 0.2 7 23 34.0 1.22 600 0.03 0.09
24 W 450 1.75 0.1 3 24 32.6 0.42 400 0.01 0.04
25 W 710 1.00 0.3 3 25 36.9 3.19 600 0.03 0.05
26 W 710 1.25 0.4 7 26 32.1 2.16 700 0.05 0.11
27 W 710 1.50 0.1 -7 27 33.5 0.39 700 0.08 0.3
28 W 710 1.75 0.2 -3 28 36.2 1.59 700 0.01 0.08
29 W 1120 1.00 0.3 7 29 37.2 1.03 950 0.04 0.09
30 W 1120 1.25 0.4 3 30 39.0 3.16 800 0.04 0.06
31 W 1120 1.50 0.1 -3 31 35.4 0.56 1000 0.01 0.04
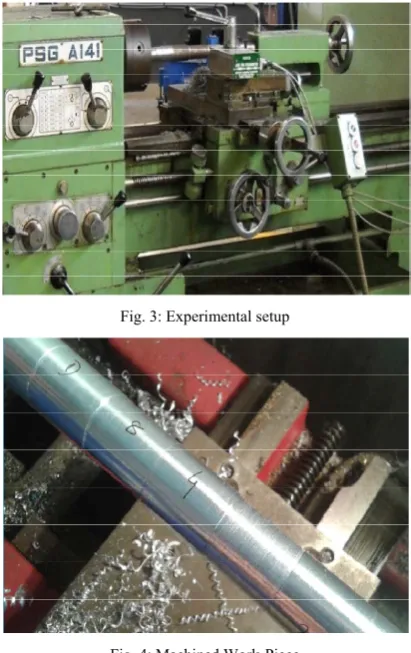
2.2.Experimental Setup
Experiment was conducted on Al 6351 by HSS tool with single point nomenclature is used for cutting the unwanted material. For turning process the most influenced parameters are Cutting Environment, Speed, Feed, Depth of cut and Tool Angle cutting environment hence these parameters are chosen as the process parameters for conducting experiments.
Fig. 3: Experimental setup
Fig. 4: Machined Work-Piece
3. Measurement of Output Responses
Surface Roughness is measured with the help of talysurf, temperature is measured using pyrometer. Power consumption, Torque and Thrust force is measured using dynamometer. The measuring surface roughness is described based on the profilomer of Talysurf the surface roughness is measured.
During turning process the temperature is produced due to the friction between the tool and the metal. This temperature is measured using infrared pyrometer. It Cutting forces are measured with a three component compact force dynamometer and transferred from over a serial port to the PC directly for further evaluation. The Experimental output responses are shown in the Experimental Results table 3.
4. Optimization using desirable-fuzzy approach
Desirable-Fuzzy approach is used to identify the optimal parameters for minimizing the responses. This approach is developed by combining desirability function analysis and the fuzzy logic techniques. The Steps are as follows:
4.1.Step I calculate the individual desirability values
Calculate the individual desirability (di) for the corresponding responses using the formula proposed by Derringer and Suich (27). There are three forms of the desirability functions according to the response characteristics.
ŷ
y
d
=ŷ ,
y
ŷ
y
,r
0
…..… (1)0,
ŷ
y
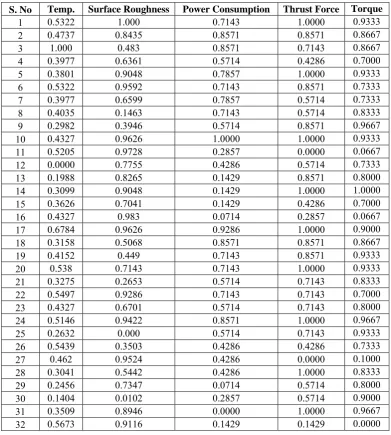
List where the ymin represents the lower tolerance limit of ŷ, the ymax represents the upper tolerance limit of ŷ and r represents the weight. The s, t and r in Eq. 1 indicate the weights and are defined according to the requirement of the user. If the corresponding response is expected to be closer to the target, the weight can be set to the larger value; otherwise, the weight can be set to the smaller value. In the present work, the smaller-the-better characteristic is applicable for both burr height, and tool wear, because these are to be minimized. The individual desirability values are determined using Eq. 1 and tabulated in the Table 4.
Table 4: Individual desirability Values
S. No Temp. Surface Roughness Power Consumption Thrust Force Torque
1 0.5322 1.000 0.7143 1.0000 0.9333
2 0.4737 0.8435 0.8571 0.8571 0.8667
3 1.000 0.483 0.8571 0.7143 0.8667
4 0.3977 0.6361 0.5714 0.4286 0.7000
5 0.3801 0.9048 0.7857 1.0000 0.9333
6 0.5322 0.9592 0.7143 0.8571 0.7333
7 0.3977 0.6599 0.7857 0.5714 0.7333
8 0.4035 0.1463 0.7143 0.5714 0.8333
9 0.2982 0.3946 0.5714 0.8571 0.9667
10 0.4327 0.9626 1.0000 1.0000 0.9333
11 0.5205 0.9728 0.2857 0.0000 0.0667
12 0.0000 0.7755 0.4286 0.5714 0.7333
13 0.1988 0.8265 0.1429 0.8571 0.8000
14 0.3099 0.9048 0.1429 1.0000 1.0000
15 0.3626 0.7041 0.1429 0.4286 0.7000
16 0.4327 0.983 0.0714 0.2857 0.0667
17 0.6784 0.9626 0.9286 1.0000 0.9000
18 0.3158 0.5068 0.8571 0.8571 0.8667
19 0.4152 0.449 0.7143 0.8571 0.9333
20 0.538 0.7143 0.7143 1.0000 0.9333
21 0.3275 0.2653 0.5714 0.7143 0.8333
22 0.5497 0.9286 0.7143 0.7143 0.7000
23 0.4327 0.6701 0.5714 0.7143 0.8000
24 0.5146 0.9422 0.8571 1.0000 0.9667
25 0.2632 0.000 0.5714 0.7143 0.9333
26 0.5439 0.3503 0.4286 0.4286 0.7333
27 0.462 0.9524 0.4286 0.0000 0.1000
28 0.3041 0.5442 0.4286 1.0000 0.8333
29 0.2456 0.7347 0.0714 0.5714 0.8000
30 0.1404 0.0102 0.2857 0.5714 0.9000
31 0.3509 0.8946 0.0000 1.0000 0.9667
32 0.5673 0.9116 0.1429 0.1429 0.0000
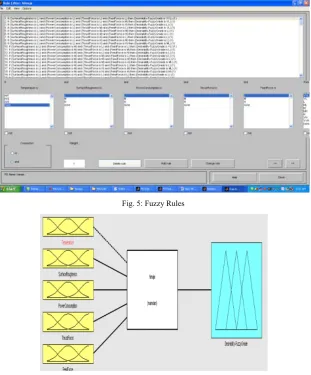
Fig. 5: Fuzzy Rules
Fig. 6: Fuzzy Logic Unit
4.2.Step II Obtain the desirable-fuzzy grade
Fig. 8: Membership functions of Desirable-Fuzzy Grade
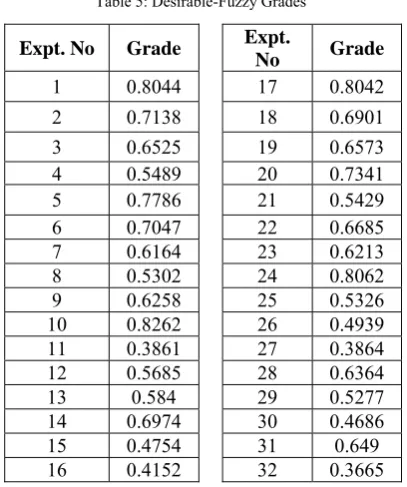
Table 5: Desirable-Fuzzy Grades
Expt. No Grade Expt.
No Grade
1 0.8044 17 0.8042
2 0.7138 18 0.6901
3 0.6525 19 0.6573
4 0.5489 20 0.7341
5 0.7786 21 0.5429
6 0.7047 22 0.6685
7 0.6164 23 0.6213
8 0.5302 24 0.8062
9 0.6258 25 0.5326
10 0.8262 26 0.4939
11 0.3861 27 0.3864
12 0.5685 28 0.6364
13 0.584 29 0.5277
14 0.6974 30 0.4686
15 0.4754 31 0.649
16 0.4152 32 0.3665
4.3. Step III obtaining the optimal combination of influential factors
After obtaining the desirable-fuzzy grade, it is calculated for each factor at each level and is tabulated in table. The higher value will be treated as the optimum level of certain factor.
The Table 6 and fig. 9 the optimal influential factors combination is CE 1 S1 F2 DC 1 TA 2. ie., Cutting environment at leve1 ie; dry cutting condition,
Speed at level 1ie; 280, Feed at level 2 ie; 1.25, Depth of cut at level 1ie; 0.1, Tool angle at level 2ie; +3.
Table 6: Desirable-fuzzy grade for each parameter at each level
Level CE S F DOC TA
1 0.6205 0.7006 0.6500 0.7102 0.5670 2 0.5991 0.6586 0.6579 0.6137 0.6318
3 0.5569 0.5555 0.5839 0.6213
4 0.5229 0.5757 0.5312 0.6190
Delta 0.0214 0.1776 0.1023 0.1790 0.0648
Fig. 9: Desirable-fuzzy grade for each parameter at each level
5. Results and Discussions
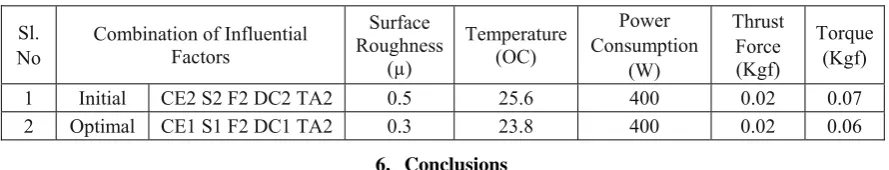
After identifying the optimum combination of influential factors, the confirmation experiment is conducted and the results of confirmation Experiment are shown in the Table 7. and is satisfactory. The turning responses were minimized successfully using Desirable-fuzzy approach. From the Table 7, the order of influential factors Rank wise are depth of cut, speed, feed, tool angle and cutting environment. And it is observed that the tool angle and cutting environment are influencing the multi responses in very less, depth of cut and speed are mostly influencing the multi responses and feed has got average influence on multiresponse.
Table 7: Results of confirmation experiment
Sl. No
Combination of Influential Factors
Surface Roughness
(µ)
Temperature (OC)
Power Consumption
(W)
Thrust Force (Kgf)
Torque (Kgf)
1 Initial CE2 S2 F2 DC2 TA2 0.5 25.6 400 0.02 0.07
2 Optimal CE1 S1 F2 DC1 TA2 0.3 23.8 400 0.02 0.06
6. Conclusions
Turning experiments were conducted successfully on Al 6351 solid cylindrical rod as per L32 orthogonal array and machining responses like temperature, surface roughness, power consumption; thrust force and torque are measured. These responses have been analyzed using the desirability fuzzy logic approach. The following conclusions are drawn:
In this work the desirability fuzzy optimization technique was used to optimize the multi responses in turning of Al6351.
Desirability fuzzy logic optimization method gives a best optimal combination and is concluded through the confirmation experiment. The best optimal combination for turning of Al 6351 is CE1 S1 F2 DC1 TA2.
From the table it is concluded that the Depth of cut and spindle speed are greatly influencing the multi responses, feed is medially influencing, and the tool angles and the cutting environments are leastly influencing the multi responses.
Acknowledgements
Author wishes to thank Production Engineering Lab, Dept. of Mechanical Engineering, SVU College of Engineering for providing necessary facilities and permitting to utilize the equipment for conducting the experiment and continuous encouragement to does this project work.
References
[1] JB Raju, et.al., (2015) Application of Taguchi Technique for Identifying Optimum Surface Roughness in CNC end Milling Process, International Journal of Engineering Trends and Technology, 2, 103-110.
[2] MA El Hakim et.al., (2015) Effect of secondary hardening on cutting forces, cutting temperature, and tool wear in hard turning of high alloy tool steels, Measurement, 65, 233–238.
[7] Palanikumar K, Muthukrishnan N. Hariprasad K S., (2008) Surface roughness parameters optimization in machining A356/SiC/20p metal matrix composites by PCD tool using response surface methodology and desirability function Machining Science and Technology, 12: 529−545.
[8] Uday A D, Harshad A S, Suhas S J. (2010) Cutting forces and surface roughness in machining Al/SiCp composites of varying composition, Machining Science and Technology, 10: 258−279.
[9] M.H. Caleb Li, S.M. Hong, (2005) Optimal parameter design for chip-on-film technology using the Taguchi method, International Journal of Advanced Manufacturing Technology, 25, 118-129.
[10] M.D. Jean, Y.F. Tzeng, (2004) Optimization of election-beam surface hardening of cast iron for high wear resistance using the Taguchi method, International Journal of Advanced Manufacturing Technology, 24, 190-198.
[11] J. Kopac, (2002) Optimal machining for achieving the desired surface roughness in fine turning of cold pre-formed steel work piece, International Journal of Machine Tools Manufacture, 42, 707-716.
[12] G.Vijaya Kumar and P.Venkataramaiah, (2012) Optimization study on drilling of al-6061 with coated tools under MQL condition using hybrid approach” Elixir Mech. Engg., 45, 7831-7839.