DNP Scholarly Projects Student Scholarship
Winter 2018
Improving SBIRT Screening in Primary Care: A
Process Evaluation Project
Leesa Taft
University of New Hampshire, Durham
Follow this and additional works at:https://scholars.unh.edu/scholarly_projects
This Clinical Doctorate is brought to you for free and open access by the Student Scholarship at University of New Hampshire Scholars' Repository. It has been accepted for inclusion in DNP Scholarly Projects by an authorized administrator of University of New Hampshire Scholars' Repository. For more information, please [email protected].
Recommended Citation
Improving SBIRT Screening in Primary Care: A Process Evaluation Project Leesa L. Taft
University of New Hampshire
Department of Nursing
Faculty Mentor: Dr. Kerry Nolte, PhD, APRN, FNP
Practice Mentor: Paul Calandrella, FACHE
Improving SBIRT Screening in Primary Care: A Process Evaluation Project
Abstract
Background: Screening for the use of alcohol and drug use in primary care practices has been shown to decrease substance misuse both in quantity and frequency. Integrating evidenced based clinical practice guidelines for substance use, into a sustainable process, can reduce substance misuse, improve patient care, and reduce health risks and the financial burden of the sequelae of substance use on our health care system.
Purpose: The purpose of this project was to evaluate and optimize the current practice of
Screening, Brief Intervention, and Referral to Treatment (SBIRT) for substance use in a Vermont based primary care practice.
Methods: The Donabedian Quality of Care Model provided the conceptual framework for this process evaluation. A gap analysis of SBIRT process points was conducted to inform this project and synthesized into an SBIRT Process Flowchart. Chart reviews were then completed on
SBIRT current practice processes, which identified gaps in the process, and allowed for collaboration with staff to improve the screening process.
Intervention: An evaluation was conducted of the current SBIRT screening process in a
primary care setting over a five-month period. Gaps identified were addressed in multiple PDSA (Plan, Do, Study, Act) cycles with interventions including process improvements with flagging patients, screener scoring, risk stratification and appropriate Electronic Medical Record (EMR) documentation.
Results: During the project period, overall error rates decreased from 29.3% to 7% and
successful SBIRT screening rose from 72% to 93%.
Conclusions: Ongoing education and training improved the scoring, appropriate risk
stratification and documentation in our outpatient primary care practice. Although improvement was made in most of the key quality indicators, ongoing work is needed to ensure delivery of interventions and treatment for those patients who need it, and that related documentation is completed.
Table of Contents
Acknowledgements………5
Introduction………6
Problem Description………..6
Available Knowledge……….6
Rationale……….8
Specific Aims………..9
Methods……….10
Context………..10
Interventions……….10
Study of the Interventions………...12
Measures………...12
Analysis……….12
Ethical Considerations………13
Results………...13
Results………...13
Discussion……….22
Limitations………..24
Conclusions……….24
Acknowledgements
Improving SBIRT Screening in Primary Care: A Process Evaluation Project
Introduction
Problem Description
Vermont ranked number one for the highest use and abuse of alcohol, marijuana and
cocaine in 2013 (National Survey on Drug Use and Health (NSDUH), 2013-2014). As part of a
response to this, Mt. Ascutney Hospital in Windsor, Vermont, implemented SBIRT within their primary care practice in December 2017. This initiative was to promote routine screening and early intervention for alcohol and drug abuse, however, a process evaluation had not been conducted, thus gaps within the current screening structure were unknown. Given the potential SBIRT screening has to help reduce the quantity and frequency of substance use, evaluating the current state of SBIRT screening in primary care allows for process improvement and ensures a sustainable screening process.
Available Knowledge
In 2003, Substance Abuse and Mental Health Services Administration (SAMHSA)
developed a systematic approach for screening and treating patients for alcohol and substance misuse that could be implemented in any health care setting. This screening, known as SBIRT, is used to screen for current alcohol and substance misuse, and for the early detection of risky drinking and substance abuse behaviors and patterns (Office of National Drug Control Policy, 2008).
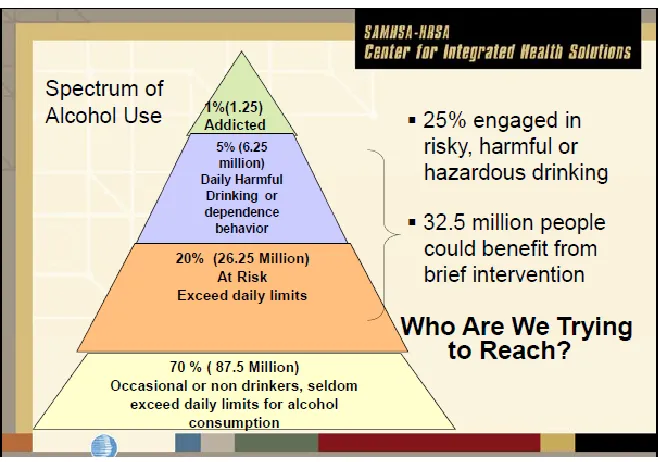
involves a conversation, often employing motivational interviewing techniques, to engage the patient and provide feedback and advice (SAMHSA-HRSA, 2018). For those identified at harmful or hazardous risk, a referral to treatment is made by the provider. Referral options include substance use therapy, or treatment, based upon alcohol use and risk stratification. An example of this stratification can be seen in Figure 1 below (SAMHSA-HRSA, 2018).
As demonstrated in Figure 1, the spectrum of alcohol use ranges from approximately 70 percent of occasional, non-harmful drinkers to the 1 percent who are addicted. The group of people that could most benefit from early intervention of SBIRT screening are the 25 percent,
approximately 32 million, people that are engaged in risky or harmful drinking.
Figure 1. Spectrum of Alcohol Use
in risky drinking behavior (Jonas et al., 2012) and 7% of Americans have a history of illicit substance use (McCance-Katz, 2012). Substance misuse can impact a person’s mood, cognition, blood sugar, blood pressure, and heart rate, which could lead to subsequent heart attack, stroke or even death (National Institute on Drug Abuse (NIDA), 2017). Substance misuse is also
associated with health consequences such as heart disease, cancer, cirrhosis, psychiatric issues, suicide, and premature births (Shuckit, 2009).
The financial burden on the health care system from substance abuse and secondary health consequences exceeds 230 billion dollars (Glass et al., 2015). The estimated national cost savings with the use of SBIRT, has been shown to range from $3.81 to $5.60 for every $1.00 spent (SAMHSA-HRSA, 2018). In Vermont it is estimated that for every $1 invested in
prevention services the state saves $10-18 in associated health care costs (Vermont Department of Health, 2017). Taking into consideration our nation is spending more than 230 billion dollars (Glass et al., 2015) on the associated health impacts from substance use, this potential cost savings validates the need for a successful screening process.
Rationale
The rationale for this this project is to identify and address gaps within the current SBIRT screening process and increase successful SBIRT screening. This project aims to provide a
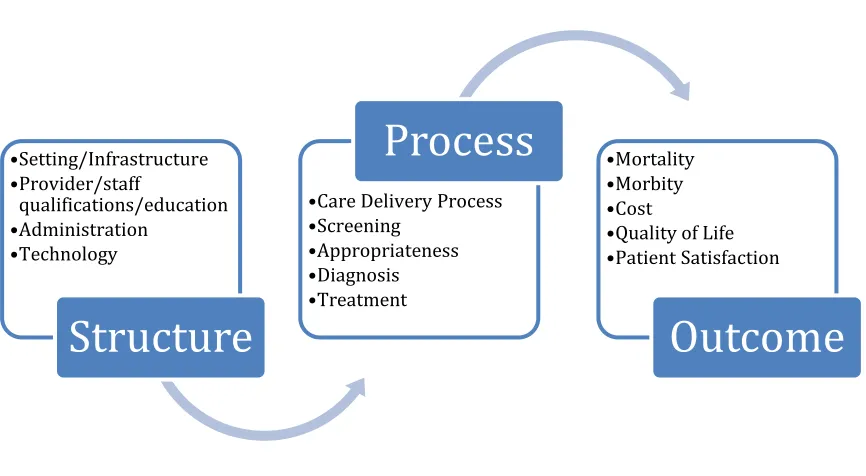
outcomes as depicted in Figure 2. The utilization of this framework allowed for examining the current structure for SBIRT screening, and to identify any physical, technological, or training barriers that prevented the assurance that staff involved in the SBIRT screening process, are set up for success (Ayanian & Markel, 2016). Second, the process within which SBIRT was being delivered was examined. Based on the HCQF model, a flow chart was developed to document the current steps related to structure, process, and outcome in SBIRT screening. This was used to help identify gaps within the SBIRT screening process and to ensure screening sustainability.
Figure 2. HCQF Framework
Specific Aims: The aim of this project is to improve successful SBIRT screening at Mt.
Ascutney Hospital’s primary care practice by 10% for identified patients 18 years of age or older over a three-month period. This will be conducted through review of the current SBIRT process and implementation of interventions based on identified gaps.
•Setting/Infrastructure •Provider/staff qualifications/education •Administration •Technology
Structure
•Care Delivery Process
•Screening
•Appropriateness
•Diagnosis
•Treatment
Process
•Mortality•Morbity
•Cost
•Quality of Life
•Patient Satisfaction
Methods
Context
This project was conducted atMt Ascutney Hospital, which is a small rural hospital
located in Windsor, Vermont. It serves approximately 10,000 patients in outpatient practices. The outpatient practice consists of pediatrics, family practice and internal medicine. For the purpose of this project, only the internal medicine practice was utilized, which covers
approximately 4,000 adult patients. The target population identified for SBIRT screening as part of this process review are those patients presenting for annual wellness visits, annual physical exams or new patients to the practice. Staff involved within the SBIRT screening process include secretarial staff (registration, team secretary and check-in/out staff), flow staff (CMAs, LPNs, RNs) and medical providers (MDs, DOs, APRNs, and PAs). This practice also has on-site psychiatric and LADAC (licensed alcohol and drug counselor) services. For the purpose and success of SBIRT within our organization, these specialty practices have also undergone training and are available as referral sources and to provide ongoing treatment interventions.
Interventions
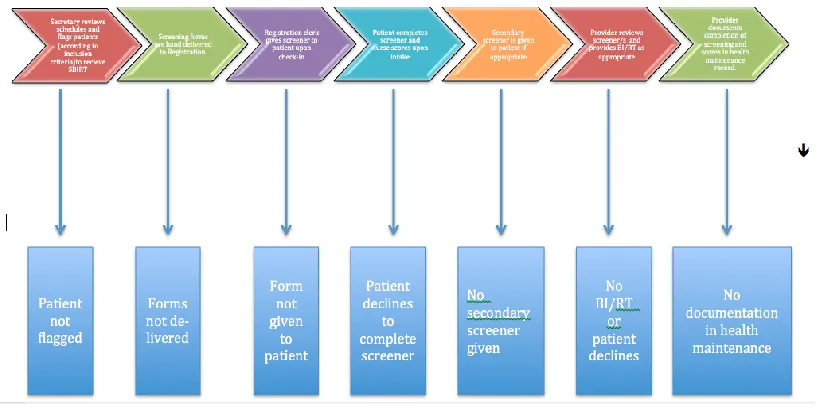
staff scored the screening tool accurately and if the provider documented the score and any intervention or referral in the appropriate area of the EMR.
Figure 3. SBIRT Screening Flow Chart
The data collected from the chart reviews were maintained on a spreadsheet. The spreadsheet was updated on a weekly basis and allowed for tracking of gaps within the process identified as needing improvement. Practice improvement interventions were then implemented based on these findings.
initial screeners and review of positive screens that would indicate the need for secondary screening. Lastly educational meetings were held with medical providers individually and
collectively, to review correct documentation of SBIRT scores within the EMR as well as BI and RT’s. Staff turnover was an unanticipated issue during this project, and as a result, SBIRT training was added to our new employee orientation checklist.
Study of the Interventions
Error rates were determined based upon data analysis using Pareto Analysis. This
technique is used to help determine which tasks within a process cause the most significant effect overall and highlight opportunities for practice change interventions. The Pareto Principle is
based upon an80/20 rule which states that essentially eighty percent of problematic outcomes
are caused by twenty percent of the associated tasks, otherwise also known as the “trivial many and vital few”.
Measures
To identify screening improvements, error rates were measured using Pareto Analysis, utilizing data from 351 chart reviews. This project included adult patients aged 18 or older who presented to primary care for annual wellness exams, physical exams or were new to the
practice. This population allows for routine evidence-based screening for early detection of
substance abuse.
Analysis: Data collected during this project was analyzed on a monthly basis, and divided into two phases, using Pareto charts. These charts help identify specific areas of needed
were then focused on the gaps that were identified and improvement processes were
implemented during phase two in Months 3-5. This allowed for month-by-month comparison of intervention effects as well as identification of other potential gaps.
Ethical Considerations
The project proposal was presented to Mt. Ascutney Hospital’s quality board and was deemed quality improvement not required to undergo organizational Internal Review Board (IRB) approval. The University of New Hampshire (UNH) Nursing Department Quality Improvement Review Committee reviewed this project and determined it fit the criteria for quality improvement and did not require IRB approval.
The schedules and screeners analyzed for this project that contained identifying information were locked in a secure cabinet and reviewed on a weekly basis. Once these documents were reviewed, the schedules were shredded and the screeners were sent to be scanned into the patient’s electronic medical record (EMR). The results of the review were maintained on a spreadsheet for further data analysis without any patient identifiable data.
Results
Results
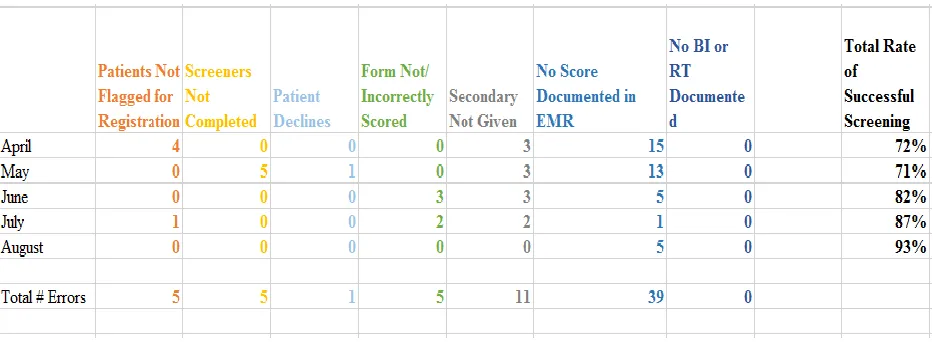
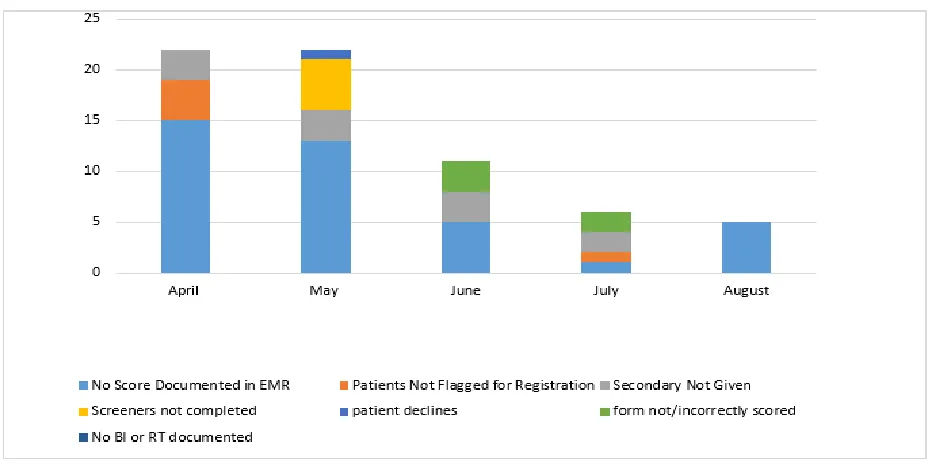
one to 93% (Table 1) in phase two. In addition, theoverall error rates decreased from 29.3% in phase one, to 7% (Figure 4) in phase two.
Table 1 demonstrates the number of errors by month and Figure 4 depicts the type of errors. The most frequent error was documentation within the EMR, followed by no secondary screener given, incorrect scoring, screeners not completed and patients not flagged for SBIRT screening.
Figure 4. Sum of All Errors
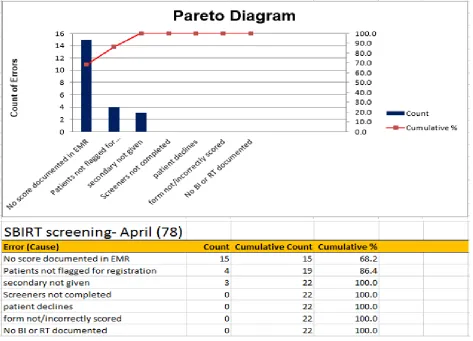
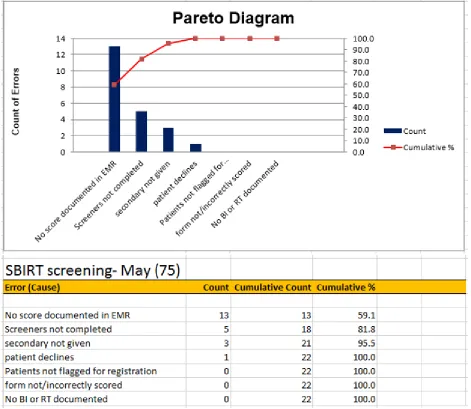
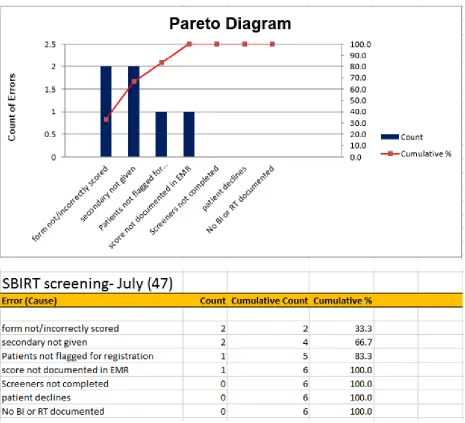
During phase one, appropriate flagging was completed on 150 of the 153 patients scheduled. Of these 150 patients, 124 screeners were given, and 118 of them were completed, giving a baseline completed screening rate of 95%. Of the 118 completed screeners, all of them were scored correctly. There were 22 patients with whom a DAST/AUDIT were recommended but only 15 were completed. Of the 15, a BI was recommended for 2 patients and both of those BIs were completed. Of the original 118 completed screeners, 90 of them were documented correctly in the EMR, corresponding to a 76% correct documentation rate. Figure 5 and 6 demonstrate the Pareto analysis for Months 1 and 2 and highlight a baseline of priority areas for practice change. Both Months include result documentation error rates of 19% and 17%
Figure 6. Month 2 Pareto Analysis
received it, corresponding with an 86% secondary screening completion rate. There were 13 patients identified recommending brief intervention (BI), and of those, 12 patients received intervention, 1 patient required referral to treatment, and the referral to treatment was completed. Of the original 142 completed screeners, 123 of them were documented correctly in the EMR, corresponding to an 87% correct documentation rate.
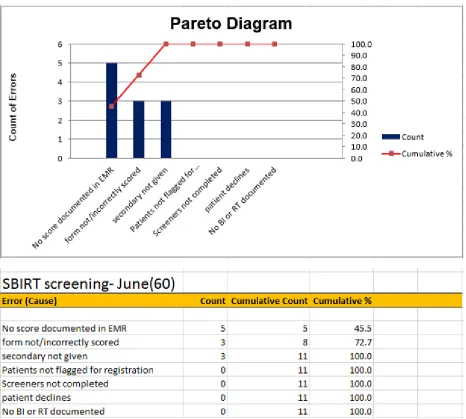
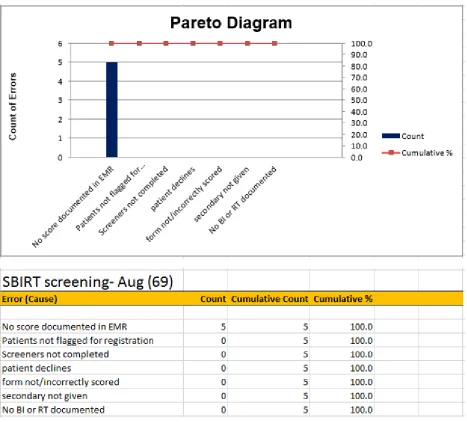
Implementation of interventions in phase two began in Month 3 (Figure 7). Interventions to improve result documentation included provider education. This was done through monthly meetings with education and training of where and how to document SBIRT results within the EMR so that these results could be easily reviewed for care management, data extraction, and reporting efforts. Subsequently, error rates for Months 3, 4 and 5 were 8%, 4% and 7% respectively (Figure 7-9). Overall correct documentation within the EMR during phase one ranged from 67% to 79% and in phase two ranged from 64% to 100%.
Interventions to reduce the error rate of patients not being flagged for screening included expanded training within the secretarial staff. Specifically, more staff were trained on how and when to flag patients. This additional training was reflected with no missed flagging during Months 2, 3 and 5 and 2% not being flagged in month 4 (Figure 6-9).
In phase one, Months 1 and 2, 4% of errors were caused from secondary screeners not being completed. This was in part due to incorrect scoring of primary screeners, and thus
Figure 9. Month 5 Pareto Analysis
Discussion
Summary/Interpretation
In this five-month SBIRT process evaluation project, the total percentage of successful screening increased from 72% in phase one to 93% after interventions in phase two. Given that SBIRT screening has been shown to decrease substance misuse, improve patient care, reduce health risks and the financial burden on our health care system, the success of this project in our facility, and community at large, is potentially limitless.
The largest area of initial improvement was provider documentation within the EMR. During the first phase of this project, providers were documenting correctly 76% of the time and during the second phase of this project improved to an 86% correct documentation rate. There was no noted variance within individual providers that would explain any variation in provider documentation. Another gap identified in phase one was the error rate of flagged patients. Upon further review, it was identified that only one secretary had undergone training for flagging, and in her absence, flagging was not conducted. Since then additional training for other staff has taken place.
The staff turnover was mostly notable in the second phase of this project, specifically with the correct scoring of the screener which decreased form 100% in the first phase to 83% during phase two. During this phase there were 3 out of 4 new flow staff. This negatively impacted the process by not having the screeners scored correctly, and reduced the number of secondary screeners (AUDIT/DAST) provided, which potentially resulted in missed
opportunities for BI and referrals. The reality of staff turnover identified a gap in education for new hires and resulted in the addition of SBIRT training and education as part of all new staff orientation.
incorporating SBIRT education for new hires cannot be underestimated, especially given high personnel turnover rates in primary care. Also, given staff shortages, it is imperative that SBIRT screening remains a priority so that screening diligence remains high and that other
documentation demands do not induce complacency.
Limitations
There are some limitations to the generalizability of this study. First, it was conducted in a small rural outpatient clinic where most patients are well known to the staff and therefore are more willing to complete screeners. Second, the inclusion age was patients 18 years of age or older presenting to primary care. Therefore, this study is not generalizable to those under the age of 18 or other hospital settings. Our patient population is also very homogenous, Caucasian
population, and may not be generalizable to more diverse populations.
Conclusions
This project identified gaps and implemented interventions for sustainability of SBIRT screening in an outpatient practice. The implementation of interventions reduced error rates from 29.3% to 7% and increased successful screening from 72% to 93%. Ongoing staff training and education was shown to be key for the success of this screening process, and is crucial to ensure correct risk stratification of patients, which in turn determines appropriate patient care. The ability to offer screening, have it done correctly, and document correctly is of utmost importance in order to provide appropriate care for patients within a medical home model, as well as for data
extraction and monitoring.
of health risk improvement, if any, as well as any relation to social determinants. Other projects may also seek to include the beliefs or behaviors or providers and/or patients in regards to SBIRT screening.
The successful sustainability of SBIRT in any primary care practice will be
References
Ayanian, J.Z., & Markel, H. (2016). Donabedian’s lasting framework for health care quality. New England Journal of Medicine, 375 (3), 205-207.
Brief Intervention, and Referral to Treatment (SBIRT) in Primary Care in Integrated Health Care
Settings, Substance Abuse, 36:3, 281-288, DOI: 10.1080/08897077.2014.951140
Center for Disease Control and Prevention (CDC). Alcohol Screening and Counseling (2014). Retrieved from https://www.cdc.gov/vitalsigns/alcohol-screening-counseling/index.html
Center for Disease Control and Prevention (CDC). Alcohol and Public Health (2018). Retrieved from https://www.cdc.gov/alcohol/index.htm
Cherpitel, C. J., & Ye, Y. (2008). Alcohol-attributable fraction for injury in the U.S. general population: Data from the 2005 National Alcohol Survey. J Stud Alcohol Drugs, 69, 535-538.
Final Recommendation Statement: Alcohol Misuse: Screening and Behavioral Counseling Interventions in Primary Care. U.S. Preventive Services Task Force. May 2013.
https://www.uspreventiveservicestaskforce.org/Page/Document/RecommendationStateme
ntFinal/alcohol-misuse-screening-and-behavioral-counseling-interventions-in-primary-care
Institute for Healthcare Improvement. (2018). Retrieved from http://www.ihi.org/resources/Pages/Tools/ParetoDiagram.aspx
McCance-Katz, E., & Satterfield, J. (2012). SBIRT: A key to integrate prevention and treatment of substance abuse in primary care. American Journal on Addiction, 21(2), 176-177
Moyer, V. (2013). Screening and Behavioral Counseling Interventions in Primary Care to Reduce Alcohol Misuse: U.S. Preventive Services Task Force Recommendation
Statement. Annals of Internal Medicine. Downloaded from http://annals.org/.
NIDA: Health consequences of drug misuse. (2017). Retrieved from
https://www.drugabuse.gov/related-topics/health-consequences-drug-misuse
Office of National Drug Control Policy. (2008). Screening and brief intervention fact sheet.
Retrieved from http://www.ondcp.gov/publications/pdf/screen_brief_intv.pdf
Substance Abuse and Mental Health Services Administration. Behavioral Health Barometer: Vermont, 2013. HHS Publication No. SMA-13-4796VT. Rockville, MD: Substance
Abuse and Mental Health Services Administration, 2013.
Substance Abuse and Mental Health Services Administration. Behavioral Health Barometer: Vermont, Volume 4: Indicators as measured through the 2015 National Survey on Drug
Use and Health, the National Survey of Substance Abuse Treatment Services, and the Uniform Reporting System. HHS Publication No. SMA–17–Baro–16–States–VT. Rockville, MD: Substance Abuse and Mental Health Services Administration, 2017.
SAMHSA (2015). About Screening, Brief Intervention, and Referral to Treatment (SBIRT).
SAMHSA-HRSA Center for Integrated Health Solutions (2018). SBIRT: screening, brief intervention and referral to treatment. Retrieved from
https://www.integration.samhsa.gov/clinical-practice/sbirt
Shuckit, M. A. (2009). Alcohol-use disorders. Lancet, 373, 492-501.
Vermont Department of Health (2017). Alcohol & drug abuse program data and reports.
Retrieved from http://www.healthvermont.gov/alcohol-drugs/reports/data-and-reports
Vermont Department of Health (2017). Alcohol & drug abuse program data and reports.
Retrieved from http://www.healthvermont.gov/alcohol-drugs/reports/data-and-reports