A BEE COLONY OPTIMIZATION
ALGORITHM FOR CODE COVERAGE
TEST SUITE PRIORITIZATION
DR. ARVINDER KAUR
Associate Professor
University School of Information Technology, Guru Gobind Singh Indraprastha University, Dwarka, Sec 16C
Delhi, India
SHIVANGI GOYAL
Research Scholar
University School of Information Technology, Guru Gobind Singh Indraprastha University, Dwarka, Sec 16C
Delhi, India
Abstract:
Regression testing is the verification process of the modified software in the maintenance phase. Due to the budget and time constraints regression test suite size and its selection is a critical issue for testers. A Bee Colony Optimization (BCO) algorithm for the regression test suite prioritization has been developed and is presented in this paper. The behavior of two types of bees; scout bees and forager bees have been observed and used for test suite prioritization. The proposed algorithm has been explained using examples based on maximum code coverage. The Average Percentage of Conditions Covered (APCC) metrics have been used to show the effectiveness of proposed algorithm.
Keywords: Bee Colony Optimization, Regression Testing.
1. Introduction
After development and release, software undergo regress maintenance phase of ten to fifteen years. Modifications in software may be due to change in customer’s requirements or change in technology/platform. This leads to release of numerous versions/editions of the existing software. Also in case of the version/edition’s test only modified and affected parts are to be tested to impart confidence in the modified software which is the process of regression testing. During development phase, time and budget of software permits for its thorough testing but same is not the case for regression testing. So, effective and intelligent prioritization of the actual software’s test suite has to be done to make remarkable savings of time and budget.
Several attempts have been made in finding techniques/algorithms for the regression test suite prioritization. The time-constrained regression testing can be reduced to NP-complete problem (0/1 knapsack problem) [Alspaughy et al (2007)] which can be solved using algorithms such as Greedy algorithms [Li et al (2007)], non-evolutionary algorithms [Byson (1995)], [Crawford and Williams (1985)], non-evolutionary algorithms [Al-Salami (2009)], optimization algorithms [Singh (2010)] etc. The Optimization Algorithms are mainly used where problem is optimized based on some given function or criteria available in sample space. Hence optimization algorithms are quite effective in test suite prioritization of modified software. In this paper the optimization phenomenon used is the Bee Colony Optimization System where nature of bees have been observed, studied and mapped to find prioritization of the modified software’s test suite.
develop test cases quickly and efficiently. This algorithm automates the test suite prioritization process as per the bee colony optimization criteria.
Organization of the paper is as follow. Related work is presented in section 2, BCO method has been explained in section 3. Section 4 presents the formalized BCO algorithm for regression test suite prioritization, in section 4.2 the explanation of the algorithm is given, 5 presents the prioritization of test cases based on total code coverage with an example demonstrating the working of the BCO algorithm in section 5.1. Section 6 gives the comparison of various prioritization approaches to BCO. And finally in the succeeding sections threats to validity, conclusion and future work are presented.
2. Related Work
In this section an overview of the related work of test case prioritization techniques and areas of application of Bee Colony Optimization technique has been presented. The prioritization Problem has been addressed by many researchers and they have proposed various techniques for it. Many techniques used for prioritization are “total fault-detection technique” [Rothermal et al (1999)] in which our aim is to detect all the faults inserted in the given code. For effective searching and selection of useful test cases in the process of prioritization some algorithm applied are: “Greedy algorithms” [Li et al (2007)], where test cases are picked using greedy approach i.e. picking the best one first, “Evolutionary algorithms” [Al-Salami (2009)] where test cases evolves with each other to make a prioritized test suite, “Non-evolutionary algorithms” [Byson (1995)], [Crawford and Williams (1985)] where goal based prioritization is done and “Ant colony optimization algorithms” [Singh et al (2010)] where the concept of natural ants has been used to address the test case prioritization problem. In regression testing version specific criteria is useful in some conditions when organization doesn’t want testing to be over-budget, in such cases “Version specific algorithms” [Singh et al (2008)] are useful for prioritization of only specific kinds/versions of test suits unlike general specific test suite prioritization which are meant for any types of regression test suite prioritization. There is another criterion to solve prioritization problem that is to analyze the relationship between variables being changed and their usage in other/new variables that are done using “Variable analysis algorithms” [Singh et al (2008)].
Bee Colony Optimization is an emerging field for researchers. It has been applied to areas like “Optimization of problems” [Saab et al ] where the optimal solution is searched on the basis of some known function. “Travelling Salesman Problem” [Wong et al (2008)] which is NP-Hard combinatorial problem where an optimal path is searched from source to destination. “Scheduling problems” [Chong et al (2006)] like job shop scheduling problems, task scheduling, project scheduling, process scheduling etc. and for solving other combinatorial problems like “Generation of pair-wise test sets” [McCaffrey (2009)] where automated test case generation is done. The concept of BCO is used for solving “Sudoku Puzzles” [Pacurib et al (2009)], and routing problems where optimized path for better routing is searched using “Routing Algorithm” [Rahmatizadeh et al (2009)]. Moreover, bee colony optimization has also been applied in the area of “Web Search” for effective search engine mechanism [Navrat et al (2009)]. The bee colony optimization has also been used for understanding the concept of software test suite prioritization [Mala and Mohan (2009)]. The bee’s concept has also been used for optimization approaches in the field of engineering [Yang (2005)].
3. Bee Colony Optimization (natural phenomenon of bee colony)
Bee Colony Optimization is the name given to the colony formed by the mutual understanding of the natural bees in the food foraging process. In spite all the creatures on this earth follow one or the other mechanism/process to find food that suite them and these mechanism are found in insects like ants, bees or cockroaches.
Honey bee comb build-up and management is a classic example of teamwork, experience, co-ordination and synchronization. The way the honey bees find, build and maintain their comb and hive is remarkable. These are the factors which have given rise to interest of researchers to find solutions to their problems.
In a natural honey bee hive there are a variety of bees with specific role(s) to perform. There are three types of bees:
1. Queen Bee (one)
She is responsible to lay eggs which are used to build new colonies.
2. Male Drone Bees (many)
These are responsible for mating with the queen bee.
3. Worker Bees (thousands)
3.1. The Scout Behavior
In the scout behavior there are following steps:
i. The scout bees start from the hive in search of food source randomly.
ii. They keep on this exploration process until they are out of energy/tired and return back to the hive. iii. When they return back to the hive, they share their experience and knowledge with the forager bees by
performing the mechanism called “waggle dance”. (Waggling is a form of dance in circular direction in the shape of digit 8. It is repeated again and again by a bee. Its intensity and direction gives the idea of food source quality and food source location respectively to other bees).
iv. It is the means by which the bees communicate. It is used to convey the parameters like foods Source Quality, distance of food source from hive, Location of food source w.r.t. sun, to guide the path to the available forager bees.
v. These steps of the scout bees constitute the first step of the BCO process called the “Path Construction”.
3.2. The Forager Behavior
In the Forager behavior, the forger bees do the following:
i. The Forager bees observe and learn the steps done by the scout bees while waggling so as to ease their journey.
ii. Then these forager bees go to the food sources as guided by the scout bees to exploit them iii. These forms the second step of the BCO process called the “Path Restructuring”.
4. Proposed BCO Algorithm
Artificial bee colony system has been modeled in [Owaied and Saab (2008)]. This paper presents a new optimization algorithm that maps the food foraging behavior of natural bees as a procedure to prioritize regression test suite’s test cases. This algorithm takes the test cases as food sources, the number of conditions detected upon execution time of each test case as the food source quality and number of test cases as the number of scout bees, number of forager bees which makes the initial population.
Following is the basic flow of the BCO Algorithm:
Figure 1. Basic flow of BCO Algorithm.
Following is the list of notations that are being used in the proposed algorithm: i. Nbee : Total number of bees (Initial Population)
ii. NSB : Number of scout bees iii. NFB : Number of forager bee iv. Ei : Energy at ith iteration
vi. SBi : ith Socut Bee vii. FBi : ith Forager Bee viii. PSBi : Path of SBi
ix. PFBi : Path of FBi
x. ET : Execution time of test case xi. CC : Number of Condition covered
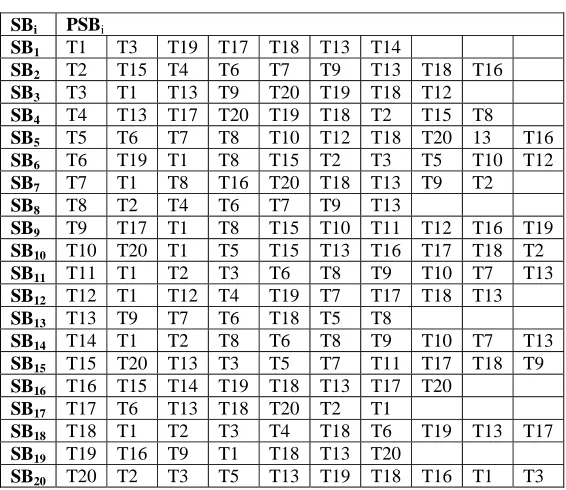
In execution of the algorithm following two tables will be formed: 1. PSB Table
Path of Scout Bee Table, as seen in Table 2 contains all the paths visited (explored) by the SB. It is used for the path construction phase of SB. This table will act as input for the path restructuring phase which is done by FB. 2. PFB Table
Path of Forager Bee Table, as seen in Table 3 contains all the paths selected (exploited) by the FB. An account of the total ET of each path is also kept in this table. This table helps in final path selection.
4.1. BCO Algorithm
Following are the proposed algorithm’s main steps: 1) Assumptions
i. The food sources have been identified.
ii. The distance between hive to food source, food source to food source, food source to hive is unity. iii. Any food source is visited only once.
iv. Each SBi will start the random search from ith food source. v. Each FBi will exploit only SBi path.
vi. E0 (Initial energy level of of SB and FB) is 100%.
vii. Energy reduction rate is set up such that only 50% of the test suite gets executed.
viii. FSQi=number of conditions covered/Execution Time=CC/ET (1) ix. Stopping criteria
i. Total number of condition covered,
ii. Ei = 0; Ei =1- i*energy reduction rate. (2)
2) Initializations
i. Nbee = NSB + NFS
ii. NSB = NFB = number of test cases in the test suite under test. iii. E0 = 100%.
3) BCO Module START
(1)Repeat NSB times(Path construction) {
Repeat until stopping criteria is met
Each SBi starts exploring from ith food source randomly and forms PSBi (Table 2). }
(2) Repeat NFB times (Path Structuring)
Each FBi starts exploiting PSBi to form PFBi (Table 3). (3) Final Path Selection
Choose path PFBi with minimum ET. STOP
4.2. Explanation of the BCO Algorithm 1. Path Construction
This is the first step in the execution of the algorithm. This step is executed by the scout bees, NSB times, in order to explore all the food sources (Test Case) available. The SBi starts its exploration process from the ith food source (Test Case). After this they explore the test cases randomly until any one of the stopping criterion is met. Each path PSBi constructed by the SBi is entered into the PSB Table.
2. Path Restructuring
and total code coverage (stopping criteria). Also the summation of the ET of all the test cases present in a particular PFBi is done to get that path’s total ET. All these entries are maintained in PFB Table.
3. Path Selection
This is the final step of the algorithm done by the FBi. From the PFB table select the PFBi with minimum Total ET.
4.3. Analysis of the BCO algorithm
The running time of BCO Algorithm is bounded by time required to construct path, plus exploring each path ‘n’ number of times and cost for path structuring. For the population of size ‘n’, the path construction requires O(n) operations . All ‘n’ particles in population will go through ‘n’ iterations for completing the process of path construction in the proposed BCO algorithm. For the path structuring step all the ‘n’ individuals will go for n iterations to structure the path. Hence, taking O(n2) operation complexity. For the final path selection step only minimization process will take place which takes O(n) operations.
Therefore, the best running time of proposed algorithm is O(n2) + O(n2)+ O(n), which makes the final running time as O(n2).
5. Prioritization based on Maximum Code Coverage
Prioritization based on structural testing allows prioritize/reorder the test cases based on the internal workings of the code. Structural testing is also called path testing since test cases are chosen that cause paths to be taken from different parts (structure) of the program. There are certain levels of coverage in path testing namely statement coverage, branch coverage, condition coverage and path coverage. Each level of coverage indicates the level of testing. As we move towards the higher level, more difficult and complete the testing process becomes. The aim of path testing is to attain the highest level of coverage that is condition coverage.
The logical flow of a program can be analyzed using graphical representation known as the flow graph. Flow graph generation is the first step of path testing. Then the decision to decision (DD) path graph is generated from the flow graph. It is used to find independent paths. In DD path graph all the sequential nodes are clubbed into a single node leaving behind the decision nodes. An independent path is any path through the DD path graph that introduces at least one new statement node or condition node. Therefore, we need to execute all the independent paths at least once during the process of path testing.
5.1. Example 1
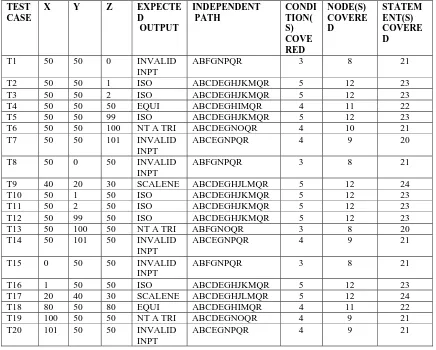
The example taken for code coverage is the triangle problem which takes the three sides (a positive integer in the range of 0 to 100) of the triangle as input and gives the output as scalene, isosceles, equilateral, not a triangle and invalid inputs according to the input. [Aggarwal and Singh (2001)]. The DD Path graph of the triangle problem is given in Figure 2. The test cases, inputs, expected outputs, independent paths, conditions, nodes and statements covered are shown in the Table 1.
Figure 2. DD Path graph of Triangle problem.
Following are the independent paths of the triangle problem: i. ABFGNPQR
v. ABCEGNPQR vi. ABCDEGHJLMQR vii. ABFGNOQR
Table 1. Test cases with inputs, outputs, independent path, numbers of conditions covered, statements covered and nodes covered.
TEST CASE
X Y Z EXPECTE D
OUTPUT
INDEPENDENT PATH
CONDI TION( S) COVE RED
NODE(S) COVERE D
STATEM ENT(S) COVERE D
T1 50 50 0 INVALID
INPT
ABFGNPQR 3 8 21
T2 50 50 1 ISO ABCDEGHJKMQR 5 12 23
T3 50 50 2 ISO ABCDEGHJKMQR 5 12 23
T4 50 50 50 EQUI ABCDEGHIMQR 4 11 22
T5 50 50 99 ISO ABCDEGHJKMQR 5 12 23
T6 50 50 100 NT A TRI ABCDEGNOQR 4 10 21
T7 50 50 101 INVALID
INPT
ABCEGNPQR 4 9 20
T8 50 0 50 INVALID
INPT
ABFGNPQR 3 8 21
T9 40 20 30 SCALENE ABCDEGHJLMQR 5 12 24
T10 50 1 50 ISO ABCDEGHJKMQR 5 12 23
T11 50 2 50 ISO ABCDEGHJKMQR 5 12 23
T12 50 99 50 ISO ABCDEGHJKMQR 5 12 23
T13 50 100 50 NT A TRI ABFGNOQR 3 8 20
T14 50 101 50 INVALID INPT
ABCEGNPQR 4 9 21
T15 0 50 50 INVALID INPT
ABFGNPQR 3 8 21
T16 1 50 50 ISO ABCDEGHJKMQR 5 12 23
T17 20 40 30 SCALENE ABCDEGHJLMQR 5 12 24
T18 80 50 80 EQUI ABCDEGHIMQR 4 11 22
T19 100 50 50 NT A TRI ABCDEGNOQR 4 9 21
T20 101 50 50 INVALID
INPT
ABCEGNPQR 4 9 21
Table 2.Path Constructed by scout bee. (PSB Table).
SBi PSBi
SB1 T1 T3 T19 T17 T18 T13 T14
SB2 T2 T15 T4 T6 T7 T9 T13 T18 T16
SB3 T3 T1 T13 T9 T20 T19 T18 T12 SB4 T4 T13 T17 T20 T19 T18 T2 T15 T8 SB5 T5 T6 T7 T8 T10 T12 T18 T20 13 T16
SB6 T6 T19 T1 T8 T15 T2 T3 T5 T10 T12
SB7 T7 T1 T8 T16 T20 T18 T13 T9 T2
SB8 T8 T2 T4 T6 T7 T9 T13
SB9 T9 T17 T1 T8 T15 T10 T11 T12 T16 T19 SB10 T10 T20 T1 T5 T15 T13 T16 T17 T18 T2
SB11 T11 T1 T2 T3 T6 T8 T9 T10 T7 T13
SB12 T12 T1 T12 T4 T19 T7 T17 T18 T13
SB13 T13 T9 T7 T6 T18 T5 T8
SB14 T14 T1 T2 T8 T6 T8 T9 T10 T7 T13
SB15 T15 T20 T13 T3 T5 T7 T11 T17 T18 T9 SB16 T16 T15 T14 T19 T18 T13 T17 T20
SB17 T17 T6 T13 T18 T20 T2 T1
SB18 T18 T1 T2 T3 T4 T18 T6 T19 T13 T17 SB19 T19 T16 T9 T1 T18 T13 T20
SB20 T20 T2 T3 T5 T13 T19 T18 T16 T1 T3
Step 2. Forger bee performs path restructuring and creates PFB Table, Table 3.
Table 3.Path restructured by Forager bee. (PFB Table).
FBi PFBi
FB1 T3 T17 T18 T19 T14 T1 T13
FB2 T2 T9 T4 T6 T7 T15 T13
FB3 T3 T9 T20 T19 T18 T1 T13 FB4 T2 T17 T18 T19 T20 T15 T13 FB5 T5 T6 T7 T8 T13 T16 T18
FB6 T6 T1 T2
FB7 T7 T1 T16 T18 T13 T9
FB8 T2 T9 T4 T6 T7 T8 T13
FB9 T9 T1 T16 T16
FB10 T10 T20 T1 T3 T17 T18 FB11 T11 T1 T6 T9 T7 T13
FB12 T12 T1 T4 T19 T7 T17 T13
FB13 T9 T5 T18 T6 T7 T13 T8
FB14 T14 T1 T2 T6 T9 T13 FB15 T15 T20 T13 T3 T5 T17 T18 FB16 T16 T15 T14 T19 T18 T13 T17 FB17 T17 T19 T18 T2 T20 T15 T13 FB18 T18 T1 T2 T6 T13 T17 FB19 T9 T16 T19 T18 T20 T1 T13 FB20 T20 T2 T13 T19 T18 T1
Step 3. Forger bee performs final path selection. Hence, following are the final prioritization
1. T3 T17 T18 T19 T14 T1 T13
2. T2 T9 T4 T6 T7 T15 T13
3. T3 T9 T20 T19 T18 T1 T13
4. T2 T17 T18 T19 T20 T15 T13
5. T2 T9 T4 T6 T7 T8 T13
6. T9 T5 T18 T6 T7 T13 T8
8. T9 T16 T19 T18 T20 T1 T13
9. T16 T15 T14 T19 T18 T13 T17
10. T17 T19 T18 T2 T20 T15 T13
Hence, we have achieved maximum code coverage by getting only 7 test cases in the prioritized test suite for the test suite of 20 test cases.
(We are getting so many paths because there is no ET in this example. Otherwise the path with minimum ET could have been chosen.)
6. Comparison
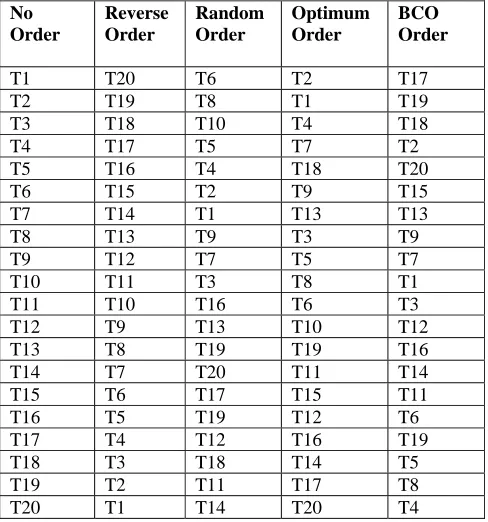
The example mentioned in section 5.1 is compared with respect to the following ordering: No order, Reverse order, Random order, Optimal order of the test cases. The orderings with respect to these approaches for example in section 5.1 is listed in Table 4. These approaches are compared by calculating Average Percentage Condition Coverage (APCC) [Askarunisa (2009)] in Table 5 for the maximum code covered concept.
APCC = [1 – ({TC1 + TC2 + ………..+ TCm}/mn) + (1/2n)] (3)
Where, T - The test suite under evaluation
m - The number of conditions contained in the program under test P. n - The total number of test cases in the test suite and
TCi - The position of the first test in T that exposes i th
condition.
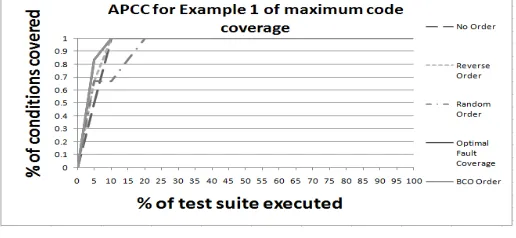
The results obtained for the example explained above have been plotted in Figure. 3. These show that the APCC values for the prioritization achieved using BCO are comparable to that obtained with the optimum ordering.
Table 4. Order of test cases for various prioritization approaches for example 1 of maximum code coverage.
No Order
Reverse Order
Random Order
Optimum Order
BCO Order
T1 T20 T6 T2 T17
T2 T19 T8 T1 T19
T3 T18 T10 T4 T18
T4 T17 T5 T7 T2
T5 T16 T4 T18 T20
T6 T15 T2 T9 T15
T7 T14 T1 T13 T13
T8 T13 T9 T3 T9
T9 T12 T7 T5 T7
T10 T11 T3 T8 T1
T11 T10 T16 T6 T3
T12 T9 T13 T10 T12 T13 T8 T19 T19 T16
T14 T7 T20 T11 T14
T15 T6 T17 T15 T11 T16 T5 T19 T12 T6 T17 T4 T12 T16 T19 T18 T3 T18 T14 T5 T19 T2 T11 T17 T8
T20 T1 T14 T20 T4
Table 5. APFD values of various prioritization approaches for example 1 of maximum code coverage.
Technique APCC %
No Order 90
Figure 3. APCC chart for example 1 of maximum code coverage. 7. Threats to Validity
The artificial BCO algorithm which has been presented here has certain short comings which are as follows: 1. In the natural BCO the number of scout bees is 5-10% of forager bees which are assumed to be equal in
the algorithm proposed here.
2. The concept of waggle dance was not required so has not been incorporated in the algorithm which is used as a means of communication in the natural BCO.
3. The energy reduction rate has been chosen such that only 50% of the test suite gets executed which leaves the remaining test suite unexplored. Since it executes upto 50% of the test suite, manual execution of small test suites is possible. As the size of test suite increases the manual execution of the test suite becomes difficult and cumbersome.
8. Conclusion and Future Work
An artificial bee colony optimization algorithm for the regression test suite prioritization has been developed and presented by studying the natural food foraging behavior of bees. This algorithm makes effective use of the path construction (exploration) and path structuring (exploitation) phenomenon of scout bees and forager bees for the prioritization of the test suite of the modified code. The proposed BCO algorithm has been explained using example on maximum code coverage. The effectiveness of this algorithm has well been demonstrated using APCC metric. The results of prioritization are comparable to the optimal ordering values.
Due to the manual execution of this algorithm, it has been applied to test suites with less number of test cases. So to apply it to larger programs, there is a need to automate this algorithm. Therefore an automation tool for the complete usage of the algorithm is being developed.
9. References
[1] Aggarwal, K. K.; Singh, Y. (2001): A book on software engineering. New Age International (P) Ltd.; Publishers, 4835/24, Ansari Road, Daryaganj, New Delhi.
[2] AL-Salami, N.M.A. (2009): Evolutionary Algorithm Definition, American J. of Engineering and Applied, Science Publications, pp.789-795.
[3] Alspaughy, S.; Walcotty, K. R.; Belanichz, M.; Kapfhammerz, G. M.; Soffa, M. L. (2007): Efficient Time-Aware Prioritization with Knapsack Solvers, Proceedings of the ASE 2007 Workshop on Empirical Assessment of Software Engineering Languages and Technologies. Atlanta, Georgia, pp. 1-6.
[4] Askarunisa, A.; Shanmugapriya, L.; Ramaraj, N. (2009): Cost and Coverage Metrics for Measuring the Effectiveness of Test Case Prioritization Techniques, INFOCOMP Journal of Computer Science, pp. 1-10.
[5] Byson, N. (1995): A goal programming method for generating priorities vectors, Journal of Operational Research Society, Palgrave Macmillan Ltd.,Houndmills, Basingstoke, Hampshire, RG21 6XS, England, pp. 641-648.
[6] Chong, C. S. et. al. (2006): A Bee Colony Optimization Algorithm to Job Shop Scheduling, Journal Winter Simulation Conference, Monterey, CA, pp. 1954-1961.
[7] Crawford, G.; Williams, C. (1985): A note on the analysis of subjective judgment matrices, Journal of Mathematical Psychology, The Rand Corporation, USA, pp. 387-405.
[8] Li, Z.; Harman, M.; Hierons, R.M. (2007): Search algorithms for regression test case prioritization, IEEE Transactions on Software Engineering, San Francisco, CA, USA, pp. 225-237.
[9] Mala, D. J.; Mohan, V. (2009): ABC Tester - Artificial Bee Colony Based Software Test Suite Optimization Approach, International Journal of Software Engineering, Sprinter Global Publication, pp. 15-43.
[10] McCaffrey, J. D. (2009): Generation of pair wise test sets using a simulated Bee Colony Algorithm, 10th IEEE International Conference, IEEE Press Piscataway, NJ, USA, pp. 115-119.
[11] Navrat, P.; Jelinek, T.; Jastrzembska, L. (2009): Bee hive at work: A problem solving, optimizing mechanism, In Proceedings of Nature & Biologically Inspired Computing, IEEE Conferences, Coimbatore, pp. 122-127.
[12] Owaied, H.; Saab, S. (2008): Modeling Artificial Bees Colony System, ICAI, Proceedings of the 2008 International Conference on Artificial Intelligence, Las Vegas, Nevada, USA, pp.443-446.
[13] Pacurib, J. A.; Seno, G.M.M.; Yusiong, J.P.T. (2009): Solving Sudoku Puzzles Using Improved Artificial Bee Colony Algorithm, Fourth International Conference on Innovative Computing, Information and Control, Kaohsiung, Taiwan, pp. 885-888.
[14] Rahmatizadeh, Sh.; Shah-Hosseini, H.; Torkaman, H. (2009): The ant-bee routing algorithm: A new Agent based Nature-Inspired Routing Algorithm, Journal of Applied Sciences, Addison Wesley Publishers, Harlow. Esses. UK, pp. 983-987.
[15] Rothermel, G. Untch, R.H.; Chu, C.; Harrold, M.J. (1999): Test Case Prioritization: An Empirical Study, In Proceedings of the International Conference on Software Maintenance, Oxford, UK, pp. 179-188.
[17] Singh, Y.; Kaur, A.; Suri, B. (2006): A New Technique for Version – Specific Test Case Selection and Prioritization for Regression Testing, Journal of the CSI, pp 23-32.
[18] Singh, Y.; Kaur, A.; Suri, B. (2008): Regression Test Selection And Prioritization Using Variables: Analysis And Experimentation, New Age International Publishers, New Delhi, pp. 1-15.
[19] Singh, Y.; Kaur, A.; Suri, B. (2010): Test Case Prioritization Using Ant Colony optimization, Association in Computing Machinery ,Newsletter ACM SIGSOFT Software Engineering Notes, New York, NY, USA, pp 1-7.
[20] Wong, L.P.; low, M. Y. H.; Chong, C. S. (2008): A Bee Colony Optimization Algorithm for Travelling Salesman Problem, Second Asia International Conference on Modeling & Simulation, IEEE Computer Society, Washington, DC, USA, pp. 818-823.