http://www.sciencepublishinggroup.com/j/ijmi doi: 10.11648/j.ijmi.20190702.13
ISSN: 2330-8303 (Print); ISSN: 2330-832X (Online)
Diagnostic Accuracy of Shear Wave Elastography in
Differentiation Between Benign and Malignant Solid Breast
Masses Compared with Strain Elastography
Mohamed Mohamed Hefeda
1, Mohammed Abdallah Hablus
21
Radiology Department, Tanta University, Tanta, Egypt
2Department of general surgery Faculty of Medicine, Tanta University, Tanta, Egypt
Email address:
To cite this article:
Mohamed Mohamed Hefeda, Mohammed Abdallah Hablus. Diagnostic Accuracy of Shear Wave Elastography in Differentiation Between Benign and Malignant Solid Breast Masses Compared with Strain Elastography. International Journal of Medical Imaging.
Vol. 7, No. 2, 2019, pp. 44-56. doi: 10.11648/j.ijmi.20190702.13
Received: May 24, 2019; Accepted: July 8, 2019; Published: August 14, 2019
Abstract:
The aim of this study was to evaluate the diagnostic performance of shear wave elastography by acoustic radiation force impulse (ARFI) elastography in differentiating malignant and benign breast Lesions in comparison with strain elastography and B mode ultrasound. This was prospective study, we used the commercially available eSie touch elastographyimaging. In the shear wave elastography (SWE) we had two modes, the virtual touch imaging (VTI) with interpretation with
the 5 points elasticity score and virtual touch quantification (VTQ) technique with the calculation of the Shear wave velocity (SWV). The study included 142 solid breast masses, of them 75 (52.8%) were benign and 67 (47.2%) were malignant. The mean shear wave velocity differed significantly between the benign and malignant groups (2.4+1.3m/sec and 7.3+2.2m/sec respectively, P value <0.0001). the sensitivity, specificity, PPV, NPV and accuracy of strain (eSie touch) elastography score was 83.1%, 88.73%, 88.06%, 84% and 85.92% respectively, which was less than the elastography score by ARFI (92.42%, 92.11%, 91.04%, 93.33% and 92.25% respectively) and less than the VTQ (SWV) which was 94.03%, 95.95%, 95.45% and 95.04% respectively. We concluded that Both the SWE and SE elastography showed significant difference between the benign and malignant masses, and both has added value above B mode ultrasound during routine examination. Shear wave elastography had higher sensitivity and specificity than SE, and less false negative and false positive results. The quantitative SWE (SWV) had the highest diagnostic performance among the different studied techniques.
Keywords:
Breast Masses, Shear Wave Elastography, Strain Elastography, ARFI, VTQ1. Introduction
Among Egyptian females, breast cancer is the most common cancer in all regions, with estimated incidence rate of 26.8%-38.7% of all female cancers [1]. Worldwide, 458000 women die every year because of cancer breast [2]. Successful treatment and improvement of 5 year survival depends on early detection. Mammography and ultrasound are the usual screening techniques, but mammography is not accurate in dense breasts [3] and B mode ultrasound has low specificity [4, 5].
Elastography, a relatively new technique measuring the tissue stiffness similar to clinical palpation, is presumed to increase the specificity of the ultrasound [6, 7]. Two
elastography techniques used in breast imaging are strain or free hand elastography and shear wave elastography. The strain elastography measures the relative tissue displacement under compression. The strain elastography depends on external compression, making the technique operator dependent, non reproducible and with considerable inter-observer variability [8, 9].
International Journal of Medical Imaging 2019; 7(2): 44-56 45
mode called Virtual touch tissue quantification (VTQ) which calcaulates the SWV within a region of interest (ROI). The stiffer the tissue, the higher will be the SWV. The other mode is the qualitative mode, called virtual touch tissue imaging (VTI) which creates a static map or elastogram, The stiffer the tissue, the darker the mass [14]. Though the SWE is a reliable technique, still some errors may affect its accuracy, like excessive compression, misplacement of the region of interest, and movement [15, 16]. Also, the tumor may have internal heterogeneity with different elasticity regions [17].
Previous studies reported the accuracy of strain elastography and shear wave elastography in differentiation between benign and malignant breast lesions [18-22].
Both strain elastography and shear wave elastography has their own drawbacks which may lead to false positive and false negative results, and other factors like skin thickness, heterogeneity of the lesion, and the histologic type may affect one technique more than the other.
The aim of this study was to evaluate the diagnostic performance of ARFI elastography in differentiating malignant and benign breast Lesions in comparison with strain elastography and B mode ultrasound.
2. Patients and Methods
2.1. Patients
This prospective study was conducted from October 2017 to February 2019. The study included 142 patients. The inclusion criteria was: 1-patients with solid soft tissue mass by palpation and ultrasound. 2- Available mammography, full ultrasound data, and elastographic findings. 3- Available final pathological diagnosis. The Exclusion criteria was: 1- patients with breast cysts or breast abscesses. 2- Previous chemotherapy or radiotherapy. 3- Patients with no histopathological examination. 4-Patients with multiple masses because of difficulty in correlating pathological results with ultrasound results. Informed consent was obtained from all patients.
At the end of the study, data of 143 lesions were available from 143 patients, mean age + SD = 49 + 5.3years, range 22-69 years.
Mammography was available for all patients, The breast tissue density was classified according to American College of Radiology’s BI-RADS category [23].
Of the 142 lesions, 67 (47.2%) were malignant and 75 (52.8%) were benign.
2.2. Ultrasound Machine
All patients underwent a sonographic examination using a Siemens ACUSON S3000 diagnostic ultrasound system (Siemens Medical Solutions, Erlangen, Germany). A Siemens 9L4 linear probe with a frequency range of 4–9 MHz was used in conventional ultrasonographic, color Doppler, and elastographic examinations.
2.3. B Mode Ultrasound
At first, B mode ultrasound was performed on both sides with the patient in the supine position and her arm under head, Using a radial scanning pattern, both breasts were examined systematically. The lesions were identified and documented by B mode picture in two planes. Each lesion was assigned a BI-RADS category according to ACR guidelines including shape, echo pattern, margin, orientation, and posterior acoustic features. The lesions were categorized as 1- BI-RADS 3: Probably benign. 2- BI-RADS 4a: Low suspicious of malignancy. 3-BI-RADS 4b: suspicious malignancy. 4-BI-RADS 4c: high suspicious of malignancy. 5-BI-RADS 5: high suspicious of malignancy.
The axillary lymph nodes was assessed for the size, shape, short axis diameter, hilum, presence of degeneration or calcification and the type of vascularity.
2.4. Strain Elastography (SE)
For strain elastography, we used the commercially available eSie touch elastography imaging provided by Siemens. It is a free hand technique. Elastograms either presented in black and white mode or color mode. In the black and white mode the stiff tissues are dark and soft tissue are white, In color mode, hard lesions appear red and soft lesions appear blue, with color mode can be inversed. The target lesion was lightly compressed by the transducer. The region of interest included subcutaneous fat and pectoralis muscle. We used the black and white and the color mode in all cases, with the scale adjust that the blue represent no strain (hardest tissue).
The evaluation of elasticity score according to the classification proposed by Itoh et al [24]. Score 1 indicated even strain for the entire lesion, score 2 indicated strain in most of the lesion with small strain free areas, score 3 indicated strain in the periphery of the lesion sparing its center, score 4 when the entire lesion show no strain, and score 5 when no strain in the lesion and surrounding structures.
Strain elastography was also applied for the axillary lymph nodes if enlarged and assessed in the same manner
2.5. Shear Wave Elastography (SWE)
The probe was placed gently on the skin, with no pressure. The probe was kept still and the patient was asked to stop breathing during acquisition of SWV or the VTI.
International Journal of Medical Imaging 2019; 7(2): 44-56 47
International Journal of Medical Imaging 2019; 7(2): 44-56 49
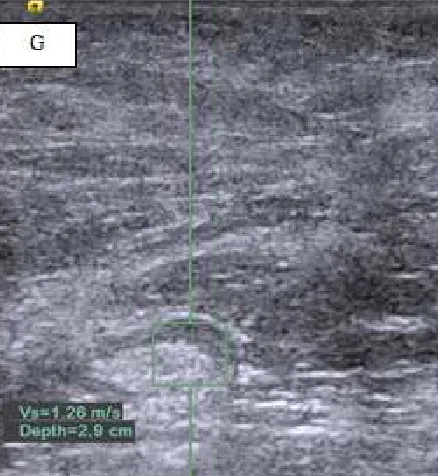
Figure 2. Patient aged 34 years with palpable breast lump. B mode ultrasound shows a large well defined hypoechoic bilobed soft tissue mass measuring 4.2 x 1.9cm, with lobulated outline which was classified as BIRADS 4a. Figure 1B & C: ARFQ, with SWV in the mass reported as 0.97 m/sec and 1.09m/sec (representing soft mass. The two measures was taken at different depths. (D) ARFI: shows type 2-3 elastogram with most of the mass displayed as green colored. (E) ARFI: with black and white mode, most of the mass displayed as gray. (F) Strain elastogram (eSie touch elastogram). The mass classified as type 2 elastogram. (G) ARFQ of axillary lymph node: SWV within the lymph node was 1.26 (soft). Histopathological diagnosis: Fibroadenoma.
In VTI mode, the ROI was placed to include the mass and surrounding apparently normal breast tissue. Also, the score used was the score suggested by Itoh et al [25]. The ARFI image was displayed as color image. A score of 1 displayed as homogenous color throughout the lesion with no red color, score of 2 displayed as mosaic pattern with red colon and other colors (Figure 2), score of 3 displayed as red color only in the central part, score of 4 displayed as entire lesion red colored, and score of 5 displayed as the lesion and surrounding structures were red colored. Lesions with score 1-3 are considered benign and lesions with score 4 or 5 were classified as probably malignant.
Both the quantitative and qualitative techniques were applied to the enlarged axillary lymph nodes.
2.6. Pathologic Examinations
Each breast lesion was diagnosed pathologically by radical surgery (42/142, 29.5%), excision biopsy (74/142, 52.1%), or core needle biopsy (26/157, 18.3%).
2.7. Statistical Analysis
Data were expressed as mean + standard deviation. All statistical analyses was performed using SSPS 17.0 (Chicago, USA). The Mann–Whitney U test was used to compare the median between two groups. The sensitivity, specificity, accuracy, positive predictive value (PPV), and negative predictive value (NPV) were calculated for imaging methods by comparing the presumed diagnosis with the final diagnosis. p-values < 0.05 were considered statistically significant
3. Results
3.1. Pathological Diagnosis
The study included 142 solid breast mass, of them 75 (52.8%) were benign and 67 (47.2%) were malignant. The pathological diagnosis is of all lesions is shown in Table 1. The most common benign tumor was fibroadenoma (82.6%), and the most common malignant tumor was invasive ductal carcinoma (77.6%). The mean age for patients in the benign group was 23.5 + 7.2years, while the main age in the malignant group was 47.5 + 6.1 years with statistically significant difference (P = 0.01).
Table 1. Pathologic diagnosis in 142 patients with solid breasr masses.
Pathologic diagnosis No %
Benign (75)
Fibroadenoma 62 82.6%
Papilloma 4 5.3 %
Fibro-lipoma 3 4.0 %
Scarring/fibrosis 5 6.6%
Malignant (67)
Invasive ductal carcinoma 52 77.6%
Invasive papillary carcinoma 9 13.4%
Invasive lobular carcinoma 6 9.0%
3.2. B Mode Ultrasound
BIRADS 4 or 5 (59/67, 88.1%). The difference was statistically significant (P value < 0.001).
Table 2. The mean age, tumor size SWV, elstography score, and type of ultrasound based BIRAD classification in the studied group.
Benign Malignant P Value
Age (Years) 23.5+7.2 47.5+6.1 0.01
BIRAD
Type 3 61 8
<0.001
Type 4 9 34
Type 5 5 25
Tumor size
< 1cm 37 27
0.71
1-2cm 14 19
> 2cm 24 21
Mean SWV (m/sec) 2.4+1.3m/sec 7.3+2.2m/sec < 0.0001
Mean elastography score (eSie touch) 2.28 4.01 0.01
Mean elastography score (AFRI) 2.04 3.80 0.001
3.3. Shear Wave Elastography and Strain Elastography
In the current study, the SWV of the lesions were classified as < 3.4m/sec, > 3.4m/sec and X.XXm/sec. For statistical purposes, we considered the value X.XX as 9.1 m/sec. The mean shear wave velocity differed significantly (P value < 0.0001) between the benign and malignant groups (2.4 + 1.3m/sec and 7.3 + 2.2m/sec respectively).
In the current study, we recorded the elastography score by strain elastography and shear wave elastography (VTI). The elastography score was higher in malignant masses than benign masses in both techniques, with the elastography
score tended to be higher with strain technique than shear wave technique (Table 2). The mean score in the malignant group was 4.01 with strain technique and 3.8 with the VTI technique. In the benign group the mean elastography score was 2.28 and 2.04 respectively. We compared the elastography score using the two techniques in the benign and malignant groups, and the difference was statistically insignificant (table 3). Using the VTI (shear wave) technique there was 5 false positive cases and 6 false negative cases among the studied group, while using the stain elatsography score, there was 12 cases false positive (figure 3), and 8 cases false negative (table 3).
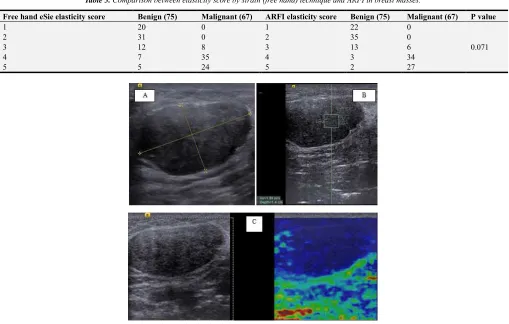
Table 3. Comparison between elasticity score by strain (free hand) technique and ARFI in breast masses.
Free hand eSie elasticity score Benign (75) Malignant (67) ARFI elasticity score Benign (75) Malignant (67) P value
1 20 0 1 22 0
0.071
2 31 0 2 35 0
3 12 8 3 13 6
4 7 35 4 3 34
5 5 24 5 2 27
International Journal of Medical Imaging 2019; 7(2): 44-56 51
Figure 4. Patient aged 64 years with palpable breast lump. B mode ultrasound shows a large well defined markedly hypoechoic soft tissue mass, with irregular outline which was classified as BIRADS 4c. Figure 4 B: ARFQ, with SWV in the mass reported as X.XX (representing hard mass. (C) ARFI: with black and white mode, most of the mass displayed as dark. (F) Strain elastogram (eSie touch elastogram). The mass classified as type 5 elastogram. Histopathological diagnosis: Invasive Lobular carcinoma.
International Journal of Medical Imaging 2019; 7(2): 44-56 53
Table 4. Distribution of SWV between benign and malignant groups.
SWV Benign (75) Malignant (67) P value
< 3.4m/sec 71 3
0.01
> 3.4m/sec 4 15
x. xxm/sec 1 49
In general, the reported sensitivity, specificity, PPV, NPV and accuracy of strain (eSie touch) elastography score was 83.1%, 88.73%, 88.06%, 84% and 85.92% respectively, which was less than the elastography score by ARFI
(92.42%, 92.11%, 91.04%, 93.33% and 92.25% respectively) and less than the VTQ (SWV) which was 94.03%, 95.95%, 95.45% and 95.04% respectively. (Table 5).
Table 5. Diagnostic performance of strain elastography score, ARFI score, SWV and B mode ultrasound in differentiation between benign and malignant breast masses.
Sensitivity Specificity PPV NPV Accuracy
eSie Touch free hand elasticity score 83.10% 88.73% 88.06% 84.00% 85.92%
ARFI elasticity score 92.42% 92.11% 91.04% 93.33% 92.25%
VTQ (SWV) 94.03% 95.95% 95.45% 94.67% 95.04%
B mode Ultrasound 80.82% 88.41% 88.06% 81.33% 84.51%
3.4. Axillary Lymph Nodes
In the current study, we used the same techniques in differentiation between benign and malignant axillary lymph nodes. We had the pathological results of 127 lymph nodes (83 malignant and 45 benign lymph nodes). Using SWV less
than 6m/sec as cut off value between benign and malignant node, we had 28 false negative and 6 false positive results (table 6). Also, the elatography score with ARFI had 10 false negative results and 5 false positive results and using the strain elastography score, we had 13 false negative results and 10 false positive results (Table 7).
Table 6. Distribution of SWV among benign and malignant axillary lymph nodes.
SWV Benign (45) Malignant (83) P value
< 6m/sec 39 28
0.01
> 6m/sec 3 37
X. XX + m/sec 3 18
Table 7. Comparison between elasticity score by free hand technique and ARFI in axillary lymph nodes encountered in the study.
Free hand eSie elasticity score Benign (45) Malignant (83) ARFI elasticity score Benign (45) Malignant (83) P value
1 11 0 1 12 0
0.05
2 18 0 2 20 0
3 6 13 3 8 10
4 6 35 4 3 37
5 4 35 5 2 36
In general, the accuracy of all the three techniques in differentiation between benign and malignant axillary lymph nodes was less than the acuuracy in differentiation between benign and malignant breast masses (Table 8).
Table 8. Diagnostic performance of strain elastography score, ARFI score and SWV in differentiation between benign and malignant axillary lymph nodes.
Sensitivity Specificity PPV NPV Accuracy
eSie Touch free hand elasticity score 87.50% 72.92 % 84.34% 77.78 % 82.03%
ARFI elasticity score 87.95% 88.89 % 93.59% 80.00 % 88.28%
VTQ (SWV) 66.27% 89.09% 90.16% 63.64 % 75.36%
4. Discussion
In the last two decades, elastography has emerged as an important research field. It has been studied to assess the tissue stiffness with potential valuable impact on the diagnosis.
In this study, quantitative SWE had the highest sensitivity,
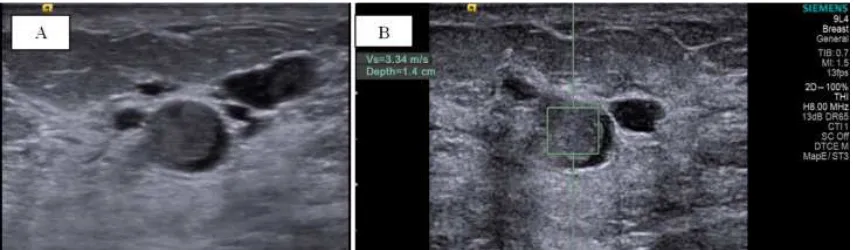
Figure 6. B mode ultrasound: (A) A well defined rounded solid soft tissue mass in a retro-areolar duct. (B) VTQ: The shear wave velocity of the mass was 3.34 m/sec. Diagnosis: Intraductal papilloma.
In the current study, the mean SWV in the benign masses was 2.4+1.3m/sec (figure 6) which is significantly lower than the mean SWV in the malignant masses 7.3 + 2.2m/sec, P value < 0.001. Our results are close to those of Jayaraman et al, who reported average shear wave velocity (SWV) of benign lesions to be 2.08 m/s and that of the malignant lesions was 6.28 m/s [27]. Also Tozaki et al, found the mean shear wave velocity was significantly higher in malignant lesions (4.49m/sec) than in benign lesions (2.68 m/s).
In VTI mode, we found the mean elasticity score for malignant masses to be significantly higher than benign masses. Our results are in agreement with previous studies using the same 5 point scoring system [18, 24, 28, 29].
In the current study the SWV of most malignant masses (49/67, 73.1%) was expressed as X.XX m/sec. According to manufacturer, SWV are expressed between 0 m/sec and 9.00 m/sec and velocities outside this range is expressed as X.XX. Only one benign case had the velocity expressed as X.XX m/sec. The reason for appearance of the expression X.XX m/sec may be due to very hard masses with velocities >9.00m/sec, presence of markedly heterogeneous tissue with absorption of ultrasound energy and the refraction of oblique waves at interfaces between tissues of different SWVs [27, 30]. In general, the system cannot measures SWV when the tissue does not vibrate enough [16].
In the literature, the cut off value used to discriminate between benign and malignant masses vary from 2.2m/sec to 4.5 m/sec [27, 30, 31]. In the current study we used 3.4m/sec which was suggested by Kim et al [24], and close to that of Tozaki et al [30], who used a cut off value of 3.6m/sec and reported a sensitivity of 91% and specificity of 80.6% in discrimination between benign and malignant masses. In the current study SWV (VTQ) had a sensitivity of 94.03%, specificity 95.95%, PPV of 95.67%, NPV 94.67% and accuracy of 95.04%. The excellent diagnostic performance of SWV is higher than the reported performance in the literature. The cause of this is that we considered the expression X.XX m/sec as very hard mass, and considered it 9.1m/sec in the mean value calculation. Bai et al [13] in a study included 143 patients reported sensitivity of 75.6% and 95.1% of SWV in differentiation between benign and malignant masses, however they
reported that in 63.4% of malignant lesions, it was not possible to measures the SWV. Also, Tozaki et al [27] in a study included 50 patients found in 23.5% of the patients with malignant masses that it is not possible to measure the SWV. We suggest that the appearance of X.XX m/sec expression persistently after several measures should be considered hard mass.
Of the three studied elastographic techniques, the strain elastogram (free hand elastography) showed the least diagnostic performance, with sensitivity of 83.10%, specificity of 88.73%, PPV of 88.06%, NPV 84.00% and overall accuracy of 85.92%. Previous studies reported sensitivity of 80-100% and specificity 80-95% of SE in differentiation between benign and malignant breast masses [18, 32-37].
Our results are not in agreement with those of Chang et al [38], who reported similar diagnostic performance of shear wave elastography and strain elastography in a study included 150 patients. However he found discrepant results between the two techniques in some cases, and he found the SWE to have higher sensitivity and the strain elastography to have higher specificity. In our study, we found SWE to have higher both sensitivity and specificity. The difference between our results may be due to we used different ultrasound equipments. Also they included in their study a cohort of women with small breasts, in our study we included mostly females with moderate or large breasts which is known technical limitation of strain elastography. There may be different reasons for the discrepancy between the SWE and SE in the same patient. First, the two techniques differ in forces being measured and the images produced. Second, technical errors may affect one elastographic technique than the other, with the use of suboptimal technique may affect the results. High inter and intra-observer variability was reported in SE because of the variability of degree of compression [9]. On the other hand false positive results may be reported in SWE because of pre-compression of the tissues resulting in increased SWV [16, 39]. Third, mal-placement of the ROI due to breathing movement, slipping of the probe during data acquisition may lead to false or false negative results in both techniques [20, 40].
International Journal of Medical Imaging 2019; 7(2): 44-56 55
positive results. The VTI we had 6 positive negative results and 5 false positive results. The free hand elastography had 8 false positive results and 12 false negative results. The false positive results is due to non deformable fibroadenoma or due to presence of excessive fibrosis [12]. On the other hand, false negative results seen with highly deformable cancer like mucinous carcinoma or cancer with inflammatory changes [12], deep lesions [10], or with dense breasts [9].
Seo et al, in a study included 37 patients, found similar diagnostic performance of shear wave elastography and strain elastography in differentiation between benign and malignant breast masses, and the combination between the two techniques yielded a higher diagnostic performance. Their results are not in agreement with the current study probably because of the relatively small number of patients in their study [41]. On the other hand Fujioka et al, in a recent study found better diagnostic performance of SWE than SE similar to our results, but they found similar diagnostic performance of quantitative and qualitative techniques [42]. In the current study, we found better diagnostic performance of the quantitative than qualitative techniques.
Silva et al [43], in a study on 100 bitches with mammary neoplasms reported high diagnostyic performance (100% sensitivity & 94% specificity) of ARFI in differentiation between benign and malignant lymph nodes. In the current study, all the three elastographic techniques had lower diagnostic performance than their performance in diagnosis of breast masses. The SWV even had the lowest sensitivity and accuracy compared to the other two techniques. Our results are in agreement with the previous study of Choi et al [44] who reported sensitivity 80.7% and specificity 66.7% of free hand elastography in differentiation between benign and malignant axillary lymph nodes. Also, no study studied the possibility of the presence of axillary lymph node micro-metastasis.
There were limitations to this study. First, only one type of equipment was used and the results might vary between different machines. Second, only core biopsy was obtained from some benign cases without excision biopsy, with the reported false negative of about 3%, our results may be affected slightly. Third, due to the fixed size of the ROI, very small lesions < 5mm couldn't be included in the study. Fourth, we did not consider the lesion size or the effect of site of measurement on the final results.
5. Conclusion
Both the SWE and SE elastography showed significant difference between the benign and malignant masses, and both has added value above B mode ultrasound during routine examination. Shear wave elastography had higher sensitivity and specificity than SE, and less false negative and false positive results. The quantitative SWE (SWV) had the highest diagnostic performance among the different studied techniques.
References
[1] Ibraheem AS, Khaled HM, Mikhail NNH, Kamel H. Cancer incidence in Egypt: results of the national population –based cancer registry program. Journal of cancer epidemiology. 2014: article ID 437971. 18 pages.
[2] Ferlay J, Shin HR, Bray F, Forman D, Mathers CD, Parkin D. Estimates of worldwide burden of cancer in 2008: GLOBOCAN 2008. Int J Cancer 2010; 127: 2893–2917.
[3] Checka CM, Chun JE, Schnabel FR, Lee J, Toth H. The relationship of mammographic density and age: implications for breast cancer screening. AJR Am J Roentgenol 2012; 198: W292–295.
[4] Athanasiou A, Tardivon A, Tanter M, Sigal-Zafrani B, Bercoff J, Deffieux T, et al. Breast lesions: quantitative elastography with supersonic shear imaging--preliminary results. Radiology 2010; 256: 297-303.
[5] Corsetti V, Ferrari A, Ghirardi M, Bergonzini R, Bellarosa S, Angelini O, et al. Role of ultrasonography in detecting mammographically occult breast carcinoma in women with dense breasts. Radiol Med 2006; 111: 440-8.
[6] Yi A, Cho N, Chang JM, Koo HR, La Yun B, Moon WK. Sonoelastography for 1, 786 nonpalpable breast masses: diagnostic value in the decision to biopsy. Eur Radiol 2012; 22 (5): 1033–1040.
[7] Sadigh G, Carlos RC, Neal CH, Dwamena BA. Ultrasonographic differentiation of malignant from benign breast lesions: a metaanalytic comparison of elasticity and BIRADS scoring. Breast Cancer Res Treat 2012; 133 (1): 23–35.
[8] Burnside ES, Hall TJ, Sommer AM, et al. Differentiating benign from malignant solid breast masses with US strain imaging. Radiology 2007; 245 (2): 401–410.
[9] Yoon JH, Kim MH, Kim EK, Moon HJ, Kwak JY, Kim MJ. Interobserver variability of ultrasound elastography: how it affects the diagnosis of breast lesions. AJR Am J Roentgenol 2011; 196 (3): 730–736.
[10] Nightingale KR, McAleavey SA, Trachey GE. Shear wave generation using acoustic radiation force: in vivo and ex vivo results. Ultrasound Med Biol 2003; 29: 1715–1723.
[11] Bercoff J, Tanter M, Muller M, Fink M. The role of viscosity in the impulse diffraction field of elastic waves induced by the acoustic radiation force. IEEE Trans Ultrason Ferroelectr Freq Control 2004; 51: 1523–1536.
[12] Balleyguier C, Ciolovan L, Ammari S, et al. Breast elastography: the technical process and its applications. Diagn Interv Imaging. 2013; 94 (5): 503-513.
[13] Bai M, Du L, Gu J, et al. Virtual Touch tissue quantification using acoustic radiation force impulse technology: initial clinical experience with solid breast masses. J Ultrasound Med. 2012; 31: (2): 289–294.
[14] Goddi A, Bonardi M, Alessi S. Breast elastography: a literature review. J Ultrasound. 2012; 15: (3): 192–198.
[16] Barr RG. Sonographic breast elastography: a primer. J Ultrasound Med 2012; 31 (5): 773–783.
[17] Ciurea AI, Bolboaca SD, Ciortea CA, BotarJid C, Dudea SM. The influence of technical factors on sonoelastographic assessment of solid breast nodules. Ultraschall Med 2011; 32 (Suppl 1): S27–S34.
[18] Itoh A, Ueno E, Tohno E, et al. Breast disease: clinical application of US elastography for diagnosis. Radiology2006; 239: 341–350.
[19] Cho N, Moon WK, Park JS. Real-time US elastography in the differentiation of suspicious microcalcifications on mammography. Eur Radiol 2009; 19: 1621–1628.
[20] Berg WA, Cosgrove DO, Doré CJ, et al. Shearwave elastography improves the specificity of breast US: the BE1 multinational study of 939 masses. Radiology 2012; 262: 435–449.
[21] Chang JM, Moon WK, Cho N, et al. Clinical application of shear wave elastography (SWE) in the diagnosis of benign and malignant breast diseases. Breast Cancer Res Treat 2011; 129: 89–97.
[22] Athanasiou A, Tardivon A, Tanter M, et al. Breast lesions: Quantitative elastography with supersonic shear imaging— preliminary results. Radiology 2010; 256: 297–303.
[23] D’Orsi CJ, Bassett LW, Berg WA, et al. BI-RADS: mammography, 4th ed. In: D’Orsi CJ, Mendelson EB, Ikeda DM, et al., eds. Breast Imaging Reporting and Data System: ACR BI-RADS—breast imaging atlas. Reston, VA: American College of Radiology, 2003.
[24] Kim YS, Park JG, Kim BS, Lee CH, Ryu DW. Diagnostic value of elastography using acoustic radiation force impulse imaging and strain ratio for breast tumors. J Breast Cancer. 2014 Mar; 17 (1): 76-82. March; 17 (1): 76-82.
[25] Itoh A, Ueno E, Tohno E, et al. Breast disease: clinical application of US elastography for diagnosis. Radiology 2006; 239: 341–350.
[26] Jayaraman J, Indiran V, Kannan K, et al. (June 01, 2017) Acoustic Radiation Force Impulse Imaging in Benign and Malignant Breast Lesions. Cureus 9 (6): e1301. DOI 10.7759/cureus. 1301.
[27] Tozaki M, Isobe S, Fukuma E: Preliminary study of ultrasonographic tissue quantification of the breast using the acoustic radiation force impulse (ARFI) technology. Eur J Radiol. 2011, 80: 182–187. 10.1016/j.ejrad.2011.05.020.
[28] Zhi H, Ou B, Xiao XY, Peng YL, Wang Y, Liu LS, et al. Ultrasound elastography of breast lesions in chinese women: a multicenter study in China. Clin Breast Cancer 2013; 13: 392-400.
[29] Gheonea IA, Stoica Z, Bondari S. Differential diagnosis of breast lesions using ultrasound elastography. Indian J Radiol Imaging 2011; 21: 301-5.
[30] Tozaki M, Isobe S, Sakamoto M. Combination of elastography and tissue quantification using the acoustic radiation force impulse (ARFI) technology for differential diagnosis of breast masses. Jpn J Radiol 2012; 30: 659-70.
[31] Meng W, Zhang G, Wu C, Wu G, Song Y, Lu Z. Preliminary results of acoustic radiation force impulse (ARFI) ultrasound imaging of breast lesions. Ultrasound Med Biol 2011; 37 (9): 1436—43.
[32] Barr RG. Real-time ultrasound elasticity of the breast: initial clinical results. Ultrasound Q 2010; 26 (2): 61–66.
[33] Barr RG, Destounis S, Lackey LB 2nd, Svensson WE, Balleyguier C, Smith C. Evaluation of breast lesions using sonographic elasticity imaging: a multicenter trial. J Ultrasound Med 2012; 31 (2): 281–287.
[34] Ueno E, Umemoto T, Bando H, Tohno E, Waki K, Matsumura T. New quantitative method in breast elastography: fat lesion ratio (FLR) [abstr]. In: Radiological Society of North America scientific assembly and annual meeting program. Oak Brook, Ill: Radiological Society of North America, 2007; 697.
[35] Destounis S, Arieno A, Morgan R, et al. Clinical experience with elasticity imaging n a community-based breast center. J Ultrasound Med 2013; 32 (2): 297–302.
[36] Raza S, Odulate A, Ong EM, Chikarmane S, Harston CW. Using real-time tissue elastography for breast lesion evaluation: our initial experience. J Ultrasound Med 2010; 29 (4): 551–563.
[37] Thomas A, Degenhardt F, Farrokh A, Wojcinski S, Slowinski T, Fischer T. Significant differentiation of focal breast lesions: calcuation of strain ratio in breast sonoelastography. Acad Radiol 2010; 17 (5): 558–563.
[38] Chang JM, Won JK, Lee KB, Park IA, Yi A, and Moon WK. Comparison of Shear-Wave and Strain Ultrasound Elastography in the Differentiation of Benign and Malignant Breast Lesions American Journal of Roentgenology 2013 201: 2, W347-W356.
[39] Evans A, Whelehan P, Thomson K, et al. Differentiating benign from malignant solid breast masses: value of shear wave elastography according to leion stiffness combined with greyscale ultrasound according to BI-RADS classification. Br J Cancer 2012; 107: 224–229.
[40] Cho N, Moon WK, Park JS, Cha JH, Jang M, Seong MH. Nonpalpable breast masses: evaluation by US elastography. Korean J Radiol 2008; 9: 111–118 41. Barr RG, Zhang Z. Effects of precompression on elasticity imaging of the breast: development of a clinically useful semiquantitative method of precompression assessment. J Ultrasound Med 2012; 31: 895– 902.
[41] Seo M, Ahn HS, Park SH, Lee JB, Choi BI, Sohn YM, Shin SY. Comparison and Combination of Strainand Shear Wave Elastography of Breast Masses for Differentiation of Benign and Malignant Lesions by Quantitative Assessment: Preliminary Study. J Ultrasound Med. 2018 Jan; 37 (1): 99-109.
[42] Fujioka T, Mori M, Kubota K, Kikuchi Y, Katsuta L, Kasahara M, Oda G, Ishiba T, Nakagawa T, Tateishi U. Simultaneous comparison between strain and shear wave elastography of breast masses for the differentiation of benign and malignant lesions by qualitative and quantitative assessments. Breast Cancer. 2019 Jun 7. doi: 10.1007/s12282-019-00985-0.
[43] Silva P, Uscategui RAR, Maronezi MC, Gasser B, Pavan L, Gatto IRH, de Almeida VT, et al. Ultrasonography for lymph nodes metastasis identification in bitches with mammary neoplasms. ScientIfic reports (2018) 8: 17708 | DOI: 10.1038/s41598-018-34806-9.