359 | P a g e
EFFECT OF HINGE LENGTH ON SENSITIVITY
OF PUSHOVER ANALYSIS
Sripad.D.B
1, Dr. Poornachandra Pandit
2Post Graduate student, Civil Engineering, M.I.T, Manipal University,Manipal. Karnataka, (India)
Assistant Professor, Civil Engineering, M.I.T,Manipal University, Manipal, Karnataka, (India)
ABSTRACT
Non-linear static pushover analysis is performed under permanent vertical loads and gradual increment in lateral
loads. In actual construction procedure, the strength of steel and concrete may vary. The results from the analysis
program are significantly sensitive to design parameters. Thus in this study, an attempt is made on a G+2 Reinforced
concrete (RC) structure to interpret the sensitivity of pushover analysis by varying the strength of steel, concrete and
hinge length on rigid diaphragm slab and comparing the results with experiment results.
Keywords: Sensitivity, Moment-Curvature, Lateral load, Rigid-diaphragm slab
I
INTRODUCTION
The intent of Pushover analysis is to assess the expected performance of by analysing its strength and deformation
requirements in theseismic design of structure by using Non-linear static analysis and evaluating these requirements to
accessible capacities at important performance levels. Non-linear static analysis has made a rapid advancement over the
past few decades and now has become amost adopted method for design and seismic performance evaluation as the
method is considerably simpler. In recent year, the precision and certainty of pushover analysis in seismic evaluation
has been a topic of consideration and progress of pushover method has been suggested to overcome the constraints of
the method.
Ashraf Habibullahet. al.,(1998) [1] suggested steps to carry out pushover analysis of a 3-Dimensional structure in
SAP-2000, which is fully integrated into the program, allows simple and clear application of the pushover procedures
recommended in the ATC-40 [6] and FEMA-273[8] documents for both two and three-dimensional buildings. Mehmet
Inel et. al.,(2002) [3] explored about push-over analysis approach for theperformance-based design of thebuilding are
progressively changed to account for nonlinear elastic-plastic behavior under consistent gravity loads and by agradual
increment of lateral loads.Cosenza, E. et. al., (1998) [4]explained thatDuctility of RC structure relies on thebehaviour
of the cracked element, which is well defined by themoment-curvature relationship. Analysis considering the
interpretation of a plastic hinge length is very useful. Plastic hinge length (Lp) has asignificant influence on the
displacement capacity of the structure.
Much improvisation is required, combined with experimentally obtained results and analysis stressed by S.Elnashai
(2001) [2]. But the experimental test results are rarely available to correlate with pushover analysis. In the present
study, the analytical results are being correlated with experiment results which were conducted in Structural
360 | P a g e
basis ofexperimentally obtained results of corresponding base shear and roof displacement, the frame structure ismodeled to inspect the sensitivity of pushover curve.
II
DETAILS
OF
STRUCTURE
A basic model is generated in SAP2000 program and as per the experimentally tested structure; material and
geometrical properties are assigned.The structure isa RC G+2 storeyed framed structure. The height of floor is 1.8m for
all storeys. It consists of two bays of 1.5m spacing in both directions.
2.1
Section Properties
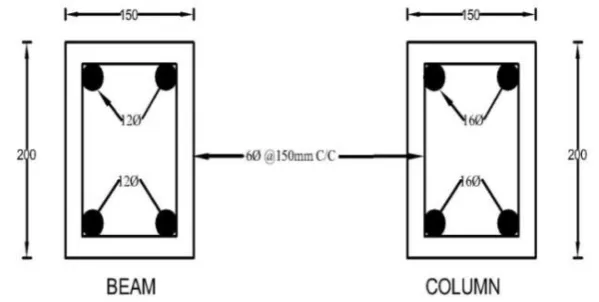
Both beam and column are 150mm× 200mm in size. The main reinforcement for beam was 2-12Φ bars at top and
bottom and 2-16Φ bars at top and bottom for the column. The stirrups provided were 2-legged 6Φ @ 150mm c/c. The
slab thickness is 50mm. The average concrete strength and average yield stress were found to be 35 Mpa and 478 Mpa
respectively.
Figure 1: Sectional Properties of Beam and Column
2.2
Modelling Details
Material and geometrical properties are assigned as per the experimental structure and a basic model is generated in
SAP2000. Different inbuilt default and user defined plastic hinge options are available in SAP2000 based on average
values from ATC-40 [6] and FEMA-273 [8] for concrete members and steel members respectively. As the user-defined
hinges reflect elemental nonlinearity behaviour, user-defined hinges are preferred over default hinge options.To use
user-defined hinge properties selection moment-curvature analysis of each element is required. Moment-curvature
values are generatedbased on amaterial model for concrete and steel. In the present study, IS recommended stress-strain
model for unconfined concrete and British code (CP-110-1972) for steel have been adopted as shown in figure 3 and
figure 4. The generated values of moment-curvature of beam and column are shown in table 1 and table 2. Moment
361 | P a g e
Figure 3: IS recommended stress-strain model Figure 4: British code recommendedfor unconfined concrete (CP 110-1972) stress-strain curve for steel
Table 1: Moment-curvature values for beams
Points
A B C D E
Origin Yielding Ultimate Strain
hardening
Strain
hardening
fy= 478N/mm2
fck=35 N/mm2
M=0
Փ=0
M=13.8
Փ=0.0126
M=14.04
Փ=0.0748
M=14.82
Փ=0.0801
M=16.9
Փ=0.0951
Table 2: Moment curvature values for columns
Points
A B C D E
Origin Yielding Ultimate Strain
hardening
Strain
hardening
fy= 478N/mm2
fck=35 N/mm2
M=0
Փ=0
M=23.0
Փ=0.0148
M=23.9
Փ=0.0915
M=24.92
Փ=0.098
M=27.79
Փ=0.1183
III LOAD PROFILE
After modeling the structure, pushover load cases are defined. Generally, after applying gravity load as the first
pushover load case, then following lateral pushover load is applied to start from the final state of gravity
loading.Structuresalong the height of the structure are subjected tolateral loads, which are based on the formula in Eq.
362 | P a g e
(1)
Where is lateral load applied at any floor level ―x‖, W is total building weight, h is the floor height, V is
lateralloadand N is the number of floors. is vertical distribution factor for the lateral load. Using the above
equation, the lateral loads were calculated. The lateral loads were applied in the ratio of 9:4:1on each floor as generated
by above equation and then applied to the model.
IV
EXPERIMENTAL
RESULTS
The experimental system used for performing the test is shown below which was carried out at SERC, Chennai
byAkanshu Sharma. The RC framed structure was propelled by taking reaction from the reaction wall with the help of
servo-hydraulic actuators. The load distribution was parabolic along the height.The experiment was conducted
governed by increasing monotonic pushover loads with the load distribution being parabolic along the height of the
structure. The maximum base shear and corresponding roof displacement were found to be 286.5kN and 0.110m
respectively.
4.1 Analysis
The preliminary analysis was carried out considering the actual material properties of the test results and the framewas
modeled as a rigid diaphragm slab was done in SAP2000.From the analysis, it was observed that for therigid diaphragm
slab, the corresponding Base shear (P) and Displacement (Δ) was found to be 276kN and 0.172mrespectively.Thus,
from the analysis results obtained, it is evident that the experiment results vary to analysis results and are sensitive and
susceptible to material and geometric modeling. Further investigation is carried out to check the possible variation in
the results obtained from pushover analysis by adopting rigid diaphragm slab model by calculating hinge length using
different hinge length properties available in the literature by considering user-defined hinges.Various different
formulations have been suggested for calculating the corresponding user defined plastic hinge lengths Lp. The length of
the user-defined hinge is considered from the following formulations,
1. Park's formula
Lp= 0.42h
2. Priestly-Park’s formula
Lp = 0.8z+6db
3. Panagiotakos-Fardis’s formula
Lp = 0.18z+0.021dbfy
4. Berry’s formula
Lp= 0.05z+
Where,
363 | P a g e
fy = yield stress of reinforcing bars, in N/mm2
z = Critical section distance from the point of contra-flexure, in mm
d = effective depth of the cross section, in mm
h = Overall depth of the cross section, in mm
fc = compressive strength of concrete, in N/mm2
The experimental results may vary from analytical results where there are chances of variation of the grade of concrete,
grade of steel and cover for the reinforcement. But, whereas in analysis, fy= 478 N/mm
2
and fck=35N/mm
2
are adopted.
To determine this uncertainty, further study was done by using the same geometric models and by taking into
consideration of uncertain properties such as grade of steel, grade of concrete and cover. Adopting lower and upper
limits as 15% low and 15% high in reference to the steel grade (fy= 478 N/mm2) and concrete grade (fck=35N/mm2) a
new set of moment-curvature values were generated in excel program and incorporated in the analysis. The
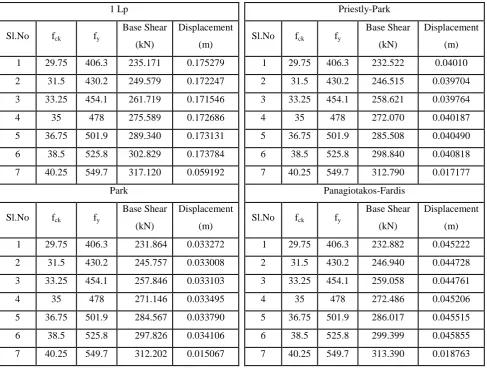
comparative graph of pushover curves for different hinge length is shown in figure 4. Table 3 shows results of rigid
diaphragm slab model with varying fck and fyby considering different hinge length properties.
Table 3: Base shear and displacement values for varying fy and fck with various hinge length formulations
1 Lp
Sl.No fck fy
Base Shear
(kN)
Displacement
(m)
1 29.75 406.3 235.171 0.175279
2 31.5 430.2 249.579 0.172247
3 33.25 454.1 261.719 0.171546
4 35 478 275.589 0.172686
5 36.75 501.9 289.340 0.173131
6 38.5 525.8 302.829 0.173784
7 40.25 549.7 317.120 0.059192
Park
Sl.No fck fy
Base Shear
(kN)
Displacement
(m)
1 29.75 406.3 231.864 0.033272
2 31.5 430.2 245.757 0.033008
3 33.25 454.1 257.846 0.033103
4 35 478 271.146 0.033495
5 36.75 501.9 284.567 0.033790
6 38.5 525.8 297.826 0.034106
7 40.25 549.7 312.202 0.015067
Priestly-Park
Sl.No fck fy
Base Shear
(kN)
Displacement
(m)
1 29.75 406.3 232.522 0.04010
2 31.5 430.2 246.515 0.039704
3 33.25 454.1 258.621 0.039764
4 35 478 272.070 0.040187
5 36.75 501.9 285.508 0.040490
6 38.5 525.8 298.840 0.040818
7 40.25 549.7 312.790 0.017177
Panagiotakos-Fardis
Sl.No fck fy
Base Shear
(kN)
Displacement
(m)
1 29.75 406.3 232.882 0.045222
2 31.5 430.2 246.940 0.044728
3 33.25 454.1 259.058 0.044761
4 35 478 272.486 0.045206
5 36.75 501.9 286.017 0.045515
6 38.5 525.8 299.399 0.045855
364 | P a g e
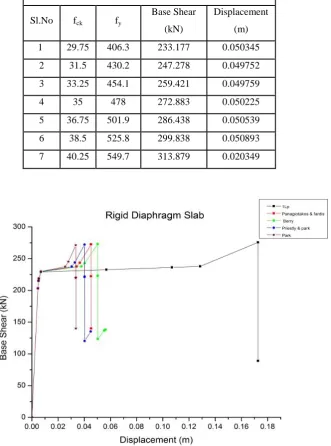
Figure 5: Comparison of Pushover curve for different hinge length (Rigid Diaphragm slab)V
CONCLUSION
From the analysis, it was found that in all models there was a variation of base shear and displacement results when
compared to experimental results. Thus, pushover analysis is sensitive to geometric modelling.
When compared with experimental values, for the reference grade of materials and cover, the base shear value was
3.89% lower and displacement was 60% higher.
Considering all hinge length formulations, the base shear values were virtually equivalent with experiment results
but the displacement was furthermore low. The variation shows that further improvement is necessary for pushover
analysis.
Berry
Sl.No fck fy
Base Shear
(kN)
Displacement
(m)
1 29.75 406.3 233.177 0.050345
2 31.5 430.2 247.278 0.049752
3 33.25 454.1 259.421 0.049759
4 35 478 272.883 0.050225
5 36.75 501.9 286.438 0.050539
6 38.5 525.8 299.838 0.050893
365 | P a g e
Beams and column joints were modelled by means of hinges at the concentrated ends to beam and column. Thenon-linear performance of joint core is necessary to find the complete performance of the frame analysed.
Further, frame with shell slab can be considered and compared with rigid diaphragm frame.
REFERENCES
[1]. Habibullah, A. and Pyle, S. ―Practical three-dimensional nonlinear static pushover Analysis‖, Structure Magazine
Berkley, CA. 1998.
[2]. Elnashai AS. ―Advanced inelastic static (pushover) analysis for earthquake applications‖.Aust J StructEngMech
2001;12(1):51–69.
[3]. Mehmet Inel, TjenTjhin and Mark A. Aschheim, ―The significance of lateral load pattern in pushover analysis‖.
Fifth national conference on earthquake engineering, turkey, paper no. AE-009; 2006
[4]. Cosenza, E., Greco, C., Manfredi, G. ―An equivalent steel index in the assessment of the ductility performances of
the reinforcement‖. Ductility-Reinforcement, Comitè Euro-International du Béton, Bulletin N°242: 157-170, 1998.
[5]. NeenaPanandikarHede and Dr.K.S.Babunarayan, ―Sensitivity of Pushover Curve to Material and Geometric
Modelling—An Analytical Investigation‖. Structures 2 (91-97), 2015.Elsevier Science Ltd.
[6]. ATC-40, ―Applied Technology Council, Seismic evaluation and retrofit of concrete Buildings‖. California, 1996.
[7]. FEMA-356, ―Federal Emergency Management Agency, Pre-standard and commentary for seismic rehabilitation of
buildings‖; 2000.
[8]. FEMA-273, ―Federal Emergency Management Agency, NEHRP guideline for Seismic rehabilitation of buildings
Washington (DC)‖; 1997.
[9]. CSI. SAP2000 V-14. ―Integrated finite element analysis and design of structures basic analysis reference manual‖.