https://doi.org/10.5194/amt-11-81-2018
© Author(s) 2018. This work is distributed under the Creative Commons Attribution 4.0 License.
Precipitable water vapour content from ESR/SKYNET sun–sky
radiometers: validation against GNSS/GPS and AERONET
over three different sites in Europe
Monica Campanelli1, Alessandra Mascitelli1,2, Paolo Sanò1, Henri Diémoz3, Victor Estellés4, Stefano Federico1, Anna Maria Iannarelli5, Francesca Fratarcangeli2, Augusto Mazzoni2, Eugenio Realini6, Mattia Crespi2, Olivier Bock7, Jose A. Martínez-Lozano4, and Stefano Dietrich1
1Institute of Atmospheric Sciences and Climate (ISAC), National Research Council (CNR), Via Fosso del Cavaliere 100, 00133 Rome, Italy
2Geodesy and Geomatics Division – DICEA, University of Rome “La Sapienza”, via Eudossiana 18, 00184 Rome, Italy 3Environmental Protection Agency (ARPA), Loc. Grande Charrière 44, 11020 Saint-Christophe, Aosta, Italy
4Dept. Física de la Terra i Termodinàmica, Universitat de València, Burjassot, Valencia, Spain 5SERCO SPA, Via Sciadonna 24, 00044 Frascati, Rome, Italy
6Geomatics Research and Developments (GReD) srl, via Cavour 2, 22074 Lomazzo, CO, Italy
7IGN LAREG, Univ. Paris Diderot, Sorbonne Paris Cité, 5 rue Thomas Mann, 75205 Paris CEDEX 13, France Correspondence:Monica Campanelli ([email protected])
Received: 30 June 2017 – Discussion started: 13 September 2017
Revised: 10 November 2017 – Accepted: 16 November 2017 – Published: 9 January 2018
Abstract. The estimation of the precipitable water vapour content (W) with high temporal and spatial resolution is of great interest to both meteorological and climatological stud-ies. Several methodologies based on remote sensing tech-niques have been recently developed in order to obtain ac-curate and frequent measurements of this atmospheric pa-rameter. Among them, the relative low cost and easy deploy-ment of sun–sky radiometers, or sun photometers, operating in several international networks, allowed the development of automatic estimations of W from these instruments with high temporal resolution. However, the great problem of this methodology is the estimation of the sun-photometric cali-bration parameters. The objective of this paper is to validate a new methodology based on the hypothesis that the cali-bration parameters characterizing the atmospheric transmit-tance at 940 nm are dependent on vertical profiles of tem-perature, air pressure and moisture typical of each measure-ment site. To obtain the calibration parameters some simul-taneously seasonal measurements of W, from independent sources, taken over a large range of solar zenith angle and covering a wide range ofW, are needed. In this work yearly GNSS/GPS datasets were used for obtaining a table of pho-tometric calibration constants and the methodology was
ap-plied and validated in three European ESR-SKYNET net-work sites, characterized by different atmospheric and cli-matic conditions: Rome, Valencia and Aosta. Results were validated against the GNSS/GPS and AErosol RObotic NET-work (AERONET) W estimations. In both the validations the agreement was very high, with a percentage RMSD of about 6, 13 and 8 % in the case of GPS intercomparison at Rome, Aosta and Valencia, respectively, and of 8 % in the case of AERONET comparison in Valencia.
Analysing the results byW classes, the present method-ology was found to clearly improve W estimation at low
W content when compared against AERONET in terms of % bias, bringing the agreement with the GPS (considered the reference one) from a % bias of 5.76 to 0.52.
1 Introduction
of the height to which that water substance would stand if completely condensed and collected in a vessel of the same unit cross section (American Meteorological Society, 2015). The estimation of this quantity is of great interest to meteo-rological and climatological studies. Near-real-timeW mea-surements can be used for weather diagnoses and forecast-ing applications (Poli et al., 2007; Hong et al., 2015) and for studying meteorological disturbances occurring in some ar-eas in order to improve the prediction of local heavy rainfall, a difficult task with current mesoscale numerical prediction models (Realini et al., 2014; Bock et al., 2016). Water vapour also plays a key role in the Earth’s climate system, lead-ing the hydrological cycle and affectlead-ing the global radiation budget as greenhouse gas (Schmidt et al., 2010). Also, mi-crophysical processes leading to the formation of clouds are influenced byW variations, whose effect on the size, shape and chemical composition of aerosols can modify their role in the direct and indirect radiative forcing (Yu et al., 2014; Haywood et al., 2011).
Therefore it is really important to perform measurements of W with high temporal and spatial resolution because of its high variability in both space and time across the Earth. Several methodologies have been recently developed in or-der to obtain accurate estimations: Global Navigation Satel-lite System (GNSS), including the Global Positioning Sys-tem (GPS) (Bevis et al., 1992; Guerova et al., 2016), mi-crowave radiometers (Elgered et al., 1982) and sun photome-ters (Campanelli et al., 2014; Halthore et al., 1997; Alexan-drov et al., 2004) are the automatic remote sensing instru-ments able to provide precise and frequent measureinstru-ments of W. All of them have some pros and cons. The GNSS methodology is based on the signal received from position-ing satellites by ground-based antennas; W calculated with this technique has a high temporal resolution (typically from 30 s to tens of minutes, depending on the processing strat-egy), and if the network of ground receivers is very dense then the spatial resolution is high as well. However, the net-works of receivers do not provide automatically the final product, that is W, and to get the highest accuracy out of the GPS measurements careful post-processing using avail-able scientific softwares must be performed (Bock and Doer-flinger, 2001). Microwave radiometers have a very high tem-poral resolution (up to 1 s) and good accuracy but, because of the cost of the instrument and maintenance needed, there are not many installed. Finally, the relatively low cost and easy deployment of sun photometers allowed the establish-ment of several international networks in the last 30 years worldwide. AErosol RObotic NETwork (AERONET) net-work (Holben et al., 1998; Smirnov et al., 2004), Global Atmospheric Watching Precision Filter Radiometer (GAW-PFR) network (Wehrli, 2000; Nyeki et al., 2005) and Euro-pean Skynet Radiometers (ESR-SKYNET) network (Cam-panelli et al., 2012, 2014) provide operationally free estima-tion ofW or develop algorithms and open-source packages for improving the retrieval of this important atmospheric
pa-Figure 1.Geographical position of ESR sites in the European re-gion (white dots) and of the stations used in this work (black stars).
rameter. However, the great problem of this methodology is the estimation of the sun-photometric calibration parameters. The objective of this paper is to validate a new method-ology, originally developed and applied at a single site in Japan (Campanelli et al., 2014), at three European ESR-SKYNET sites characterized by different atmospheric and climatic conditions. The methodology is based on the hy-pothesis that the calibration parameters characterizing the at-mospheric transmittance at 940 nm (the wavelength used by sun photometers for retrievingW) are dependent on vertical profiles of temperature, air pressure and moisture typical of each measurement site. To obtain calibration parameters, si-multaneous and season-dependent measurements ofW are needed, taken over a large range of solar zenith angle and covering a wide range ofW. In the present paper yearly GPS datasets are used to obtain a table of photometric calibra-tion constants for each site, covering a range ofWfrom 0 to 40 mm. Results are validated against a co-located AERONET sun photometer and a subset of GPS measurements.
2 Measurement sites and equipment
The methodology for the determination of precipitable water vapour content from sun–sky radiometers was ap-plied to measurements taken at three ESR sites (Fig. 1), Rome (Italy; 12.500◦E, 41.900◦N; 83 m a.s.l.), Burjassot-Valencia (Spain; 0.418◦W, 39.508◦N; 60 m a.s.l.) and Saint-Christophe, Aosta Valley (Italy; 7.357◦E, 45.742◦N; 570 m a.s.l.), during three different years, 2010, 2011 and 2014, respectively. The sites under study are different both in location and in atmospheric conditions.
Table 1.Characteristics of the sun–sky radiometers located at the three sites. The exact wavelengths of the CIMEL at Valencia can slightly change depending on particular instrument replacements.
Site Network Model Wavelengths View
angle
Rome ESR PREDE-POM01 340, 400, 500, 675, 870, 940, 1020 1.0◦
Aosta ESR PREDE-POM02 315, 340, 380, 400, 500, 675, 870, 940, 1020, 1600, 2200 1.0◦
Valencia ESR PREDE-POM01 315, 440, 500, 675, 870, 940, 1020 1.0◦
Valencia AERONET CIMEL-CE318 340, 380, 440, 500, 675, 870, 940, 1020, 1640 1.2◦
emission as well as by semi-rural particulates and, especially during summer season, by sea breeze and desert dust advec-tion from the Saharan region. The zenith angle for this site varies within the interval [18.46–65.31◦], and hours of sun-light recorded in 2010 were 2431.8 (provided by the Italian Air Force).
Burjassot is an urban site located in the metropolitan area of Valencia (Spain) with approximately 1.4 million inhabi-tants, 10 km west from the coast and 5 km northwest from the Valencia city centre. Therefore, it is mainly affected by urban pollution, but also by rural aerosols from non-irrigated inland areas and marine aerosols from the Mediterranean Sea (mainly under the sea breeze dynamics). Occasional events of mineral dust from the Sahara and biomass burn-ing from Mediterranean type forests happen mainly durburn-ing summer months. In general, its environment is relatively hu-mid, mainly when the site is under the effect of the sea air mass; however, during the Saharan air advections, or when the wind flows mainly from inland Iberian Peninsula, the en-vironment can be very hot and dry. The zenith angle for this site varies within the interval [16.07–62.91◦] and hours of sunlight recorded in 2011 were 2678.7.
Saint-Christophe is located in the Aosta Valley, 3 km far from the small city of Aosta (about 30 000 inhabitants). The location is in a semi-rural context, partially influenced by anthropogenic activity on both local (emissions from cars, heating systems, steel mill) and regional (advection from the Po Valley) scale. The prevalent wind circulation is forced by mountain–valley and mountain–plain breezes, and foehn episodes are not infrequent. The ground surface is cov-ered with soil, grass and buildings and during wintertime with snow. Zenith angle for this site varies within the inter-val [22.31–69.14◦] and hours of sunlight recorded in 2011 were 2396.
The different atmospheric conditions typical of each site, and therefore the seasonal variability ofW, make these loca-tions appropriate for a validation of the proposed technique. 2.1 Sun–sky radiometers
A sun–sky radiometer is a narrow band filter photometer able to perform measurements of direct solar and diffuse sky irra-diances at some selected wavelengths and at several scatter-ing angles.
The three ESR sites under study are equipped with the standard SKYNET network instrument, that is a sun– sky radiometer model POM-01 or POM-02, produced by PREDE Co., Ltd, Japan. Although mainly used for study-ing atmospheric aerosol optical and physical properties in clear sky conditions, these instruments also perform irradi-ance measurements at 940 nm for water vapour studies. The methodology used in this paper has been specifically devel-oped for estimating columnar water content from POM sun– sky radiometers (WP) but can also be applied to other spectral radiometers.
A CIMEL CE318 sun–sky radiometer, part of the AERONET network (often called simply sun photometer), has operated in Valencia since 2007 and co-located with the ESR-POM since 2008. This instrument, also aimed at char-acterizing atmospheric aerosols, performs the same kind of measurements as the POM model but has some technical dif-ferences that require a further calibration for the diffuse ra-diance, which is not needed in the POM model (Campanelli et al., 2007). Precipitable water vapour content from this in-strument (WAER) is calculated using the official AERONET inversion algorithm (Smirnov et al., 2004) and successive up-dates, also providing the aerosol products.
Table 1 shows the most important characteristics of both the POM and CIMEL sun–sky radiometers.
2.2 GNSS/GPS receivers
Three dual-frequency GNSS/GPS receiver stations (hereafter called simply GPS) were used for estimating the precipitable water vapour content, hereafter calledWGPS.
The M0SE system (12.493◦E, 41.893◦N; ellipsoidal height: 120.6 m; altitude: 72.14 m) is located on the roof of the Faculty of Engineering, University of Rome “La Sapienza”, about 2 km far from the sun–sky radiome-ter position. This system is part of the EUREF Permanent GNSS Network and the observational files, in Receiver IN-dependent EXchange (RINEX) format used for the retrieval ofWGPS, were provided by the Geodesy and Geomatics Di-vision, University of Rome “La Sapienza”.
observational files, for the calculation of WGPS, were pro-vided by the NetGEO network operators. For both the above stations dataset with time interval of 30 s was used to re-trieveWGPSwith a temporal resolution of 15 min.
The VALE system (0.3376◦W, 39.481◦N; ellipsoidal height: 77.7 m; altitude: 26.88 m) is located on the roof of the Escuela de Cartografia y Geodesia of Universidad Politec-nica de Valencia, Spain, about 7 km east from the sun–sky radiometer position. This system is part of the EUREF Per-manent GNSS Network, and RINEX data are available from the EUREF website (http://www.epncb.oma.be). For this sta-tionWGPSwas retrieved with time interval of 1 h.
3 Methodology 3.1 GPS receivers
Dry air and water vapour molecules in the troposphere affect GNSS signals by lowering their propagation velocities with respect to vacuum (Saastamoinen, 1973; Bevis et al., 1992). A diminished speed results in a time delay in the signal prop-agation along the satellite–receiver path, which multiplied by the vacuum speed of light, adds an extra distance to the satellite–receiver geometrical one. It is worth reminding here that the tropospheric delay (the word delay is usually referred to the extra distance and is expressed in metres) due to the dry air and water vapour molecules is just one out of many other systematic errors affecting GNSS observations that must be accounted for in order to achieve sub-centimetre accuracy positions. During GNSS data processing, the contribution of dry air and water vapour to the total delay is separated and estimated in the zenith direction. This leads to the def-inition of three delay parameters: ZTD (zenith total delay), ZHD (zenith hydrostatic delay) and ZWD (zenith wet delay), related by the equation ZTD=ZHD+ZWD (Bevis et al., 1992). If from the positioning point of view this delay were just a systematic error to be removed, it suggests GNSS as a tool for the remote sensing of the troposphere water vapour content. For many years, the meteorological community has considered this by-product of high-accuracy positioning as one of the available observations, and time series of GNSS tropospheric water vapour delays are currently assimilated by some number of numerical weather prediction models, in some cases in a routine way (Bennitt and Jupp, 2012; Gerova et al., 2016). The methodology to retrieve columnar water vapour content consists in the following steps:
1. The satellite-related parameters (ephemeris orbits and satellite clocks) provided by the Centre for Orbit De-termination in Europe (CODE) are used as input in the Bernese GNSS Software 5.0 for station VALE and 5.2 for stations M0SE and AOST (http://www. bernese.unibe.ch/docs/DOCU52.pdf) in order to esti-mate the values of the ZTD from the satellite–receiver range observations of a selected receiver. The Bernese
software, developed at the Astronomical Institute of the University of Bern (AIUB), is a scientific package meet-ing highest-quality standards for geodetic and further GNSS applications. In this work, only the GPS signals were processed.
Concerning the M0SE receiver, a part of the EU-REF Permanent GNSS Network, the coordinates pro-vided by CODE in the Solution INdependent EX-change (SINEX) format files are known and the Pre-cise Point Positioning (PPP) absolute positioning and coordinates’ constrained methodology were used in the Bernese analysis. Regarding the AOST receiver, the SINEX files are not available and the PPP and free network solution methodology was used, allow-ing the Bernese GNSS Software to estimate the station coordinates. Station VALE was processed in double-difference mode within a global network as a loosely constrained solution (10 m). The ZTD estimates were quality checked based on inspection of ZTD time series and formal errors following the methodology described in Bock et al. (2016).
2. From the values of ZTD, WGPS can be calculated us-ing pressure and temperature predicted by a numeri-cal weather prediction model or measured at the sur-face by weather stations located nearby the GNSS sta-tion. These datasets, were provided by the Agenzia Re-gionale per la Protezione Ambientale (ARPA) Lazio for M0SE station and by Regione Valle d’Aosta for AOST receiver. For station VALE, the surface pres-sure values from ECMWF reanalysis (ERA-Interim) were used. The height difference between receivers and weather stations has been corrected according to Realini et al. (2014). Latitude and altitude of receivers, read in the RINEX files, are also used to convert ZTD to pre-cipitable water content WGPS using the procedure by Bevis et al. (1992). This technique allows calculating the ZHD and the ZWD. Finally, according to Askne and Nordius (1987), Eq. (1) returns the amount of IWV (in-tegrated water vapour):
IWV=K(Tm)·ZWD, (1)
where the coefficientK depends on the vertically in-tegrated mean temperature (Tm) (Davis et al., 1985) and can be obtained either from meteorological mod-els or by the linear relationships proposed by Bevis et al. (1992): Tm∼70.2+0.72 Ts, where Ts is the mea-sured temperature. In the analysis of Aosta GPS data, the Bevis equation was used, whereas ECMWF data were used for VALE. Consequently, the values ofW
that results are dependent on the IWV itself, and thus on the geographic location (cold–warm climates) and on time (cold–warm or dry–wet season), but also on GPS processing options and of course on the quality of measurements from the reference sensor. Recent mea-surement campaigns performed at mid-latitudes have demonstrated root mean square differences<0.1 cm or 4–7 % (Bock et al., 2013; Bonafoni et al., 2013; Pérez-Ramírez et al., 2014), which can be considered as rep-resentative for this study.
3.2 Sun–sky radiometers 3.2.1 ESR/PREDE-POM
Precipitable water vapour content from ESR/PREDE-POM sun–sky radiometer (WP) was calculated using the methodol-ogy described in Campanelli et al. (2014). For specific spec-tral regions in the near infrared, where absorption of dom-inant trace gases can be considered negligible, we can ex-press the transmittance of the atmosphere (Tatm) as follows:
Tatm=e−m0(τR+τa)·T, wherem0 is the relative optical air-mass (Kasten and Young, 1989), τa and τR are the extinc-tion aerosol optical depth and the molecular Rayleigh scatter-ing at 940 nm respectively, andT is the transmittance of the water vapour (T=e−a(mW )b, wheremis the water vapour optical airmass, calculated according to Kasten (1966), and
W the columnar water vapour content; Bruegge et al., 1992). The main aspect of this technique is the consideration that the atmospheric transmittance in the water vapour band depends on the vertical profile of temperature, pressure and moisture of each site of measurement, as much as its characteristic pa-rametersaandb, whose values depend on the characteristics of the interferential filter but also vary with the columnar wa-ter vapour amount. This procedure allows the estimation of
aandbparameters directly from the measurements taken by the sun–sky radiometer, potentially containing the informa-tion on seasonal changes in vertical profiles of temperature, air pressure and moisture occurring in the site of measure-ment and not relying on any radiative transfer calculation, therefore reducing simulation errors.
The direct solar irradianceF (mA) measured by the POM sun–sky radiometer at the 940 nm wavelength in clear sky conditions can be expressed by Eq. (2):
V =V0e−m0(τa+τR)e−a(mW )
b
, (2)
where V0 is the solar calibration constant, i.e. the extra-terrestrial solar irradiance in current units (mA).
The procedure for the retrieval ofa,bandV0, completely described in Campanelli et al. (2014), is here briefly summa-rized.
Equation (2) can be also written in the form
y=lnV0−ax, (3)
with
y=lnV +m·(τa+τR)
x=(m·W )b . (4)
τa is estimated at wavelengthλ=940 nm, according to the well-known Ångström formula in Eq. (5):
τa(λ)=βλ−α, (5)
whereαis the Ångström exponent andβ is the atmospheric turbidity parameter.αandβare determined by the regression from Eq. (5), where the spectral series ofτaare retrieved by the sun–sky radiometer measurements taken at the other vis-ible and near-infrared wavelengths 400, 500, 675, 870 and 1020 nm.
From Eq. (4)x values are calculated for several different values ofband each time the (x,y) squared correlation co-efficient is calculated; then the maximization of the (x, y) squared correlation coefficient is used to determine the best exponentb. Once the optimalb is retrieved, the series ofx
values is computed and used in Eq. (3), where the regression line ofyvs.xallows the retrieval of the coefficientsaandV0. The errors affectinga,bandV0retrievals are evaluated us-ing a Monte Carlo method as explained in Campanelli et al. (2014).
This regression line is a modified version of a Langley plot whereV0is retrieved by plottingy vs. the productax, with
x=(m·W )b. This approach, as demonstrated in Campanelli et al. (2014), extends the application of the Langley methods to cases where the time patterns ofW is not stable.
Once parametersV0,a andb have been determined, the values of precipitable water contentWPcan be calculated ac-cording to the Eq. (6):
WP= 1
m· 1
a ·(lnV0−y) 1b
. (6)
In order to calculate x values in Eq. (4), an independent dataset of columnar water vapourW, measured by other in-strumentation (such as radiosondes, microwave radiometers or GPS receivers) taken over a large range of solar zenith an-gle simultaneously with the sun–sky radiometer irradiance measurements, is needed. If seasonal dependent measure-ments ofW are available, it is possible to calculate a table of calibration constants (a,b) as a function of the amount of columnar water vapour typical of the site under considera-tion. This table can be used for the calculation ofWP until the instrument is moved to another location or its status is deteriorated.
3.2.2 AERONET/CIMEL
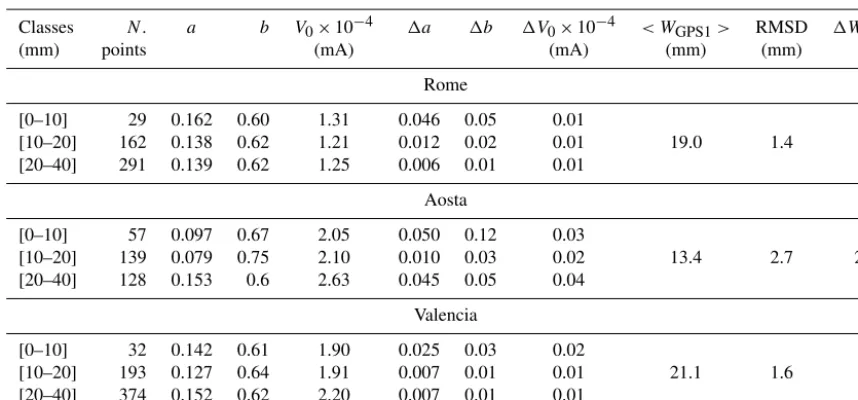
Table 2.For each class and each site are listed the number of data points, the optimal values of calibration constants, their estimated errors, the mean value ofWand the estimated uncertainty ofWP.
Classes N. a b V0×10−4 1a 1b 1V0×10−4 < WGPS1> RMSD 1WP
(mm) points (mA) (mA) (mm) (mm) %
Rome
[0–10] 29 0.162 0.60 1.31 0.046 0.05 0.01
[10–20] 162 0.138 0.62 1.21 0.012 0.02 0.01 19.0 1.4 7
[20–40] 291 0.139 0.62 1.25 0.006 0.01 0.01
Aosta
[0–10] 57 0.097 0.67 2.05 0.050 0.12 0.03
[10–20] 139 0.079 0.75 2.10 0.010 0.03 0.02 13.4 2.7 20
[20–40] 128 0.153 0.6 2.63 0.045 0.05 0.04
Valencia
[0–10] 32 0.142 0.61 1.90 0.025 0.03 0.02
[10–20] 193 0.127 0.64 1.91 0.007 0.01 0.01 21.1 1.6 8
[20–40] 374 0.152 0.62 2.20 0.007 0.01 0.01
from the HITRAN 2000 spectral database (Rothman et al., 2003) using the Spherical Harmonics (SHARM) radiative transfer code (Lyapustin, 2005); then the coefficientsaandb
are computed by a curve-fitting procedure ofT as a function ofW. The output of the HITRAN 2000 spectral database is convolved with recently measured filter response functions (Smirnov et al., 2004). Each AERONET instrument has its own unique set ofaandbvalues depending on the filter con-figuration, and these coefficients are considered fixed until the filter is changed. Since only one pair ofa andb param-eters is used, the dependence ofT on the vertical profile of temperature, pressure and moisture that can seasonally hap-pen at each site is neglected, introducing uncertainties in their retrieval. The use of a different database for the determi-nation of water vapour transmittance could also affect their value.
Once the coefficients a and b are known, the calibra-tion constant V0 is calculated by another modified Lang-ley method, from observations taken at a high mountain site (Reagan et al., 1986; Bruegge et al., 1992; Halthore et al., 1997). This modified method, different from the one used in the ESR/PREDE-POM procedure, determinesV0 as the in-tercept of the straight line obtained by fittingyvs. the power termmbin Eqs. (3) and (4). In this case, as demonstrated in Campanelli et al. (2014), the stability of theWtime pattern is required in order to avoid calibration errors. Finally using the retrieved calibration parametersa,bandV0the precipitable water vapour content,WAER, can be calculated from Eq. (6).
4 Estimation of calibration constants
WGPS obtained by the three GPS receivers in Rome, Aosta and Valencia was used as an independent dataset for
calculat-ing the calibration constants of the co-located ESR/PREDE-POM sun–sky radiometers. The cloud screening of radiome-ters measurements was performed by selecting those mea-surements whose root mean square deviation (RMSD) be-tween measured and reconstructed diffuse sky irradiance at all the wavelengths, used for aerosol study, and all angles is lower than 20 %. For the Rome site, an additional proce-dure was applied consisting in intercomparing the selected measurements with those provided by a co-located Multi-Filter Rotating Shadowband Radiometer (MFRSR), whose cloud screening is performed following the methodology by Alexandrov et al. (2004). In order to limit the influence of largest uncertainties at very high solar zenith angles, we se-lected the data withm <8.
The closestWGPS retrievals within 30 min, 15 min before and after the sun–sky radiometer measurements, were se-lected. Then the simultaneous [WGPS,V] dataset was divided in two parts by picking every other day among the available days: one part [WGPS1,V1] was used for the application of the methodology and then the estimation of the calibration con-stants, while the other part of GPS estimations (WGPS2) was used to validate theWPretrievals. The two GPS datasets were found to be equally populated and with similar frequency distributions, and the statistical independence between the
WGPS2data used for the validation andWPwas ensured. Becauseaandbparameters are supposed to depend on the total amount of water vapour, the entire yearly independent
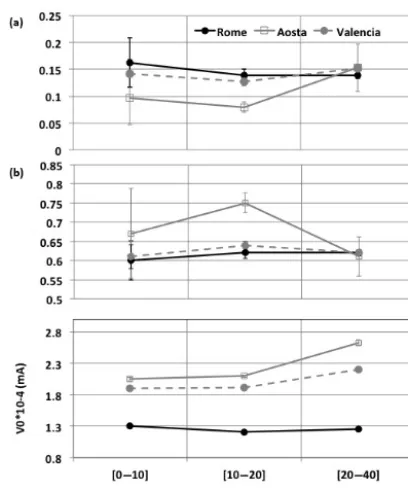
Figure 2. Behaviour of the estimated calibration parameters vs.W classes. The errors bars are the errors affecting the param-eters as evaluated using a Monte Carlo method.
In the first application of this methodology (Campanelli et al., 2014), performed to calibrate a sun–sky radiometer at a Japanese site characterized by a wide yearly range of W
(from a few millimetres up to about 60 mm), nearly parabolic opposite behaviours of a and b as a function of W were found. The similar behaviour of the boundaryWclasses (be-ing two maxima of the distribution) was demonstrated to be linked to two different atmospheric regimes, with simi-larW vertical distribution: trapping ofW due to winter in-version and occurrence of convection in summer. Both these regimes have a vertical structure with a well-mixed layer at the bottom and a rapid decrease upward. This behaviour is recognizable in Aosta for the higher W class. In this sea-son, in fact, the well-mixed layer at the bottom is likely due to humid polluted air masses transported from the Po Valley region, starting from late afternoon and staying in the atmo-sphere up to the morning. This advection was observed by the ceilometer, which measured the increase of suspended parti-cles in the atmosphere, and by hygrometers for the growth of absolute humidity (Díemoz et al., 2016). Unfortunately there are no vertical profile measurements ofW at this site to ver-ify this statement. Conversely in Rome and Valencia all the classes seem characterized by similar synoptic situations.
Looking at Fig. 2, a slight fictitious tendency ofV0on the water vapour class is recognizable. It should be noted that the retrievedV0in this methodology should be considered as an effective calibration constant whose variation could not be related to a real instrumental drift. Nevertheless, its total
un-certainty (estimated as the standard deviation of the assumed values in each class divided by their average) resulted to be about 4, 8 and 14 % for Rome, Valencia and Aosta, respec-tively.
The uncertainty affecting the retrieval ofWP(1WP%) was estimated (as in Eq. 7) by calculating the percentage RMSD betweenWPand theWGPS1dataset, used for calibrating the sun–sky radiometer:
RMSD= q
< (WP−WGPS1)2>
1WP%=
RMSD
< WGPS1>
·100. (7)
One must bear in mind that this uncertainty is a statistical measure but not the total uncertainty ofW retrieval which should include instrumental uncertainties, errors introduced at different steps of the method and their spread, and any other systematic errors.
The estimated uncertainties (Table 2) values are compara-ble with that of AERONET retrievals (Pérez-Ramírez et al., 2014), i.e. approximately 10 %, with the exception of Aosta, where a value of 20 %, with a RMSD of 2.7 mm, is obtained. This is due mainly to two reasons: one is that the denomi-nator< WGPS1>in Eq. (7) is smaller for Aosta than for the other two sites, resulting in higher1WP% value; the other is related to the performance of GPS measurements in sites with rough orography. In fact, the methodology used for the calculation of ZTD assumes an azimuthal isotropy of the at-mosphere above the antenna, within a conical field of view with an angular aperture of about 170◦(since the elevation angle cut-off was set to 5◦) centred in the site where the an-tenna is located. However, the orography can make the distri-bution of fluxes at high levels quite complex and not uniform; the rougher the orography, as that surrounding the Aosta site, the greater is the atmospheric anisotropy and therefore, in principle, the error introduced by the failure of the hypoth-esis assumed by GPS methodology. This degradation of the quality of GPS retrieval, not quantifiable, together with the missing of a large amount of GPS data in Aosta during the summer months, makes the fitting procedures used for the retrieval of calibration constants less stable and therefore in-creased the uncertainty in their estimation.
5 Intercomparison of methodologies
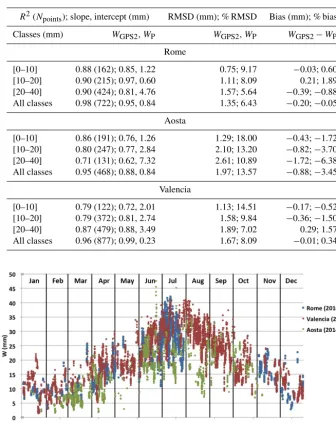
Table 3.Parameters of the statistical analysis in the comparison against sun photometer and GPS water vapour estimations: squared correla-tion coefficient, slope and intercept of the fitting lines, RMSD and bias.
R2(Npoints); slope, intercept (mm) RMSD (mm); % RMSD Bias (mm); % bias
Classes (mm) WGPS2,WP WGPS2,WP WGPS2−WP
Rome
[0–10] 0.88 (162); 0.85, 1.22 0.75; 9.17 −0.03; 0.60 [10–20] 0.90 (215); 0.97, 0.60 1.11; 8.09 0.21; 1.89
[20–40] 0.90 (424); 0.81, 4.76 1.57; 5.64 −0.39;−0.88 All classes 0.98 (722); 0.95, 0.84 1.35; 6.43 −0.20;−0.05
Aosta
[0–10] 0.86 (191); 0.76, 1.26 1.29; 18.00 −0.43;−1.72 [10–20] 0.80 (247); 0.77, 2.84 2.10; 13.20 −0.82;−3.70
[20–40] 0.71 (131); 0.62, 7.32 2.61; 10.89 −1.72;−6.38 All classes 0.95 (468); 0.88, 0.84 1.97; 13.57 −0.88;−3.45
Valencia
[0–10] 0.79 (122); 0.72, 2.01 1.13; 14.51 −0.17;−0.52
[10–20] 0.79 (372); 0.81, 2.74 1.58; 9.84 −0.36;−1.50 [20–40] 0.87 (479); 0.88, 3.49 1.89; 7.02 0.29; 1.57
All classes 0.96 (877); 0.99, 0.23 1.67; 8.09 −0.01; 0.34
Figure 3. Temporal behaviours of WP retrieved with the presented methodology for the years 2010 (Rome), 2011 (Valencia) and 2014 (Aosta).
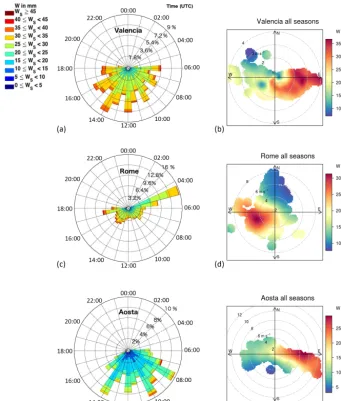
angle histograms of the hourly distribution of W values, grouped according to their numeric range, were performed in order to highlight the main differences among the three sites. Looking at Fig. 4a (summertime), it is worth highlighting that Valencia is the site where highW values (>30 mm) are more homogenously distributed over time, with a very slight increment in the afternoon due to breeze circulation. This is principally due to the location of this site, very close to the sea, from where humid air masses are transported all over the day. This kind of distribution of greater water vapour content is also visible in the other seasons, showing a sort of homo-geneity ofW distribution throughout the year. In Fig. 4b a
bivariate polar plot with smoothing, obtained from openair package, is shown. W content, for the entire year, in po-lar coordinates is shown by wind speed (radius of the cir-cles) and direction. Mean contents are calculated for wind speed–direction “bins” (0–1, 1–2 m s−1, etc. and 0–10, 10– 20◦, etc.). It is evident from this plot that the largest amount ofW is brought by easterly winds from the seacoast 10 km east from the site.
Figure 4. (a, c, e)Polar plot showing the distribution ofWvalues, during summer season, grouped according to their numeric range; the 24 quadrants are hours in UTC; the radius represents the frequency of events normalized to the number of point of the season. The frequency scales are different for the three histograms.(b, d, f)Bivariate polar plot with smoothing, showing the distribution ofW content, for the entire year, by wind speed (radius of the circles) and direction.
is from the sea) in transportingWto the site is highlighted in Fig. 4d, whereas lowerW content is mostly recorded when wind comes from the north, having also the highest speed. In all seasons greater water vapour content is retrieved in the early morning and late afternoon showing, also for this site, a generally homogeneous W yearly distribution. A smaller number of measurements is available in Rome during the middle part of the day in all seasons. This is mostly due to the formation of convective clouds at around 12:00 UTC, favoured by the urban heat island phenomenon, that did not allow the photometer to operate.
In Aosta, as shown in Fig. 4f, the greater amount of W
comes from the east, that is from the Po Valley, a humid region with higher atmospheric stability and weaker winds, and mostly during summer and autumn seasons; elevated
val-ues of W (>35 mm) during summer were retrieved more frequently in the morning, but this hourly distribution was found also in autumn for W >25 mm (Fig. 4e). This be-haviour could be caused by the atmospheric stability; in the late morning, especially in summer and autumn when the insolation is higher, valley–mountain flows develop, mixing the humid air of the lower levels with the dried air above. Then, winds aloft could remove part of this humidity by ad-vection, decreasing the water content of the air column. The other seasons conversely show more homogeneousW distri-bution during the day. LowW content associated with winds fromWis due to the foehn. When wind comes from this side, air masses passed the Alps and arrived drier over Aosta.
com-Figure 5.Scatter plot ofWGPS2vs.WP. Alternations of black and greys indicate the three water vapour classes.
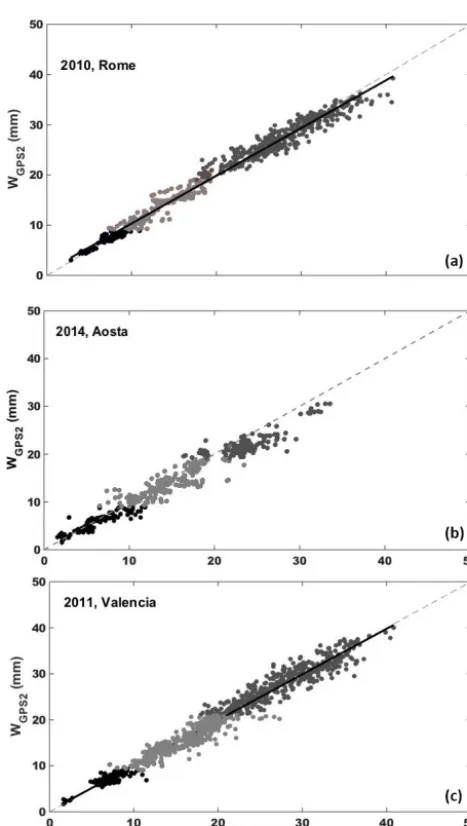
pare measurements within 1 min of difference (if more than one measurement of WGPS2 was found, their average was performed). RMSD and bias, defined in Eq. (8), as well as squared correlation coefficientR2, slope and intercept of the fitting straight line, were used for the statistical analysis, whose results are shown in Table 3 and Fig. 5.
RMSD= q
< (WGPS2−WP)2>%RMSD=
p
< (WGPS2−WP)2>
< WP
>·100
Bias=< (WGPS2−WP) > %Bias=<
W
GPS2−WP WP
·100
> (8) The comparison betweenWP andWGPS2for Rome and Va-lencia (Table 3) when all W classes are analysed shows highR2, varying from 0.98 and 0.96; RMSD assumes val-ues from 1.35 mm (6.43 %) and 1.67 mm (8.09 %), and the bias is within−0.01 mm (0.34 %) and−0.20 mm (−0.05 %),
Figure 6.Scatter plot ofWAERvs.WPfor Valencia site; alterna-tions of black and greys indicate the three water vapour classes.
which is within the estimated error1WP. Investigating sep-arately the three classes (divided using the thresholds on the
WGPS2 dataset), the greatest difference was found for the first class in terms of % RMSD (9.17–14.51 %) but for the same class it was the smallest in terms of absolute RMSD (0.75–1.13 mm); conversely for the same class the small-est difference was found in terms of bias, both in percent-age and absolute values, varying from−0.03 mm (0.60 %) to −0.17 mm (−0.52 %). However, each class remained within the1WPerror.
The retrieval of WP for Aosta was generally less per-forming than for the other sites. For the entireW classes, RMSD and bias were found to be the highest values, 13.57 % (1.97 mm) and−3.45 % (−0.88 mm) respectively, while R2 is the lowest among the three sites (0.95). Also for this site the greatest % RMSD (18.00 %) and the small-est RMSD (1.29 mm) were found for the first class and the bias (both percentage and absolute values) remained for each class within the1WP error. The lower-quality performance of the methodology in this site is discussed in Sect. 4.
Co-located with the ESR-SKYNET/POM by the Univer-sity of Valencia, there was an AERONET/CIMEL simulta-neously operating in 2011. Since the philosophy used by the two networks for the radiometer’s calibration is substantially different, it is worthwhile to compare the columnar precip-itable water content estimated by the two methodologies and verify whether there are some improvements in assuming the calibration parameters dependent on the vertical distribution ofW, and then on its total amount, with respect to the com-monly used assumption of fixed values.
Figure 7. Percentage relative differences between WAER and
WP(a),WAERandWGPS(b), andWGPSandWP(c)for Valencia site.
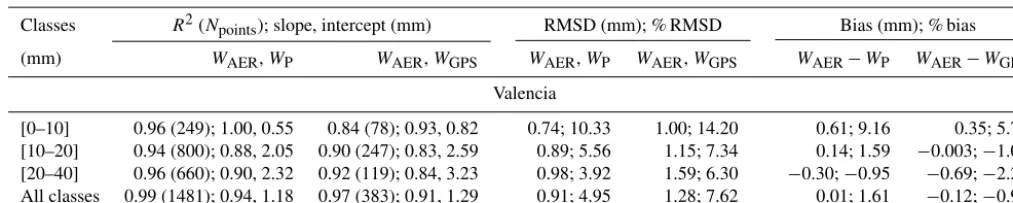
% bias (9.16 %) within the combined uncertainty of bothWP andWAER, with an overestimation of AERONET retrieval.
WAERwas then compared againstWGPS, showing a % bias of −0.97 % and % RMSD of 7.62 % if all the classes are considered. The negative bias, consisting in an underesti-mation of AERONET retrieval, was also documented by Pérez-Ramírez et al. (2014), who found values varying from 2.2 to 7.9 % depending on the site under study when com-paring estimations from AERONET vs. GPS. However, the agreement against GPS was not so good for the first class of WAER, where a higher positive discrepancy was found (% bias of 5.76) with respect to the one shown in the
com-parison betweenWP andWGPS (0.52 %) in the same class. Looking at Fig. 7, in fact, it is clear that the difference between WAER and WP has a decreasing trend with in-creasingW (Fig. 7a) being greater than 10 % (threshold of AERONET uncertainty) mostly for values below 15 mm, which is about the first class of W. A similar trend (even if less marked) is visible betweenWAERandWGPS(Fig. 7b). Conversely there is no clear tendency in the difference be-tweenWPandWGPS(Fig. 7c). This confirms that the method-ology here proposed takes to a general improvement ofW es-timation, particularly evident for lowW content, in agree-ment with the findings in Campanelli et al. (2014), where the assumption of variable ofaandbparameters increased the agreement with GPS retrievals of about 10 % for the firstW class respect to the commonly assumption of fixeda
andb.
6 Conclusions
A methodology for retrieving precipitable water contentWP from sun–sky radiometers measurements at 940 nm was ap-plied to three sites of the ESR-SKYNET network with dif-ferent atmospheric and climatic conditions. In order to pro-videWP, the sun–sky radiometer must be calibrated in terms of the solar calibration constantV0, that is the solar radia-tion incident at the top of the atmosphere and the calibraradia-tion parameters characterizing the atmospheric transmittance at this wavelength,a andb. This methodology considers that
aandbare dependent on vertical profiles of temperature, air pressure and moisture typical of each measurement site, and therefore allows for the calculation of pairs of (a,b) values for several classes ofW. To obtain the calibration parameters, GPS-based yearly independent estimations ofW, simultane-ously with the sun–sky radiometer measurements, were used and a table of calibration constants, covering a range ofW
from 0 to 40 mm, was built for each site. In this work the GPS dataset was divided in two parts by picking every other day from the available days: one part was used for the cali-bration of the sun–sky radiometer and the other part for the validation.
In principle 1 entire year ofWindependent measurements are required for building the calibration table, but a smaller dataset can also be used, provided that it is taken over a large range of solar zenith angle and it covers a wide range ofW.
differ-Table 4.Parameters of the statistical analysis in the comparison againstWAERofWP andWGPSestimations for Valencia site: squared correlation coefficient, slope and intercept of the fitting lines, RMSD and bias.
Classes R2(Npoints); slope, intercept (mm) RMSD (mm); % RMSD Bias (mm); % bias
(mm) WAER,WP WAER,WGPS WAER,WP WAER,WGPS WAER−WP WAER−WGPS
Valencia
[0–10] 0.96 (249); 1.00, 0.55 0.84 (78); 0.93, 0.82 0.74; 10.33 1.00; 14.20 0.61; 9.16 0.35; 5.76 [10–20] 0.94 (800); 0.88, 2.05 0.90 (247); 0.83, 2.59 0.89; 5.56 1.15; 7.34 0.14; 1.59 −0.003;−1.02
[20–40] 0.96 (660); 0.90, 2.32 0.92 (119); 0.84, 3.23 0.98; 3.92 1.59; 6.30 −0.30;−0.95 −0.69;−2.28 All classes 0.99 (1481); 0.94, 1.18 0.97 (383); 0.91, 1.29 0.91; 4.95 1.28; 7.62 0.01; 1.61 −0.12;−0.97
ence was found for the first class in terms of % RMSD: 9.18, 14.51 and 18 %, for Rome, Valencia and Aosta respectively.
When compared against the AERONET retrieval, the agreement was found to be very good and within the uncer-tainties of both methodologies when all the classes together are considered. However, analysing the results by classes, and after a cross-check amongWP, GPS and AERONET es-timates, it was highlighted that the present methodology is able to generally improveW estimation, particularly for low
Wcontent in term of % bias, bringing the agreement with the GPS (considered the reference) from a % bias of 5.76 to 0.52. This finding is in agreement with what was already demon-strated by Campanelli et al. (2014), in which the assumption of variable ofaandbparameters was compared with the re-sults from the assumption of fixedaandb.
The present methodology can be easily applied to other kind of sun photometers or radiometers measuring the solar direct radiation at 940 nm wavelength, as PFR or MFRSR, provided that Ångström, exponent and aerosol optical depth at 940 nm are available. The calibration table containing
a andbvalues for eachW class can be used until the instru-ment is moved to another location or is submitted to mainte-nance. In these cases all the calibration parameters must be recalculated.
The problem in the application of this methodology is, however, the availability of an independent, simultaneous
W dataset to be used for calibrating the sun–sky radiome-ter or any other similar sun photomeradiome-ter. In Campanelli et al. (2014) the possibility of using a rough estimation of the needed W dataset was tested, using surface observations of moisture parameters that are much more common than
W values estimated by other equipment. The test provided very interesting results but still needs to be improved and val-idated in different sites and climatic conditions, which will be the next task for this kind of research. Finally, a sensitivity study about the time frequency of the independent external measurements (both daily and monthly but also inside a sin-gle day) will be a future prospect of this research in order to build guidelines for the operational use of the methodology and delivering a software.
Data availability. AERONET W data are freely downloadable from the AERONET web page: https://aeronet.gsfc.nasa.gov. SKYNET raw data must be requested from the owners of each site, whose contact information can be found at the ESR web page: http://www.euroskyrad.net/sites.html; the cal-culated W content can be downloaded from the same web page, after requesting a password from Monica Campanelli ([email protected]) or Victor Estellés ([email protected]). Re-garding GNSS raw data for the two stations M0SE and VALE, they are freely downloadable from the EUREF EPN websites M0SE (http://www.epncb.oma.be/_networkdata/siteinfo4onestation.php? station=M0SE00ITA) and VALE (http://www.epncb.oma.be/ _networkdata/siteinfo4onestation.php?station=VALE00ESP). As for AOST, 30 s raw data are downloadable freely after registering at the NETGEO portal: http://www.netgeo.it/ (only in Italian) or by sending a request to NETGEO network operators. As for the IWV results, they can be requested from Eugenio Realini ([email protected]) or Alessandra Mascitelli ([email protected])
Competing interests. The authors declare that they have no conflict of interest.
Special issue statement. This article is part of the special issue “SKYNET – the international network for aerosol, clouds, and solar radiation studies and their applications”. It is not associated with a conference.
Acknowledgements. We thank ARPA Valle D’Aosta and ARPA Lazio for providing ground measurements observations needed for the elaboration of GPS measurements.
We also thank Marco Cacciani of the University of Rome, La Sapienza, Department of Physics, G24 laboratory, for hosting the PREDE-POM sun–sky radiometer of Rome.
The Spanish Ministry of Economy and Competitiveness and the Valencia Autonomous Government are acknowledged for projects CGL2015-64785-R, CGL2015-70432-R and PROM-ETEUII/2014/058, which allowed the Burjassot-Valencia site measurements.
Edited by: Stelios Kazadzis
References
Alexandrov, M. D., Marshak, A., Cairns, B., Lacis, A. A., and Carlson, B. E.: Automated cloud screening algo-rithm for MFRSR data, Geophys. Res. Lett., 31, l04118, https://doi.org/10.1029/2003GL019105, 2004.
American Meteorological Society: Precipitable Water Vapor, Glos-sary of Meteorology, available at: http://glosGlos-sary.ametsoc.org/ wiki/Precipitable_water, last access date: 13 January 2015. Askne, J. and Nordius, H: Estimation of tropospheric delay for
mi-crowaves from surface weather data, Radio Sci., 22, 379–386 https://doi.org/10.1029/RS022i003p00379, 1987.
Bennitt, G. V. and Jupp, A.: Operational assimilation of GPS zenith total delay observations into the Met Office numerical weather prediction models, Mon. Weather Rev., 140.8, 2706–2719, 2012. Bevis, M., Businger, S., Herring, T. A., Rocken, C., An-thes, R. A., and Ware, R. H.: GPS meteorology: Re-mote sensing of atmospheric water vapor using the global positioning system, J. Geophys. Res., 97, 15787–15801, https://doi.org/10.1029/92JD01517, 1992.
Bock, O. and Doerflinger, E.: Atmospheric modelling in GPS data analysis for high accuracy positioning, Phys. Chem. Earth, 26, 373–383, 2001.
Bock, O., Bosser, P., Bourcy, T., David, L., Goutail, F., Hoareau, C., Keckhut, P., Legain, D., Pazmino, A., Pelon, J., Pipis, K., Poujol, G., Sarkissian, A., Thom, C., Tournois, G., and Tzanos, D.: Accuracy assessment of water vapour measure-ments from in-situ and remote sensing techniques during the DE-MEVAP 2011 campaign at OHP, Atmos. Meas. Tech., 6, 2777– 2802, https://doi.org/10.5194/amt-6-2777-2013, 2013.
Bock, O., Bosser, P., Pacione, R., Nuret, M., Fourrié, N., and Parracho, A.: A high-quality reprocessed ground-based GPS dataset for atmospheric process studies, radiosonde and model evaluation, and reanalysis of HyMeX Special Ob-serving Period, Q. J. Roy. Meteorol. Soc., 142, 56–71, https://doi.org/10.1002/qj.2701, 2016.
Bonafoni, S., Mazzoni, A., Cimini, D., Montopoli, M., Pierdicca, N., Basili, P., Ciotti., P., and Carlesimo, G.: Assessment of water vapor retrievals from a GPS receiver network, GPS Solut., 17, 475–484, https://doi.org/10.1007/s10291-012-0293-5, 2013. Bruegge, C. J., Conel, J. E., Green, R. O., Margolis, J. S., Holm,
R. G., and Toon, G.: Water vapor column abundances retrievals during FIFE, J. Geophys. Res., 97, 18759–18768, 1992. Campanelli, M., Estellés, V., Tomasi, C., Nakajima, T., Malvestuto,
V., and Martiínez-Lozano, J. A.: Application of the SKYRAD Improved Langley plot method for the in situ calibration of CIMEL Sun–sky photometers, Appl. Optics, 46, 2688–2702, 2007.
Campanelli, M., Estellés, V., Smyth, T., Tomasi, C., Martínez-Lozano, M. P., Claxton, B., Muller, P., Pappalardo, G., Pietruczuk, A., Shanklin, J., Colwell, S., Wrench, C., Lupi, A., Mazzola, M., Lanconelli, C., Vitale, V., Congeduti, F., Dionisi, D., and Cacciani, M.: Monitoring of Eyjafjallajoekull volcanic aerosol by the new European SkyRad users (ESR) sun–sky ra-diometer network, Atmos. Environ., 48, 33–45, 2012.
Campanelli, M., Nakajima, T., Khatri, P., Takamura, T., Uchiyama, A., Estellés, V., Liberti, G. L., and Malvestuto V., Retrieval of characteristic parameters for water vapour transmittance in the development of ground-based sun–sky radiometric
measure-ments of columnar water vapour, Atmos. Meas. Tech., 7, 1075– 1087, https://doi.org/10.5194/amt-7-1075-2014, 2014.
Davis, J., Herring, T., Shapiro, I., and Rogers, A.: Elgered Geodesy by radio interferometry: effects of atmospheric modelling er-rors on estimates of baseline length, Radio Sci., 20, 1593–1607, https://doi.org/10.1029/RS020i006p01593, 1985.
Diémoz H., Magri, T., Pession, G., Zublena, M., Campanelli, M., Gobbi, G. P., Barnaba, F., Di Liberto, L., and Dionisi, D.: Thermally-driven advections of aerosol-rich air masses to an Alpine valley: Theoretical considerations and experimental ev-idences, EGU General Assembly, Vienna, 2016.
Elgered, G., Rönnäng, B. O., and Askne, J. I. H.: Measurements of atmospheric water vapor with microwave radiometry, Radio Sci., 17, 1258–1264, 1982.
Guerova, G., Jones, J., Douša, J., Dick, G., de Haan, S., Pottiaux, E., Bock, O., Pacione, R., Elgered, G., Vedel, H., and Bender, M.: Review of the state of the art and future prospects of the ground-based GNSS meteorology in Europe, Atmos. Meas. Tech., 9, 5385–5406, https://doi.org/10.5194/amt-9-5385-2016, 2016. Halthore, R. N., Eck, T. F., Holben, B. N., and Markham, B. L.: Sun
photometric measurements of atmospheric water vapor column abundance in the 940 nm band, J. Geophys. Res., 102, 4343– 4352, https://doi.org/10.1029/96JD03247, 1997.
Haywood, J. M., Bellouin, N., Jones, A., Boucher, O., Wild, M., and Shine, K. P.: The roles of aerosol, water vapor and cloud in future global dimming/brightening, J. Geophys. Res., 116, D20203, https://doi.org/10.1029/2011JD016000, 2011. Holben, B. N., Eck, T. I., Slutsker, I., Tanré, D., Buis, J. P.,
Set-zer, A., Vermote, E., Reagan, J. A., Kaufman, Y. J., Nakajima, T., Lavenu, F., Jankowiak, I., and Smirnov, A.: AERONET – A federated instrument network and data archive for aerosol char-acterization, Remote Sens. Environ., 66, 1–16, 1998.
Hong, L., Yunchanga, C., Xiaominb, W., Zhifangb, X., Haishena, W., and Henga, H.: Meteorological applications of precip-itable water vapor measurements retrieved by the national GNSS network of China, Geodesy Geodynam., 6, 135–142, https://doi.org/10.1016/j.geog.2015.03.001, 2015.
Kasten, F.: A new table and approximation formula for the relative optical air mass, Arch. Met. Geophys. Biokl. Ser. B, 14, 206– 233, 1966.
Kasten, F. and Young, A. T.: Revised optical air mass tables and approximation formula, Appl. Optics, 28, 4735–4738, 1989. Lyapustin, A. I.: Radiative transfer code SHARM for atmospheric
and terrestrial applications, Appl. Optics, 44, 7764–7772, 2005. Nyeki, S., Vuilleumier, L., Morland, J., Bokoye, A., Viatte, P.,
Mätzler, C., and Kämpfer, N., A 10-year integrated atmo-spheric water vapor record using precision filter radiometers at two high-alpine sites, Geophys. Res. Lett., 32, L23803, https://doi.org/10.1029/2005GL024079, 2005.
Pérez-Ramírez, D., Whiteman, D. N., Smirnov, A., Lyamani, H., Holben, B. N., Pinker, R., Andrade, M., and Alados-Arboledas, L.: Evaluation of AERONET precipitable water vapor versus microwave radiometry, GPS, and radiosondes at ARM sites, J. Geophys. Res.-Atmos., 119, 9596–9613, https://doi.org/10.1002/2014JD021730, 2014.
GPS stations in Météo France 4DVAR, J. Geophys. Res.-Atmos., 112, 1984–2012, 2007.
Reagan, J. A., Thomason, L. W., Herman, B. M., and Palmer, J. M.: Assessment of atmospheric limitations on the determination of the solar spectral constant from ground-based spectroradiome-ter measurements, IEEE T. Geosci. Electron., GE-24, 258–265, 1986.
Realini, E., Sato, K., Tsuda, T., Susilo, and Manik, T.: An obser-vation campaign of precipitable water vapor with multiple GPS receivers in western Java, Indonesia Prog. Earth Planet. Sci., 17, 20141, https://doi.org/10.1186/2197-4284-1-17, 2014.
Rothman, L. S., Barbe, A., Benner, D. C., Brown, L. R., Camy-Peyret, C., Carleer, M. R., Chance, K., Clerbaux, C., Dana, V., Devi, V. M., Fayt, A., Flaud, J.-M., Gamache, R. R., Goldman, A., Jacquemart, D., Jucks, K. W., Lafferty, W. J., Mandin, J.-Y., Massie, S. T., Nemtchinov, V., Newnham, D. A., Perrin, A., Rins-land, C. P., Schroeder, J., Smith, K. M., Smith, M. A. H., Tang, K., Toth, R. A., Vander Auwera, J., Varanasi, P., and Yoshino, K.: The HITRAN molecular spectroscopic database: Edition of 2000 including updates through 2001, J. Quant. Spectrosc. Ra., 82, 5– 44, https://doi.org/10.1016/S0022-4073(03)00146-8, 2003.
Saastamoinen, J.: Contributions to the theory of atmospheric refrac-tion, Bulletin Géodésique, 107.1, 13–34, 1973.
Schmidt, G. A., Ruedy, R. A., Miller, R. L., and Lacis, A. A.: At-tribution of the present-day total greenhouse effect, J. Geophys. Res., 115, D20106, https://doi.org/10.1029/2010JD014287, 2010.
Smirnov, A., Holben, B. N., Lyapustin, A., Slutsker, I., and Eck, T. F.: AERONET processing algorithms refinement, in: Proceed-ings of AERONET workshop, NASA/GSFC AERONET project, El Arenosillo, Spain, 2004.
Wehrli, C.: Calibrations of filter radiometers for determination of atmospheric optical depths, Metrologia, 37, 419–422, 2000. Yu, S., Alapaty, K., Mathur, R., Pleim, J., Zhang, Y., Nolte, C., Eder,