SHORT COMMUNICATION SALINITY INDUCED COMPOSITIONAL CHANGES IN GERMINATING SEEDS OF MUSTARD GENOTYPES
5
0
0
Full text
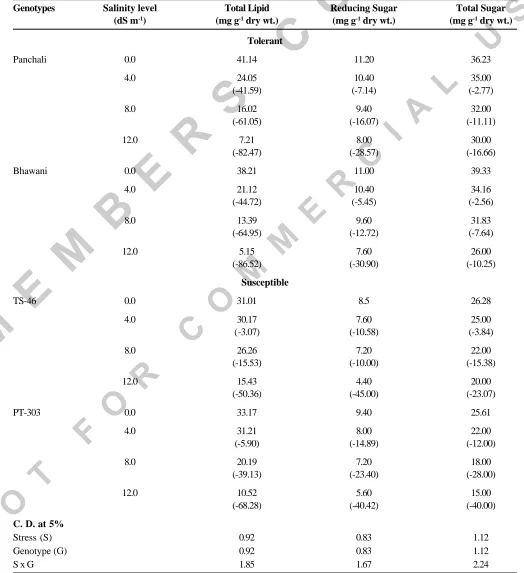
(2) A.K. SINGH et al.. Table 1. Influence of salinity levels on total lipid and sugar content of rapeseed genotypes. Genotypes. Salinity level (dS m-1). Total Lipid (mg g-1 dry wt.). Reducing Sugar (mg g-1 dry wt.). Total Sugar (mg g-1 dry wt.). Tolerant Panchali. Bhawani. 0.0. 41.14. 11.20. 36.23. 4.0. 24.05 (-41.59). 10.40 (-7.14). 35.00 (-2.77). 8.0. 16.02 (-61.05). 9.40 (-16.07). 32.00 (-11.11). 12.0. 7.21 (-82.47). 8.00 (-28.57). 30.00 (-16.66). 0.0. 38.21. 11.00. 39.33. 4.0. 21.12 (-44.72). 10.40 (-5.45). 34.16 (-2.56). 8.0. 13.39 (-64.95). 9.60 (-12.72). 31.83 (-7.64). 12.0. 5.15 (-86.52). 7.60 (-30.90). 26.00 (-10.25). Susceptible TS-46. PT-303. C. D. at 5% Stress (S) Genotype (G) SxG. 0.0. 31.01. 8.5. 26.28. 4.0. 30.17 (-3.07). 7.60 (-10.58). 25.00 (-3.84). 8.0. 26.26 (-15.53). 7.20 (-10.00). 22.00 (-15.38). 12.0. 15.43 (-50.36). 4.40 (-45.00). 20.00 (-23.07). 0.0. 33.17. 9.40. 25.61. 4.0. 31.21 (-5.90). 8.00 (-14.89). 22.00 (-12.00). 8.0. 20.19 (-39.13). 7.20 (-23.40). 18.00 (-28.00). 12.0. 10.52 (-68.28). 5.60 (-40.42). 15.00 (-40.00). 0.92 0.92 1.85. 0.83 0.83 1.67. 1.12 1.12 2.24. Figures in parentheses indicate per cent decrease (-) over control. 298. Indian J. Plant Physiol., Vol. 10, No. 3, (N.S.) pp. 297-301 (July-Sept., 2005).
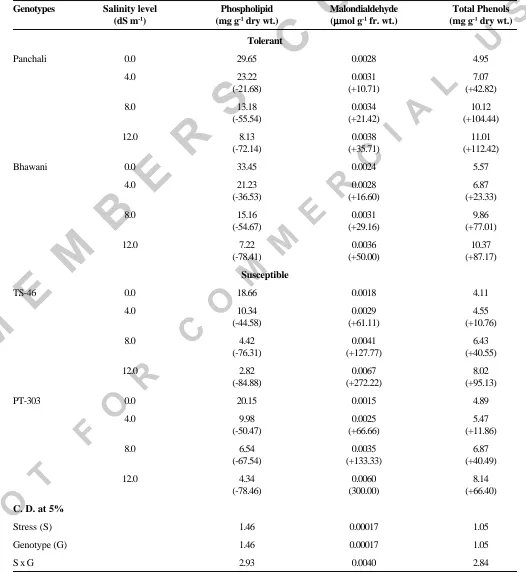
(3) SALINITY INDUCED CHANGES IN GERMINATING SEEDS OF MUSTARD. Table 2. Influence of salinity levels on phospholipid, malondialdehyde and phenols of rapeseed genotypes. Genotypes. Salinity level (dS m-1). Phospholipid (mg g-1 dry wt.). Malondialdehyde µmol g-1 fr. wt.) (µ. Total Phenols (mg g-1 dry wt.). Tolerant Panchali. Bhawani. 0.0. 29.65. 0.0028. 4.95. 4.0. 23.22 (-21.68). 0.0031 (+10.71). 7.07 (+42.82). 8.0. 13.18 (-55.54). 0.0034 (+21.42). 10.12 (+104.44). 12.0. 8.13 (-72.14). 0.0038 (+35.71). 11.01 (+112.42). 0.0. 33.45. 0.0024. 5.57. 4.0. 21.23 (-36.53). 0.0028 (+16.60). 6.87 (+23.33). 8.0. 15.16 (-54.67). 0.0031 (+29.16). 9.86 (+77.01). 12.0. 7.22 (-78.41). 0.0036 (+50.00). 10.37 (+87.17). Susceptible TS-46. 0.0. 18.66. 0.0018. 4.11. 4.0. 10.34 (-44.58). 0.0029 (+61.11). 4.55 (+10.76). 8.0. 4.42 (-76.31). 0.0041 (+127.77). 6.43 (+40.55). 12.0. 2.82 (-84.88). 0.0067 (+272.22). 8.02 (+95.13). 0.0. 20.15. 0.0015. 4.89. 4.0. 9.98 (-50.47). 0.0025 (+66.66). 5.47 (+11.86). 8.0. 6.54 (-67.54). 0.0035 (+133.33). 6.87 (+40.49). 12.0. 4.34 (-78.46). 0.0060 (300.00). 8.14 (+66.40). Stress (S). 1.46. 0.00017. 1.05. Genotype (G). 1.46. 0.00017. 1.05. SxG. 2.93. 0.0040. 2.84. PT-303. C. D. at 5%. Figures in parentheses indicate per cent increase (+) or decrease (-) over control. Indian J. Plant Physiol., Vol. 10, No. 3, (N.S.) pp. 297-301 (July-Sept., 2005). 299.
(4) A.K. SINGH et al.. Reducing sugar content in 8-day-old seedlings showed a decreasing trend with rise in salinity stress from control to the maximum (12.0 dS m-1). At maximum salinity level, higher reducing sugar content was observed in Panchali (8.00 mg) and Bhawani (7.60 mg) than TS46 (4.40 mg) and PT-303 (5.60 mg). All the four genotypes showed the same trend for total sugar content (Table 1). Lower values of total sugar were recorded in TS-46 (20.00 mg) and PT-303 (15.00 mg) in comparison to tolerant genotypes Panchali (30.00 mg) and Bhawani (26.00 mg), respectively at 12.0 dS m -1. Salt stress induced reduction in sugar content has been reported by Singh and Singh (1995).. induced increase in phenol content have been reported by Latha et al. (1989) and Singh et al. (2001b). Phenol constitute a part of cellular solutes and provide a reducing environment to the system (Das et al. 1990). Levitt (1980) reported that salt stress exerts its effect through membrane peroxidation, which indicates that oxygen free radicals are formed during stress. Thus, higher phenol accumulation in tolerant genotypes could be a cellular adaptive mechanism for scavenging oxygen free radicals and preventing sub-cellular damages during stress. Higher sugar and phenol contents, and lower malondialdehyde content might prove useful for screening or improving mustard genotypes to withstand salinity.. The phospholipid content of all the four genotypes exhibited gradual reduction with the increasing salinity stress (Table 2). However, susceptible genotypes showed lower values, viz., TS-46 (2.82 mg) and PT-303 (4.34 mg) in comparison to tolerant genotypes, viz. Panchali (8.13 mg) and Bhavani (7.22 mg) at 12.0 dS m -1. Phospholipid metabolism is also involved in plant responses to salinity stress (Katagiri et al. 2001). Phospholipids are major constituent of all the biological membrane. It is suggested that salt induced membrane injury may be due to changes in the membrane lipid composition and protein or both (Levitt 1980).. REFERENCES. Free radicals and other active derivatives of oxygen (ROS) are inevitable product of natural redox reaction in various cellular compartments under aboitic stress conditions. The free radical mediated peroxidation of unsaturated fatty acids, also known as lipid peroxidation, is a chain reaction occurring mainly in biomembranes (Ursini et al. 1991). Increasing trend of MDA content, a measure of lipid peroxidation, was noticed in all the genotypes under study with increasing salinity stress (Table 2). At 12.0 dS m-1, the values were lower in tolerant ones, viz. Panchali (0.0038 µmol) and Bhawani (0.0036 µmol) in comparison to susceptible ones, viz. TS46 (0.0067 µmol) and PT-303 (0.0060 µmol). Stress induced increase in malondialdehyde has also been reported by Kasturi Bai et al. (2001). Our findings (Table 2) indicates that the total phenols increased in all the genotypes under reference with rise in salinity levels, and the tolerant genotypes maintained a higher level of phenols at all the stress levels. Salinity 300. Das, N., Misra, M. and Misra, A. N. (1990). Sodium chloride salt stress induced metabolic changes in callus cultures of pearl millet (Pennisetum americanum L.) : Free solute accumulation. J. Plant Physiol. 137 : 244-246. Epstein, E., Norlyn, J.D., Rush, D.W., Kingsbury, R.W., Kelly, D.W., Kunningham, G.A. and Wrona, A.F. (1980). Saline culture of crops : A genetic approach. Science 210 : 399404. Farkas, G.L. and Kiraly, Z. (1962). Role of phenolic compounds in the physiology of plant disease and disease resistance. Phytopathology 44 : 105-150. Helliwel, B. and Gutteridge, J.M.C. (1989). Free Radical in Biology and Medicine (2nd Edn.). Oxford, Claredo Press. Jayaraman, J. (1981). Laboratory Manual in Biochemistry, Wiley Eastern Ltd., New Delhi. Kasturi Bai, K.V., Rajagopal, V. and Ratnambal, M.J. (2001). Relationship between leaf water potential and peroxidation of cell wall lipids in coconut. J. Plant Biol. 28 : 161-164. Katagiri, T., Takahashi, S. and Shinozaki, K. (2001). Involvement of a novel Arabidopsis phospholipase, D., At PLDdelta, in dehydration - inducible accumulation of phosphatidic acid in stress signalling. Plant J. 26 : 595605. Latha, V.M., Satakopan, V.N. and Jayasree, H. (1989). Salinity induced changes in phenol and ascorbic acid content in groundnut (Arachis hypogaea) leaves. Curr. Sci. 58 : 151-152.. Indian J. Plant Physiol., Vol. 10, No. 3, (N.S.) pp. 297-301 (July-Sept., 2005).
(5) SALINITY INDUCED CHANGES IN GERMINATING SEEDS OF MUSTARD. Levitt, J. (1980). Responses of Plants to Environmental Stresses. Academic Press, New Delhi. Miller, G.L. (1959). Use of dinitrosalicylic acid reagent for the determination of reducing sugars. Analy. Chem. 31 : 426428. Munshi, S.K., Bhatia, N., Dhillon, K.S. and Sukhija, P.S. (1986). Effect of moisture and salt stress on oil filling in Brassica seeds. Proc. Indian National Sci. Acad. 52 : 755-759. Singh, A.K., Ranjan, R.D. and Pandey, A. (2001a). Germination study in rapeseed (Brassica campestris L. var. toria) under salt stress. J. Appl. Biol. 11 : 23-26.. Indian J. Plant Physiol., Vol. 10, No. 3, (N.S.) pp. 297-301 (July-Sept., 2005). Singh, A.K., Singh, R.A. and Sharma, S.G. (2001b). Salt stress induced changes in certain organic metabolites during seedling growth of chickpea. Legume Res. 24 : 11-15. Singh, M. and Singh, S. (1995). Sodicity induced changes in saccharides, free proline and protein content of different pea genotypes. Indian J. Plant Physiol. 38 : 109-113. Ursini, F., Maiorino, M. and Sevanian, A. (1991). Membrane hydroperoxide. In: H. Sies (ed.), Oxidative Stress Oxidant and Antioxidants, pp. 319-336. Academic Press, New York.. 301.
(6)
Figure
Related documents
[3] NEST’s primary goals are to read in ESA and third part SAR data products, provide tools for calibration, orthorectification, co-registration, interferometry,
de Klerk, South Africa’s last leader under the apartheid regime, Mandela found a negotiation partner who shared his vision of a peaceful transition and showed the courage to
As I will demonstrate, the problem raised by Pound in his 1910 paper is virtually identical to the one Kelsen tried to solve a few decades later: how to build a legal science
The Master Fund is authorised in Luxembourg as a specialised investment fund and is managed by a management company, Ress Capital Fund Management SA, who acts
Customer Information Management (CIM): The Key to Successful CRM in Financial Services.. Reputation – Managing the single greatest risk facing
The aim of this paper was to explore the effects on the French forest sector of three policies to mitigate climate change: a fuelwood consumption subsidy (substitution), a payment
The testimony of the State Department employee was brought to public hearings in hope that he turned out to be a communist, showing that even in a case potentially dealing
Background: The prevalence and intensity of soil-transmitted helminth infections and the anthropogenic risk factors of 978 randomly selected primary school children from
