5849
INTRODUCTION
Breeding for increased animal feed conversion efficiency (FCE; live weight [LW] gain/DMI) is im-portant for a sustainable livestock industry. However, the substantial genetic variation for FCE in cattle and sheep (Berry and Crowley, 2013) has not been ex-ploited because of the difficulty and cost of record-ing feed intake and LW changes (Herd et al., 2003). Candidate metabolites or hormone biomarkers have
been explored but did not provide consistent rela-tionships with FCE (Kelly et al., 2010; Lawrence et al., 2012). Recently, Wheadon et al. (2014) found a significant negative correlation between FCE and plasma N isotopic fractionation (Δ15N; animal δ15N
– feed δ15N) in beef cattle, and similar correlations
were also reported in earlier work by Cheng et al. (2013a,b), which showed that N use efficiency (prod-uct N/N intake) in sheep and dairy cows was nega-tively related to Δ15N of muscle and plasma,
respec-tively. Previous work showed the change in Δ15N was
related to major N metabolism reactions such as liver transamination (Macko et al., 1986) and rumen mi-crobial protein synthesis (Wattiaux and Reed, 1995). Although there is tentative evidence for an association
between FCE and Δ15N from comparisons of
physi-ological states and effects of dietary treatments that are expected to alter FCE (Sponheimer et al., 2003), it is only recently that the association was confirmed using measurements of FCE for beef cattle offered identical diets (Wheadon et al., 2014). It is not clear if
Effects of feed intake and genetics on tissue
nitrogen-15 enrichment and feed conversion efficiency in sheep
1L. Cheng,*2 C. M. Logan,* R. J. Dewhurst,† S. Hodge,* H. Zhou,* and G. R. Edwards*
*Faculty of Agriculture and Life Sciences, P.O. Box 85084, Lincoln University, Lincoln 7647, New Zealand; and †Scotland’s Rural College, King’s Buildings, West Mains Road, Edinburgh EH9 3JG, UK
ABSTRACT: This study investigated the effects of sheep genetics and feed intake on nitrogen isotopic frac-tionation (Δ15N) and feed conversion efficiency (FCE;
live weight gain/DMI), using a 2 × 2 factorial design, with 2 levels of genetic merit for growth (high vs. low) and 2 levels of feed intake (110 vs. 170% of ME for maintenance [MEm]). No effect of genetic merit was detected for live weight gain (P = 0.64), FCE (P = 0.46), plasma urea nitrogen (P = 0.52), plasma glucose (P = 0.78), and Δ15N of wool (P = 0.45), blood (P = 0.09),
and plasma (P = 0.51). Sheep receiving 170% of MEm had 175% higher live weight gain (P < 0.001) and 77% higher FCE (P < 0.001) than sheep receiving 110% of
MEm. There was no difference among treatments at the beginning of the study for either blood or plasma ∆15N,
but the treatment groups started to diverge in blood and plasma ∆15N at 21 and 7 d, respectively. Blood, plasma,
and wool samples were enriched in 15N compared with
feed. There was a higher blood, plasma, and wool ∆15N
for the low feed intake group than the high feed intake group (P < 0.001 in all cases). Across the 4 treatment groups, higher FCE in sheep was associated with lower ∆15N for plasma, blood, and wool. Overall, the results
are consistent with the potential of ∆15N as a rapid,
low-cost biomarker of FCE in sheep, despite there being no effects of genetic treatment on FCE and ∆15N.
Key words:
genetic and nutritional interaction,
growth potential, isotopic discrimination, live weight gain, nitrogen-15
©
2015 American Society of Animal Science. All rights reserved
. J. Anim. Sci. 2015.93:5849–5855
doi:10.2527/jas2015-9638
1Financial support was provided by New Zealand Foundation for
Research, Science and Technology and AGMARDT Post-Doctoral Fellowship (Long Cheng). We thank Laura Mansard (Bordeaux Sciences Agro, France), Roger Payne (VSN International), Amy Smaill, Robin McAnulty, Roger Cresswell, Shuang Jiang, Jenny Zhao, Rosy Tung, and Nicole Wheadon (Lincoln University) for technical assistance, laboratory analysis, and useful discussion.
2Corresponding author: [email protected]
such an association would also be observed with other species and also when considering genetic differences between groups of animals and when different diets were offered to animals. The objective of this study was to evaluate sheep genetic and feed intake effects on Δ15N and FCE and the association between Δ15N
and FCE and to compare 3 types of samples (blood, plasma, and wool) for determination of δ15N and Δ15N.
MATERIALS AND METHODS
Experimental Design
Twenty-four 11- to 12-mo-old Coopworth rams were used in this study. Two levels of genetic merit and 2 levels of feed intake were evaluated using a 2 × 2 factorial design. The 4 treatments were high genetic merit + high feed intake (HGHF), high genetic merit + low feed intake (HGLF), low genetic merit + high feed intake (LGHF), and low genetic merit + low feed intake (LGLF). Each treatment group had 6 sheep and they were fed for 1 wk as diet adaptation and 5 wk for LW measurement and sample collection.
Animal Selection, Diet, and Feed Allowance
The Coopworth flock from Ashley Dene Research Farm, Lincoln University, Lincoln, New Zealand, was used to supply sheep for this study. The high genetic merit (HG) and low genetic merit (LG) groups were se-lected based on the New Zealand Sheep Improvement Limited (http://www.sil.co.nz/) dual purpose for growth. The selection line and control line were established in 1986 to support a long-term research project investi-gating the rate of genetic progress using single trait or multitrait selection. The mean (SD) were 1,677 (158.9) New Zealand cents (¢) and 180 (185.6) New Zealand ¢ for HG and LG, respectively. Each group was then divided into 2 subgroups for high feed intake (HF) and low feed intake (LF), balanced for LW measured at the start of the measurement period (Table 1).
All sheep grazed on ryegrass and clover based pas-ture before the study. Alfalfa pellets (SealesWinslow Ltd., Ashburton, New Zealand) were gradually intro-duced to the sheep for 1 wk before the study commenced. Two days before the measurement period, sheep were consuming a diet of 100% alfalfa pellet. Throughout the study, fresh water was offered ad libitum. The feed-ing allowance was designed to provide either 110% of ME for maintenance (MEm) for LF groups or 170% of MEm for HF groups, based on the equation MEm = 0.5 × LW0.75 (Nicol and Brookes, 2007).
Animal Measurements
The study was undertaken under the authority of Lincoln University Animal Ethics Committee (applica-tion number 536). Sheep were individually housed in pens with feed offered once a day at 1030 h. All sheep were weighed (XR 3000; Tru-Test Group, Auckland, New Zealand) after 12 h overnight fasting at the start and the end of the 5 wk measurement period. Each sheep was offered alfalfa pellets daily, based on cal-culated feed allowance according to group average LW measured at the start of the measurement period. Feed refusals were recorded to calculate DMI. In ad-dition, FCE was calculated using the equation FCE (g/ kg) = LW gain (g/d)/DMI (kg/d). Weekly feed samples from each treatment group were collected and stored at –20°C before compositional and δ15N analysis.
Blood samples were collected from the jugular vein of each sheep into 10 mL Li-heparinized
evacu-ated tubes at 1430 h on the first day of measurement Week 1 and at the last day of each measurement week.
Blood was subsampled into tubes to harvest plasma by centrifugation at 1,200 × g for 15 min at 4°C and then both blood and plasma were stored at –20°C. A total of 120 blood samples were obtained from this study. There were 9 hemolyzed samples and the corresponding plas-ma samples were excluded for δ15N and glucose
analy-sis due to contamination of plasma with red blood cells after centrifugation. A 5-mm wool sample per sheep was shaved from skin level 2 wk after the completion of
the study (Rogers and Schlink, 2010) for δ15N analysis.
Chemical Analysis
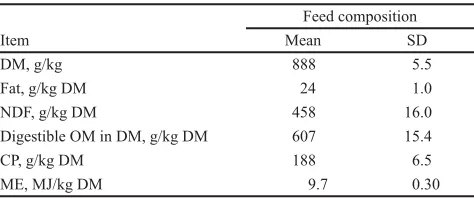
Alfalfa pellet samples were bulked per treatment at the end of the study and then ground to pass through a 1.0-mm sieve (Christy Lab Mill, Suffolk, UK). The fat, CP, digestible OM in DM (DOMD), and NDF were predicted by near-infrared spectroscopy (Feed and Forage Foss Analyzer 500; FOSS Analytical, Hillerod, Denmark), which is regularly calibrated with results from wet chemistry. The estimated ME content was
Table 1. Average chemical composition (mean and SD) of feed samples collected over the 5-wk measure-ment period (n = 20)
Item
Feed composition
Mean SD
DM, g/kg 888 5.5
Fat, g/kg DM 24 1.0
NDF, g/kg DM 458 16.0
Digestible OM in DM, g/kg DM 607 15.4
CP, g/kg DM 188 6.5
calculated using the formula from Clarke et al. (1982): ME (MJ/kg DM) = DOMD (g/kg) × 0.016. Feed, blood, plasma, and wool samples were freeze-dried and ana-lyzed for δ15N according to the method described by
Cheng et al. (2011) using an isotope-ratio mass spec-trometer (PDZ Europa Ltd., Crewe, UK). Plasma urea nitrogen and glucose were analyzed by using an enzymatic kinetic method on a Daytona RX Clinical Analyzer (Randox, Nishonomiya, Japan).
Statistical Analysis
All statistical analyses were performed using Genstat version 16 (VSN International Ltd., Hemel Hempstead, UK). Results were considered statistically significant at P < 0.05.
For LW (at Weeks 0 and 5), LW gain, and FCE (over the whole 5 wk experimental period), the effects of feed intake and genetic merit and the interaction between these 2 main factors were assessed by 2-way ANOVA.
Plasma urea N and glucose data were also analyzed using 2-way ANOVA, with main factors feed intake and genetic merit and the interaction term, based on the mean values for each sheep obtained over the 5-wk
experimen-tal period. Wool δ15N and ∆15N data were analyzed by
similar 2-way ANOVA based on values obtained from the single measurement of wool δ15N for each sheep.
For blood δ15N and Δ15N and plasma δ15N and
Δ15N, an antedependence analysis was performed
to determine at which weeks from the start of the experiment these variables became independent of preceding values (thus avoiding difficulties related to autocorrelation of data between time points). This antedependence assessment resulted in the data for blood Δ15N from Weeks 4 through 5 and for plasma
Δ15N from Weeks 2 through 5 being considered
inde-pendent from prior values (sees Fig. 1). Therefore, to assess the effects of feed intake and genetic merit on these variables, 2-way ANOVA was performed on the average values for each sheep from Weeks 4 through 5 for blood and Weeks 2 through 5 for plasma.
The way in which the responses of blood Δ15N and
plasma Δ15N to feed intake and genetic merit were
af-fected by time from commencement of the different diet regimes were further analyzed using repeated measures ANOVA. For this analysis, any missing val-ues for individual sheep at specific time points were replaced using maximum likelihood estimates.
To examine the relationships between plasma ∆15N,
blood ∆15N, wool ∆15N, and FCE, Pearson’s correlation
coefficient was calculated using the 4 group means.
RESULTS
The average chemical composition of the alfalfa pellets is shown in Table 1; negligible variation was found over time and between treatment groups for all the components measured.
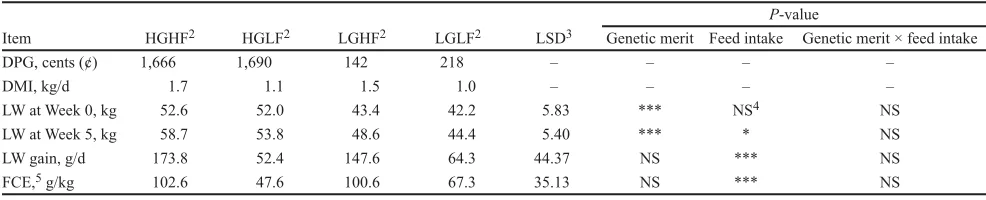
The HG animals were heavier than the LG ani-mals at both Week 0 and Week 5 (P < 0.001; Table 2). Although there was no difference between feed intake groups for LW at the beginning of the study (P = 0.65; Week 0), the HF animals were heavier than LF at the end of the study (Week 5; P = 0.02; Table 2). The HF animals had 175% higher LW gain (P < 0.001) and 77% higher FCE (P < 0.001) than the LF animals (Table 2).
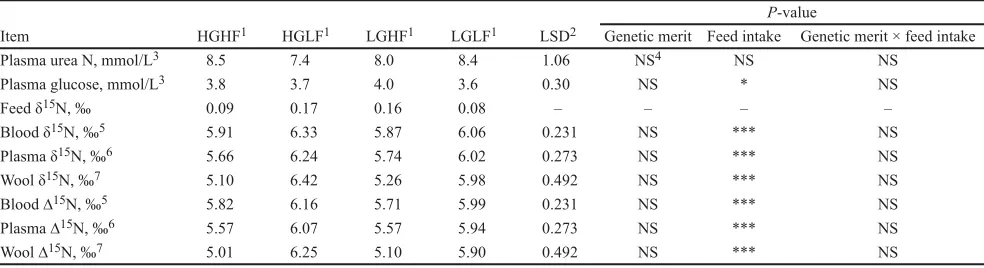
The HF animals had higher plasma glucose con-centrations than the LF animals (P = 0.01; Table 3). Blood, plasma, and wool samples measured for δ15N
in this study were enriched in 15N compared with feed.
There was significantly higher δ15N and ∆15N for
blood, plasma, and wool in the LF groups than in the HF groups (P < 0.001; Table 3).
There were statistically significant interactions be-tween genetic merit, feed intake, and time points for blood ∆15N (F
5, 100 = 2.90, P = 0.04) and plasma ∆15N
(F5, 100 = 7.09, P < 0.001) over the 5-wk study (Fig. 1). The general trend was that plasma ∆15N decreased over Figure 1. The change of N isotopic fractionation in plasma (1a)
the course of the study (Fig. 1a) whereas blood ∆15N
tended to increase (Fig. 1b). For plasma ∆15N, there
was as strong interaction between time and feed intake treatment (F5, 100 = 8.62, P < 0.001), with the feed intake groups starting to diverge after just 1 wk, with the LF group having a higher ∆15N than the HF group
(Fig. 1a). A similar significant divergence occurred in the blood ∆15N (F
5, 100 = 4.43, P < 0.006), with the
LF group having a higher ∆15N than the HF group,
al-though this time the separation was not so distinct and did not became apparent until Week 3.
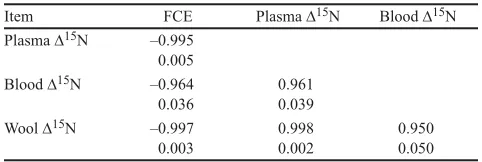
The ∆15N for plasma, blood, and wool all
respond-ed in a similar way among the 4 treatment groups of sheep, and therefore, significant positive relationships were observed between these variables (Table 4). Conversely, FCE was negatively related to all 3 ∆15N
measurements (Table 4).
DISCUSSION
Animal Performance
Similar trends across the 4 treatment groups were found for LW gain and FCE, with HGHF having the highest values followed by LGHF, LGLF, and HGLF. The higher LW gain and FCE observed for HF animals
compared with LF animals is consistent with previous sheep studies (Cottle, 2003; El-Sabagh et al., 2013), and it can be explained by the well-established posi-tive association between DMI and LW gain (Nicol and Brookes, 2007). The higher plasma glucose concentra-tion found in HF animals than in LF animals suggests that more energy is available for rumen fermentation and nutrient absorption of sheep offered HF compared with LF. On the other hand, the higher feeding level may lead to lower MEm cost relative to ME available
for LW gain. Such “dilution of maintenance cost” ef-fects allow higher proportions of ME to be used for pro-duction, leading to higher LW gain and FCE.
Although genetic effect was not observed for LW gain and FCE, it is interesting to note that LW gain and FCE were 23 and 14% higher for LGLF than for HGLF, respectively. This may be related to the different growth potential of LG and HG sheep under restricted feed in-take, which relates to the requirement of MEm. The use of MEm = 0.5 × LW0.75 (Nicol and Brookes, 2007) as a
general MEm prediction equation may not be suited for sheep, which differ in growth potential. Previous research suggested that high-producing dairy cows had larger in-ternal organs than low-producing dairy cows (Ferrell and Jenkins, 1984), which can lead to a higher MEm require-ment. This is supported by a recent trial in beef cattle, which showed higher FCE (measured as lower residual feed intake) due to a lower weight of the reticulorumen (Fitzsimons et al., 2014). Therefore, different MEm pre-diction equations may be needed to differentiate genetic differences in maintenance cost of animals.
Feed Conversion Efficiency in Relation
to Nitrogen Isotopic Fractionation
A feature of the results from this study was the strong negative association between the group mean ∆15N values and FCE. Earlier studies have shown weak
associations between FCE and single blood metabo-lite or hormone measurements. For example, Kelly et al. (2010) reported weak correlations between FCE and plasma leptin (r2 = 0.23), urea (r2 = 0.18), and NEFA (r2 = 0.10) in heifers, and Richardson et al. (2004) found only weak correlations between FCE and plasma glu-cose (r2 = 0.21), aspartate aminotransferase (r2 = 0.20), and albumin (r2 = 0.23) in steers. Nitrogen isotopic
Table 2. Dual purpose for growth (DPG),1 DMI, live weight (LW) gain, and feed conversion efficiency (FCE)
high and low genetic merit sheep offered high and low feed intake (mean; n = 6)
Item HGHF2 HGLF2 LGHF2 LGLF2 LSD3 Genetic merit Feed intake Genetic merit × feed intakeP-value
DPG, cents (¢) 1,666 1,690 142 218 – – – –
DMI, kg/d 1.7 1.1 1.5 1.0 – – – –
LW at Week 0, kg 52.6 52.0 43.4 42.2 5.83 *** NS4 NS
LW at Week 5, kg 58.7 53.8 48.6 44.4 5.40 *** * NS
LW gain, g/d 173.8 52.4 147.6 64.3 44.37 NS *** NS
FCE,5 g/kg 102.6 47.6 100.6 67.3 35.13 NS *** NS
1DPG is calculated genetic potential for LW gain by the New Zealand Sheep Improvement Limited (http://www.sil.co.nz/).
2HGHF = high genetic merit + high feed intake; HGLF = high genetic merit + low feed intake; LGHF = low genetic merit + high feed intake; LGLF = low genetic merit + low feed intake.
3P < 0.05.
fractionation provided a good indication of FCE in this study, and it seems likely that this association was driven by the partitioning of N between LW gain and excretion in urine. The negative association between ∆15N and
FCE is consistent with the increased ∆15N when cattle
and goats were fed diets containing higher protein lev-els (Sponheimer et al., 2003). It is also supported by the findings of Wheadon et al. (2014), who showed a strong negative relationship between individual cattle FCE and plasma ∆15N when they were offered the same diet.
Nitrogen Isotopic Fractionation
The enrichment of wool, plasma, and blood in 15N
compared with feed is consistent with the literature (Koyama, 1985; Sponheimer et al., 2003). The main rea-son for the enrichment of 15N in these samples was
prob-ably due to the major N components being true protein or AA, which are naturally enriched in 15N (Sick et al.,
1997; Cheng et al., 2010). The average levels of plasma ∆15N in this study was 5.66 ‰, which is in the upper end
of the range previously reported for both lactating and nonlactating ruminants (Cheng et al., 2013b; Wheadon et al., 2014). The reason for this high plasma δ15N value
in the current study is not clear, but it may be related to the maturity of the animals. Despite the high LW gain ob-served from the sheep used in this study, the sheep were close to maturity (Cottle, 2003), so an increased level of fat deposition might contribute to LW gain. Higher Δ15N
in tissues should be expected from these sheep compared with younger individuals because mature sheep utilize feed protein less efficiently than suckling or lactating
ani-mals (Wheadon et al., 2014). For this reason, the stage of maturity of animals should also be considered when discussing isotopic fractionation in animal tissues.
A strong positive relationship was observed be-tween ∆15N in plasma and blood, and this is expected
as plasma is a fraction of blood. Blood was relatively more enriched in 15N than plasma in this study. This is
because red blood cells in the blood contain mostly true protein, which is enriched in 15N relative to the urea
containing plasma (Sick et al., 1997). Furthermore, it may be related to differences in the AA profile of free and protein-bound AA in plasma and red blood cells. For example, serine is a major AA in red blood cells but is not found in plasma (Canepa et al., 2002). Serine had a high isotopic fractionation factor among the 17 AA analyzed by Zhang and Altabet (2008). The positive relationship between plasma and wool ∆15N
in this study may be related to Δ15N during digestion
and absorption or an effect of the endogenous contri-bution to the protein synthesized in the samples.
Variation in the Δ15N of blood and plasma was
observed over the 5-wk study. Because ∆15N has
al-ready been corrected for differences in dietary δ15N,
this difference is most likely derived from the varia-tion in protein turnover rates (Ben-David et al., 2012). Results from this study are consistent with a higher turnover rate of protein in plasma than in blood, which is in agreement with previous reports concerning a range of mammals (Hilderbrand et al., 1996; Lecomte et al., 2011; Ben-David et al., 2012).
The causes of the differences in turnover rates of ∆15N in blood and plasma are mainly due to their con-Table 3. Plasma urea N, plasma glucose, and N-15 concentrations (delta units expressed relative to standard air; ‰) in the feed, blood, plasma, and wool of high and low genetic merit sheep offered high and low feed intake (mean; n = 6)
Item HGHF1 HGLF1 LGHF1 LGLF1 LSD2 Genetic merit Feed intake Genetic merit × feed intakeP-value
Plasma urea N, mmol/L3 8.5 7.4 8.0 8.4 1.06 NS4 NS NS
Plasma glucose, mmol/L3 3.8 3.7 4.0 3.6 0.30 NS * NS
Feed δ15N, ‰ 0.09 0.17 0.16 0.08 – – – –
Blood δ15N, ‰5 5.91 6.33 5.87 6.06 0.231 NS *** NS
Plasma δ15N, ‰6 5.66 6.24 5.74 6.02 0.273 NS *** NS
Wool δ15N, ‰7 5.10 6.42 5.26 5.98 0.492 NS *** NS
Blood ∆15N, ‰5 5.82 6.16 5.71 5.99 0.231 NS *** NS
Plasma ∆15N, ‰6 5.57 6.07 5.57 5.94 0.273 NS *** NS
Wool ∆15N, ‰7 5.01 6.25 5.10 5.90 0.492 NS *** NS
1HGHF = high genetic merit + high feed intake; HGLF = high genetic merit + low feed intake; LGHF = low genetic merit + high feed intake; LGLF = low genetic merit + low feed intake.
2P < 0.05.
3Based on a mean value for each sheep over the 5 wk of the experiment. 4NS = non-significant.
5Based on a mean value for each sheep from Weeks 4 through 5. 6Based on a mean value for each sheep from Weeks 2 through 5.
stituent proteins. The major proteins in plasma and blood are albumin and hemoglobin, respectively, and the half-life of albumin is much shorter (approximately 14 d) than that of hemoglobin (approximately 120 d; Rendell et al., 1987). This would suggest that 14 d may be a conser-vative lower limit for plasma protein turnover in sheep. The predicted blood 15N half-life is approximately 20 d,
when assuming a blood cell-to-plasma ratio of 45:55 and adopting 40 and 4 d as the respective half-lives of each tissue type (Lecomte et al., 2011).
Conclusions
Overall, the results are consistent with the poten-tial of using ∆15N as a rapid, low-cost biomarker of
FCE in sheep, despite there being no effects of genetic treatment on FCE and ∆15N. Future studies on
lon-ger-term and complicated genetic and environmental interactions (e.g., different genotypes fed on different types and quantities of feed) should be explored, us-ing both mature and growus-ing animals, to confirm the value of using Δ15N as a performance measure across
entire sheep production systems.
LITERATURE CITED
Ben-David, M., S. D. Newsome, and J. P. Whiteman. 2012. Lipid and amino acid composition influence incorporation and dis-crimination ok 13C and 15N in mink. J. Mammal. 93:399–412.
doi:10.1644/11-MAMM-S-168.1.
Berry, D. P., and J. J. Crowley. 2013. Cell biology symposium: Genetics of feed efficiency in dairy and beef cattle. J. Anim. Sci. 91:1594–1613. doi:10.2527/jas.2012-5862.
Canepa, A., J. C. D. Filho, A. Gutierrez, A. Carrea, A. M. Forsberg, E. Nilsson, F. Perfumo, and J. Bergström. 2002. Free amino acids in plasma, red blood cells, polymorphonuclear leuko-cytes, and muscle in normal and uraemic children. Nephrol. Dial. Transplant. 17:413–421. doi:10.1093/ndt/17.3.413. Cheng, L., R. J. Dewhurst, J. Larkin, F. Buckley, C. Thackaberry,
A. M. Nicol, and G. R. Edwards. 2010. Brief communication: Investigation of N isotopic fractionation in dairy cows using milk samples collected at the morning and afternoon milk-ings. Proc. N. Z. Soc. Anim. Prod. 70:65–66.
Cheng, L., E. J. Kim, R. J. Merry, and R. J. Dewhurst. 2011. Nitrogen partitioning and isotopic fractionation in dairy cows consuming diets based on a range of contrasting forages. J. Dairy Sci. 94:2031–2041. doi:10.3168/jds.2010-3763. Cheng, L., A. M. Nicol, R. J. Dewhurst, and G. R. Edwards. 2013a.
The effects of dietary nitrogen to water-soluble carbohydrate ratio on isotopic fractionation and partitioning of nitrogen in non-lactating sheep. Animal 7:1274–1279. doi:10.1017/ S1751731113000311.
Cheng, L., A. J. Sheahan, S. J. Gibbs, A. G. Rius, J. K. Kay, S. Meier, G. R. Edwards, R. J. Dewhurst, and J. R. Roche. 2013b. Technical note: Nitrogen isotopic fractionation can be used to predict nitrogen-use efficiency in dairy cows fed temperate pasture and supplemented with urea. J. Anim. Sci. 91:5785–5788. doi:10.2527/jas.2012-5378.
Clarke, T., P. C. Flinn, and A. A. McGowan. 1982. Low-cost pep-sin-cellulase assays for prediction of digestibility of herbage. Grass Forage Sci. 37:147–150. doi:10.1111/j.1365-2494.1982. tb01590.x.
Cottle, D. J. 2003. Sheep breeds. In: Australian sheep and wool handbook. WRONZ Developments, Christchurch, New Zealand. p. 19–63.
El-Sabagh, M., M. Goto, T. Sugino, T. Obitsu, and K. Taniguchi. 2013. Energy metabolism by splanchnic tissues of ma-ture sheep fed varying levels of alfalfa hay cubes. Animal 7:1622–1630. doi:10.1017/S1751731113001225.
Ferrell, C. L., and T. G. Jenkins. 1984. Relationships among various body components of mature cows. J. Anim. Sci. 58:222–233. Fitzsimons, C., D. A. Kenny, and M. McGee. 2014. Visceral organ
weights, digestion and carcass characteristics of beef bulls differing in residual feed intake offered a high concentrate diet. Animal 8:949–959. doi:10.1017/S1751731114000652. Herd, R. M., J. A. Archer, and P. F. Arthur. 2003. Reducing the
cost of beef production through genetic improvement in re-sidual feed intake: Opportunity and challenges to application. J. Anim. Sci. 81(Suppl. 1):E9–E17.
Hilderbrand, G. V., S. D. Varley, C. T. Robbins, T. A. Hanley, K. Titus, and C. Servheen. 1996. Use of stable isotopes to deter-mine diets of living and extinct bears. Can. J. Zool. 74:2080– 2088. doi:10.1139/z96-236.
Kelly, A. K., M. McGee, and D. H. Crews. 2010. Effect of diver-gence in residual feed intake on feeding behavior, blood meta-bolic variables, and body composition traits in growing beef heifers. J. Anim. Sci. 88:109–123. doi:10.2527/jas.2009-2196. Koyama, M. 1985. Fractionation of nitrogen isotopes by domestic
animals. Jpn. J. Zootech. Sci. 56:361–362.
Lawrence, P., D. A. Kenny, and B. Earley. 2012. Grazed grass herbage intake and performance of beef heifers with pre-determined phenotypic residual feed intake classification. Animal 6:1648–1661. doi:10.1017/S1751731112000559. Lecomte, N., Ø. Ahlstrom, D. Ehrich, E. Fuglei, R. A. Ims, and N.
G. Yoccoz. 2011. Intrapopulation variability shaping isotope discrimination and turnover: Experimental evidence in Artic Foxes. PLoS One 6:E21357. doi:1371/journal.pone.0021357. Macko, S. A., M. L. Fogel, M. H. Engel, and P. E. Hare. 1986.
Kinetic fractionation of stable nitrogen isotopes during amino acid transamination. Geochim. Cosmochim. Acta 50:2143–2146. doi:10.1016/0016-7037(86)90068-2. Nicol, A. M., and I. M. Brookes. 2007. The metabolisable
ener-gy requirements of grazing livestock. In: P. V. Rattray, I. M. Brookes, and A. M. Nicol, editors, Pasture and supplements for grazing animals. Soc. Anim. Prod. Occasional Publication, Cambridge, NZ. p. 151–173.
Table 4. Correlation coefficients (rp; upper values) and P-values (lower values) between group means for feed conversion efficiency (FCE), plasma ∆15N, blood
∆15N, and wool ∆15N (mean; n = 4)
Item FCE Plasma ∆15N Blood ∆15N
Plasma ∆15N –0.995 0.005
Blood ∆15N –0.964
0.036 0.9610.039
Wool ∆15N –0.997
Rendell, M., C. Brannan, J. Nierenberg, K. Rasbold, and T. Hestorff. 1987. Fingerstick glycosylated hemoglobin, plasma protein, and albumin. Diabetes Care 10:629–632. doi:10.2337/dia-care.10.5.629.
Richardson, E. C., R. M. Herd, and J. A. Archer. 2004. Metabolic dif-ferences in Angus steers divergently selected for residual feed intake. Aust. J. Exp. Agric. 44:441–452. doi:10.1071/EA02219. Rogers, G. E., and A. C. Schlink. 2010. Wool growth and
pro-duction. In: D. J. Cottle, editor, International sheep and wool handbook. Nottingham Univ. Press, Christchurch, New Zealand. p. 373–394.
Sick, H., N. Roos, E. Saggau, K. Haas, V. Meyn, B. Walch, and N. Trugo. 1997. Amino acid utilization and isotope discrimination of amino nitrogen in nitrogen metabolism in rat liver in vivo. Z. Ernahrungswiss. 36:340–346. doi:10.1007/BF01617819.
Sponheimer, M., T. Robinson, L. Ayliffe, B. Roeder, J. Hammer, B. Passey, A. West, T. Cerling, D. Dearing, and J. Ehleringer. 2003. Nitrogen isotopes in mammalian herbivores: Hair δ15N
values from a controlled feeding study. Int. J. Osteoarchaeol. 13:80–87. doi:10.1002/oa.655.
Wattiaux, M. A., and J. D. Reed. 1995. Fractionation of nitrogen isotopes by mixed ruminal bacteria. J. Anim. Sci. 73:257–266. Wheadon, N. M., M. McGee, G. R. Edwards, and R. J. Dewhurst. 2014. Plasma nitrogen fractionation and feed efficien-cy in growing beef heifers. Br. J. Nutr. 111:1705–1711. doi:10.1017/S0007114513004078.