Abstract: We test whether public perceptions of Brian O’Driscoll’s greatness were accurate. O’Driscoll was an automatic selection for Ireland’s rugby team yet missed matches through injury, allowing us to treat injury as random. We estimate that O’Driscoll was worth a converted try per game and improved the chance of victory by more than home advantage. None of O’Driscoll’s Irish contemporaries made such a contribution. His impact also compares favourably with New Zealand’s best players of the era. Our estimates have implications for debates about wages in professional rugby. They also demonstrate how statistical techniques can be applied to an everyday issue, allowing us to conclude that perceptions of one Irishman’s greatness were warranted.
I INTRODUCTION
B
y common consent, Brian O’Driscoll is one of Ireland’s sporting greats. Measured in terms of caps, tries or trophies, his playing record is unsurpassed in the era of professional rugby. On retirement, O’Driscoll had broken the international record number of caps for an Irish player, scored the highest number tries for Ireland, and scored more tries than any other centre in world rugby. The public perception of O’Driscoll is that he was exceptional among all of his peers. In his latter years, perhaps having run out of adjectives, multiple members of the Irish press began referring to him simply as “the great one”.85
Are Perceptions of Greatness Accurate?
A Statistical Analysis of Brian O’Driscoll’s
Contribution to the Irish Rugby Team
Peter D. Lunn*
The Economic and Social Research Institute and Trinity College Dublin
David Duffy†
Property Industry Ireland
Acknowledgements: We thank David Byrne, Alan Barrett, Kieran McQuinn and an anonymous referee for helpful comments and feedback on earlier drafts. Since one author is a Dublin-based Englishman who has adopted Leinster, and the other is Irish and a Munster fan, any conflicts of interest have been internalised. * Corresponding author: [email protected]
Are these public perceptions biased or accurate? Just how good was Brian O’Driscoll? Among many Ireland fans, he was simply the greatest Irish rugby player of all time and on a par with any other player on the world stage. Yet, while his performances earned him international admiration and respect, many non-Irish rugby fans thought that Ireland fans were inclined to exaggerate about O’Driscoll’s brilliance, especially later in his career.1This is, of course, entirely plausible. In addition to the potential for bias due to national allegiance, several other biases documented in the experimental psychology literature might generate a tendency to inflate greatness. There is evidence that first impressions can colour later judgements, producing a so-called “halo effect” (Thorndike, 1920). Applied to sport, this effect implies that where a player bursts onto the scene with eye-catching performances, their subsequent contributions are likely to be judged too positively. Brian O’Driscoll captured widespread attention in his first international competitive tournament, the Six Nations of 2000, when he scored a hat-trick of tries in a victory against France in Paris. It is possible that such early success coloured later perceptions. A related phenomenon is “confirmation bias”, whereby ambiguous new evidence tends to be interpreted in line with prior beliefs (Nickerson, 1998). Thus, errors by a sportsperson believed to be of exceptional standard may be put down to extraneous circumstances rather than poor performance, while fortunate turns of events may be interpreted as further signs of sporting genius.
The present paper seeks an objective view. We take advantage of unusual properties of Brian O’Driscoll’s career, which allow us to avoid several of the usual pitfalls that afflict the measurement of sporting performance. We estimate O’Driscoll’s individual impact on three outcomes in relation to each match: the points difference, whether the match was won and the scale of victory or defeat (more or less than one score, i.e., seven points). For comparison, we also perform an equivalent analysis for two New Zealand players who are considered to be exceptional on the international stage during the same era: Dan Carter and Richie McCaw.
The primary purpose is to test whether public perceptions of greatness, at least in this case, are prone to exaggeration. A second aim is to contribute to the ongoing debate, in Ireland especially, about the economic value of rugby players in the professional era. Modern rugby faces difficult economic issues regarding how best to allocate revenues generated from gate receipts and television rights. It must find a balance between the freedom of players to earn due rewards for their skills, the desire for successful national teams, and the broader development of the game, in a context where larger and smaller nations tend to differ on the optimum allocation. Rugby authorities in some nations have capped wages and restricted the labour
1In the Northern Hemisphere see, for instance, “The Rolling Maul: pray for a rejuvenated Brian O’Driscoll”,
market mobility of players wishing to represent their countries. In this context, we provide what can be regarded as an estimate of the upper limit on the contribution of a single player to the team outcome. Lastly, the paper demonstrates how econometric techniques can be applied to everyday matters. Some may wish to argue that greatness, in sport and other walks of life, is and always will be a largely subjectiveconcept, beyond the reach of statistics. Here, we employ data gathered from publicly available sources to show that statistics can sometimes produce objectiveevidence even about such apparently subjective matters.
In sport, players are generally judged on their record. O’Driscoll won his first Ireland cap at age 20 in June 1999, on a tour of Australia. He was capped 133 times for Ireland, including 83 as captain (2003-2012) and four World Cups. He also won eight caps for the British and Irish Lions. He scored 46 tries for Ireland; the eighth-highest number in international rugby union history and the eighth-highest ever for a centre. Ireland’s primary competition is the Six Nations Championship. While O’Driscoll was captain, Ireland won the Triple Crown (beating England, Wales and Scotland in the same year) in 2004 (Ireland’s first since 1985), 2006 and 2007. In 2009, Ireland won the Triple Crown, the Six Nations Championship and their first Grand Slam (beating all five opponents) in 61 years. O’Driscoll was Player of the Tournament in 2006, 2007 and 2009. Considered overall, while this is a remarkable record and these are impressive facts, many of these statistics depend, in part, on factors other than individual performance: players can only win caps and score tries if selected; the likelihood of winning depends on the opposition, location and timing of matches; awards are made to individuals by subjective judgment; teams not individuals win trophies. Thus, O’Driscoll’s record, while impressive, does not necessarily provide a reliable measure of his individualcontribution.
There is an expanding academic literature, outlined briefly in the next section, that seeks more accurate measures of individual performance across sports. But accurate assessments of the contributions of individual players to team results generally elude academic researchers, because it is extremely difficult to quantify the contribution of a single player to the team outcome. An ideal test would compare the result of games, on average, when the individual player was in the team, with the average result when the specific individual was not in the team, all else equal. This would indicate the impact of the player on team outcomes, at least compared to whatever alternative player was available to fill their boots.
career, as their athletic abilities decline. Selection partly depends on current form and fitness, both of the player and others competing for the same shirt. Thus, differences between average outcomes when the player is and is not in the team depend, not simply on the contribution of the individual player, but also on selection decisions. In short, whether the player takes the field or not is endogenous.
In this context, however, Brian O’Driscoll’s career is highly unusual, because at all times during his 15-year international career O’Driscoll was an automatic choice. Although he was controversially dropped from the British and Irish Lions team for the last test of his final tour in 2013, O’Driscoll’s selection for Ireland was never questioned for internationals against top opposition.2When Ireland played in the Six Nations Championship, or against frontline opposition from the Southern Hemisphere, O’Driscoll was in the Ireland XV provided he was fit to play. Given the assumptions, first, that injury can be treated as random and, second, that his selection for Ireland was otherwise automatic, whether O’Driscoll took the field against frontline opposition might reasonably be treated as exogenous. If so, then comparing Ireland’s performance against frontline opposition when Brian O’Driscoll played with the team’s performance when he did not offers an unusual opportunity to generate a relatively accurate assessment of the impact of a single player in a team game.
There are of course limits to this argument. The statistical comparison offered is not a contrast of O’Driscoll against players in other positions alongside him, but against whoever had to fill his boots in his position of outside centre. This has the advantage that the effects we measure cannot be due to the quality of the Ireland team during the period, which is the same for O’Driscoll and his replacements. But if Ireland had a problem of strength in depth specific to the Number 13 shirt, then it could in principle inflate our estimates of O’Driscoll’s contribution. The specific problem would have to be enduring to bias estimates across his career, however, given its duration. We consider this argument further in Section 3. Another concern might be that injury is not an independent occurrence from match to match, but likely to be somewhat correlated with particular periods of a career or a team’s performance. This would make a similar analysis for England’s Jonny Wilkinson problematic, for instance, as injury forced him out of international rugby for four years in the middle of his career. O’Driscoll’s long career was dotted continually with injuries, however, without any period on the sidelines of more than five consecutive games.
These caveats imply that our estimates are not absolutely precise. This should be borne in mind when interpreting the results. We nevertheless contend that the
2Throughout his career, any references to O’Driscoll’s non-selection for the Ireland team put this down to
unusual nature of Brian O’Driscoll’s career offers a rare opportunity in the context of the sports economics literature to obtain a more accurate estimate than is generally possible of a single player’s contribution to a team game.
II METHODS AND DATA
Assessment of the contribution of individuals to team performance, while the subject of an expanding literature within sports economics, is limited by methodological concerns. Previous work is primarily focused on US sports such as baseball, basketball and ice hockey, although there is now a body of literature also dealing with European Soccer. A variety of methods is employed, but econometric issues of identification are more easily solved in some sports than in others. For instance, ice hockey and basketball players are rotated during games, so it is possible to measure the relative points differential when players are and are not on involved within the same game (e.g., Brander et al., 2014). Baseball is partly a team sport and partly an individual one, where individual hits, home runs and strike-outs provide ready metrics for players. In some other team sports there is extensive statistical information that isolates the role played by individual players. This is most feasible in sports such as basketball (Kubatko et al., 2007), where the primary contribution of each player involves a sequence of individual possessions of the ball, or of one-on-one defensive plays against an opposition player in possession. Although rugby makes increasing use of such statistics as carries, yards gained and tackle counts, many of these statistics cannot reasonably be used to compare players who operate in different positions. For instance, much of the work of a front row forward does not even involve touching the ball or an opposition player in possession of the ball. There are not performance measures for rugby, equivalent to those for say basketball, that identify the main role of players and measure how well they carry it out.
They included a variable for the presence of a star player, defined as an All Black (a New Zealand international) in the home or away team, and a specific variable for the presence of a particular player, Jonah Lomu. They found that the involvement of an All Black had a statistically significant positive effect on attendance, even after controlling for the home team’s success rate. They also estimated that Jonah Lomu added 20 per cent to match attendances during the period, but the analysis provided no estimate of what impact Lomu or other All Blacks had on the result. In an Irish context, Hoganet al.(2013) have examined influences on attendance at European professional club matches, finding that competitive balance had a positive effect but that the strength of the home team was more important. They did not consider the impact of individual players.
The method adopted in our analysis contrasts with these previous studies in that we concentrate on the ultimate outcome: whether the team wins or loses and by how much. This is only possible because Brian O’Driscoll’s selection was automatic for such a long period and was subject to fairly regular interruption through injury. Using a variety of statistical models, we regress the outcome of Ireland’s international matches between 1999 and 2014 against a dummy variable for whether O’Driscoll was playing, while controlling for other key variables, always including the opposition and whether the match was at home, away, or in a World Cup. Home advantage has previously been shown to have a substantial impact on match outcomes in the Six Nations Championship (Thomaset al., 2008). We model three different outcome variables: points difference, a binary win-loss variable and a categorical variable for the scale of the win or loss based on whether the margin was greater than one score.
Our dataset is constructed from player information provided publicly on the Irish Rugby Football Union website (www.irishrugby.ie) and results archived on the website of a broadcasting network (www.espnscrum.com). These sources provide a full set of team-lists and results for the Irish national rugby team for the years of O’Driscoll’s career. We include matches from the Six Nations tournament, the Rugby World Cup, Autumn Internationals and Summer Tours over this period. The Six Nations Championship is an annual competition between England, France, Ireland, Italy, Scotland and Wales. The Rugby World Cup is contested every four years between the top international teams. The Autumn Internationals and Summer Tours are mostly played against the Southern Hemisphere teams that play in the Rugby Championship, an annual competition contested by Argentina, Australia, New Zealand, and South Africa (which, prior to Argentina joining in the 2012 tournament, was known as the Tri Nations tournament). We define “frontline” opposition as the Six Nations teams and the four Rugby Championship teams.3
3Employing this definition, our assumption that O’Driscoll was an automatic choice against frontline
Our first observation is from February 6, 1999, the start of the Six Nations campaign during the year of O’Driscoll’s international debut, while our final observation is March 15, 2014, which was his final appearance in an Ireland jersey. Of the 173 Irish internationals that took place during this period, O’Driscoll was in the starting XV for 132 (he has just one cap as a substitute, against Romania in 1999). Absences through injury were spread across his career, with his two longest spells on the sidelines in 2005 and 2012, causing him to miss at least one international against all frontline opposition teams. These two properties assist in estimating his contribution. More problematic is that O’Driscoll played every World Cup match against frontline opposition, so Ireland’s performances specifically in World Cups are somewhat harder to disentangle from his personal contribution. One minor difficulty in the data, given the need to control for the effect on the outcome of the quality of the opposition, is that Ireland played only a single game during the period against Tonga and also a single game against a combined Pacific Islands team. We deal with this by combining Fiji, Samoa, Tonga and the Pacific Islands into a single opposition category. The results we report are not sensitive to this approximation, to how the World Cup games are categorised, or to the inclusion or exclusion of specific matches near the start or end of the period in question.
III COMPARISON WITH IRISH PEERS
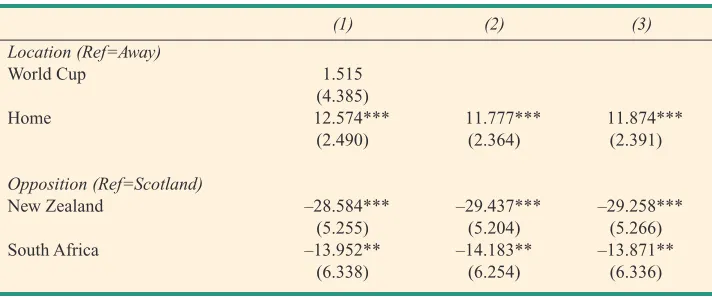
The mean points difference against all opposition from 1999-2014 was 6.3 points in Ireland’s favour (sd. 22.6). Table 1 presents initial results of ordinary least squares (OLS) regressions where the dependent variable is the points difference in all Ireland internationals. This is not the most accurate way to assess Brian O’Driscoll’s contribution, as he was rested for some games against lower ranked teams, but it serves as a first estimate and helps to highlight key aspects of Ireland’s overall performance. It is notable also that these simple OLS models comfortably account for the majority of the variation in the outcome variable.
The base model (Column 1) shows that Ireland’s points difference was 12-13 points better when playing at home than when playing away (the reference category). A World Cup encounter is (usually) not a home fixture for either side. Thus, assuming that Ireland’s relative performance in World Cups was the same as in other matches, the coefficient on World Cup games ought to be positive compared to the reference category of away games. Our model in fact suggests that the outcome of World Cup matches was no better than the outcome of away matches. This result therefore supports the perception that Ireland has tended to underperform in World Cups.
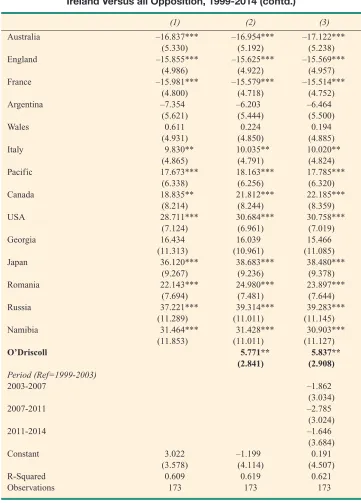
Scotland,4which corresponds to an estimated three-point advantage playing away from home (the constant at the bottom of Table 1), or 15-16 points when the coefficient for a home game is factored in. Playing against South Africa, Australia, England or France during this period produced a 13-17 point disadvantage relative to playing against Scotland. Thus, adding these coefficients to the constant and home game coefficients, we estimate that Ireland experienced near parity in home fixtures against these four sides, but a distinct disadvantage away from home. The effect of playing New Zealand, at minus 29 points, stands apart. Similarly, the model suggests that against Argentina and Wales, Ireland had a clear advantage at home, but had fairly even games when playing away. Against all lower-ranked opposition, Ireland had a clear points advantage.
Column (2) introduces the variable for whether Brian O’Driscoll was playing. Given that there is no differential relative to away games and the fact that O’Driscoll was not injured during a World Cup, the World Cup games are pooled with away games. The model estimates that O’Driscoll made a statistically significant impact of almost six points per game. The final model (Column 3) introduces a control variable for when matches were played, breaking 1999-2014 up into four periods bookended by three World Cups (2003, 2007, 2011). This shows no statistically significant variation in the performance of the Irish team between these periods. The other coefficients of the model are also unaffected by controlling for period.5
4The choice of reference category does not alter the results, only ease of interpretation. Scotland was chosen
because it produces the smallest constant term in the model, making it easier to interpret the coefficients for other countries.
5In addition, we tested models that included dummy variables for the period when O’Driscoll was Ireland
captain and for the identity of the Ireland coach. Neither affected the results significantly, so the remaining models in the paper are presented without these controls.
Table 1: OLS Regressions for the Determinants of Points Difference, Ireland Versus all Opposition, 1999-2014
(1) (2) (3)
Location (Ref=Away)
World Cup 1.515
(4.385)
Home 12.574*** 11.777*** 11.874***
(2.490) (2.364) (2.391)
Opposition (Ref=Scotland)
New Zealand –28.584*** –29.437*** –29.258***
(5.255) (5.204) (5.266)
South Africa –13.952** –14.183** –13.871**
Table 1: OLS Regressions for the Determinants of Points Difference, Ireland Versus all Opposition, 1999-2014 (contd.)
(1) (2) (3)
Australia –16.837*** –16.954*** –17.122***
(5.330) (5.192) (5.238)
England –15.855*** –15.625*** –15.569***
(4.986) (4.922) (4.957)
France –15.981*** –15.579*** –15.514***
(4.800) (4.718) (4.752)
Argentina –7.354 –6.203 –6.464
(5.621) (5.444) (5.500)
Wales 0.611 0.224 0.194
(4.931) (4.850) (4.885)
Italy 9.830** 10.035** 10.020**
(4.865) (4.791) (4.824)
Pacific 17.673*** 18.163*** 17.785***
(6.338) (6.256) (6.320)
Canada 18.835** 21.812*** 22.185***
(8.214) (8.244) (8.359)
USA 28.711*** 30.684*** 30.758***
(7.124) (6.961) (7.019)
Georgia 16.434 16.039 15.466
(11.313) (10.961) (11.085)
Japan 36.120*** 38.683*** 38.480***
(9.267) (9.236) (9.378)
Romania 22.143*** 24.980*** 23.897***
(7.694) (7.481) (7.644)
Russia 37.221*** 39.314*** 39.283***
(11.289) (11.011) (11.145)
Namibia 31.464*** 31.428*** 30.903***
(11.853) (11.011) (11.127)
O’Driscoll 5.771** 5.837** (2.841) (2.908)
Period (Ref=1999-2003)
2003-2007 –1.862
(3.034)
2007-2011 –2.785
(3.024)
2011-2014 –1.646
(3.684)
Constant 3.022 –1.199 0.191
(3.578) (4.114) (4.507)
R-Squared 0.609 0.619 0.621
Observations 173 173 173
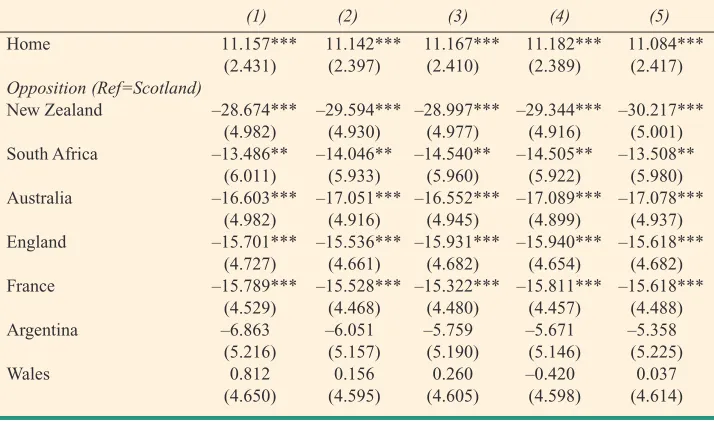
Table 1 may not offer an accurate picture of O’Driscoll’s contribution, because he was not automatically selected (unless injured) against lower-ranked sides. This selection effect is likely to result in an underestimate of his contribution per game against all opposition, because he may have been more likely to be picked against the stronger lower-ranked teams. Table 2 instead limits the analysis to the 141 matches against frontline opposition only and provides other tests of the robustness of our estimate of O’Driscoll’s contribution.
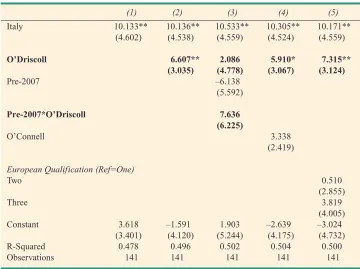
Because in this case O’Driscoll was an automatic pick, except when injured, this analysis gives a better estimate of his impact per game, albeit a different one, because it is probably easier to make a larger impact on the points difference when playing against lower-ranked sides. That is, the estimate is more accurate, but corresponds to a measure of the player’s impact when playing against frontline teams. Column 1 of Table 2 confirms the effects of home advantage and opposition discussed above. Column 2 indicates that O’Driscoll was worth 6.6 points per game against frontline opposition. One simple way to think of this, given the probability of a successful conversion kick, is that against the best teams in the world, Brian O’Driscoll was essentially worth one converted try per game to Ireland.
It is often asserted that O’Driscoll’s impact declined with age, as his game changed. Column 3 tests this. The O’Driscoll coefficient is interacted with a dummy variable for whether the match was prior to the end of the 2007 World Cup. The size of the O’Driscoll coefficient is smaller for later in his career, but the interaction is not statistically significant. Hence this particular model does not resolve the issue either way.
We also tested to see whether conducting this same analysis for other prominent Irish players during the period produced the same results. This is not an entirely fair test, since they were not automatic selections. To the extent that they were more likely to be picked during periods of good form, the selection effect is most likely to bias the coefficient for other players upwards relative to the estimate for O’Driscoll, which includes times when he was on both better and worse form, by his standards. We tested individually all Irish players who had been selected for the British and Irish Lions during the period, provided they also had more than 40 Ireland caps, and all those never picked for the Lions who had more than 70 caps.6 In our models, no other Irish player had a statistically significant effect on points difference. Example output is given in Column 4 for Paul O’Connell, the other player closest to an automatic selection for frontline games during this period, unless injured. Our estimate is that O’Connell was worth around three points per game, but the effect is not statistically significant. It is of course possible that it is harder
6The players tested were: Paul O’Connell, John Hayes, Peter Stringer, Ronan O’Gara, Shane Horgan, Denis
to make a measurable individual impact in one position than in another. This could be particularly true of forwards, who operate as a “pack”. Nevertheless, the players we tested covered almost every position on the pitch. Furthermore, the addition of other top players from the period to our model did not alter the coefficient on O’Driscoll substantively.
Lastly, we would ideally like to control for variability in the quality of the rest of the team. To some extent the introduction of variables for the presence of other prominent players achieves this, but it is not ideal given the potential for selection biases. As a final robustness check, therefore, Column 5 introduces a variable designed to capture season-on-season fluctuations in the quality and form of the Irish player pool that made up the national side. This variable corresponds to the number of Irish provinces during the season concerned that qualified for the quarter-final stages of rugby’s premier European clubs competition, and it varies between one and three. Since the overwhelming majority of the Irish team during these years played for Ireland’s domestic provincial teams, this provides a good proxy for year-on-year changes in team quality relative to prevailing international standards. When this variable is added to the model, the coefficient has the expected positive sign but is not statistically significant (although see the later analysis in Table 4). The coefficient on O’Driscoll, meanwhile, actually increases to more than seven points once team quality is controlled for in this way.7
7We also tried dummy variables for different coaches of the Ireland team during the period. These were not
significant and had negligible impact on the O’Driscoll coefficient.
Table 2: OLS Regressions for the Determinants of Points Difference Against Frontline Opposition, 1999-2014
(1) (2) (3) (4) (5)
Home 11.157*** 11.142*** 11.167*** 11.182*** 11.084***
(2.431) (2.397) (2.410) (2.389) (2.417) Opposition (Ref=Scotland)
New Zealand –28.674*** –29.594*** –28.997*** –29.344*** –30.217*** (4.982) (4.930) (4.977) (4.916) (5.001) South Africa –13.486** –14.046** –14.540** –14.505** –13.508**
(6.011) (5.933) (5.960) (5.922) (5.980) Australia –16.603*** –17.051*** –16.552*** –17.089*** –17.078***
(4.982) (4.916) (4.945) (4.899) (4.937) England –15.701*** –15.536*** –15.931*** –15.940*** –15.618***
(4.727) (4.661) (4.682) (4.654) (4.682) France –15.789*** –15.528*** –15.322*** –15.811*** –15.618***
(4.529) (4.468) (4.480) (4.457) (4.488)
Argentina –6.863 –6.051 –5.759 –5.671 –5.358
(5.216) (5.157) (5.190) (5.146) (5.225)
Wales 0.812 0.156 0.260 –0.420 0.037
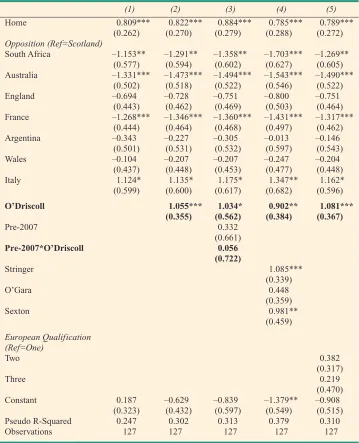
Points difference is only one outcome variable of potential interest. In most circumstances, whether the team wins or loses is more important than the winning or losing margin. Table 3 presents a similar analysis to that carried out in Table 2, except that the results derive from probit models for whether Ireland won the match. The analysis is limited to frontline opposition only. New Zealand unfortunately has to be excluded from this analysis because Ireland failed to beat them in any games. Column 1 reports similar effects of home advantage and opposition on the prob -ability of winning as reported above for the points differential. The introduction of the O’Driscoll variable, however, leads to a different and striking result. Not only was O’Driscoll’s contribution to the probability that Ireland won highly statistically significant (p < 0.01), it is estimated to have been greater than home advantage.
It is common when interpreting the coefficients of probit models to report marginal effects that estimate the percentage difference made to the probability of a positive outcome associated with a one unit increase in each independent variable, with other independent variables held at their mean value. This conventional approach would not be very instructive in this case, because of the large differences
Table 2: OLS Regressions for the Determinants of Points Difference Against Frontline Opposition, 1999-2014 (contd.)
(1) (2) (3) (4) (5)
Italy 10.133** 10.136** 10.533** 10.305** 10.171**
(4.602) (4.538) (4.559) (4.524) (4.559)
O’Driscoll 6.607** 2.086 5.910* 7.315** (3.035) (4.778) (3.067) (3.124)
Pre-2007 –6.138
(5.592)
Pre-2007*O’Driscoll 7.636 (6.225)
O’Connell 3.338
(2.419)
European Qualification (Ref=One)
Two 0.510
(2.855)
Three 3.819
(4.005)
Constant 3.618 –1.591 1.903 –2.639 –3.024
(3.401) (4.120) (5.244) (4.175) (4.732)
R-Squared 0.478 0.496 0.502 0.504 0.500
Observations 141 141 141 141 141
in the probability of winning against different opposition teams.8Instead, we made additional calculations based on the coefficients in Column 2 to indicate how O’Driscoll’s presence affected this spread of probabilities. These calculations show that home advantage increased the chance of Ireland winning by 8-32 percentage points, depending on the opposition, but that the presence of Brian O’Driscoll in the starting line-up increased it by 13-40 percentage points. Given that he is just one player among 30 on the pitch, this a remarkable finding.
Furthermore, when we test for whether O’Driscoll’s impact was affected by the stage in his career (Column 3), we find this time that there is almost no change at all in his estimated impact pre- and post-2007. This result holds if we break his career at other points (e.g., pre- and post-2010) or if a continuous (linear or non-linear) time trend is used. We conclude that while it is possible from the earlier results that O’Driscoll’s influence on the points difference in games declined later in his career, there was effectively no change with respect to his seemingly larger (at least in comparison with home advantage) contribution to whether Ireland won or lost the match. He appears, therefore, to have been most effective in close games and to have remained so throughout his career.
In contrast with the points differential models, the win-loss models in Table 3 do reveal significant effects associated with two other players whose careers overlap with O’Driscoll’s: Peter Stringer and Jonathan Sexton. Both players produce statistically significant coefficients of similar magnitudes to O’Driscoll. In Sexton’s case, the effect is statistically significant only relative to fly halves other than Ronan O’Gara. (We use a three-category variable for the fly-half position because Sexton and O’Gara account for such high proportions of games). It should be borne in mind that these coefficients may be biased upwards somewhat by selection effects. Stringer and Sexton were not selected for the international team for long durations of the period covered, despite playing for their clubs, so their coefficients are likely to relate to times when they were playing better than at other periods during their careers. Nevertheless, that two half-backs (scrum-half or fly-half) emerge as significant contributors is unlikely to be a coincidence. It is in keeping with the prevailing wisdom in rugby that these two positions probably matter more than other positions. The coefficients may therefore partly reflect the importance of being able to select first choice half-backs as much as how the individuals concerned compare with others competing for the shirt. Alternatively, it may be that the qualities of these two players in tight games have been underappreciated, but there is no way to test this with the available data. Lastly, Column 5 again shows that the estimated influence of O’Driscoll is not diminished by the introduction of a variable
8The spread arises because the impact is largest for games that are closest to a 50 per cent chance of victory.
intended to capture the general season-by-season form and/or quality of Ireland’s player pool. The coefficients on this variable are again positive but not statistically significant.
Table 3: Probit Regressions for the Determinants of Victory Against Frontline Opposition, 1999-2014
(1) (2) (3) (4) (5)
Home 0.809*** 0.822*** 0.884*** 0.785*** 0.789***
(0.262) (0.270) (0.279) (0.288) (0.272) Opposition (Ref=Scotland)
South Africa –1.153** –1.291** –1.358** –1.703*** –1.269** (0.577) (0.594) (0.602) (0.627) (0.605) Australia –1.331*** –1.473*** –1.494*** –1.543*** –1.490***
(0.502) (0.518) (0.522) (0.546) (0.522)
England –0.694 –0.728 –0.751 –0.800 –0.751
(0.443) (0.462) (0.469) (0.503) (0.464) France –1.268*** –1.346*** –1.360*** –1.431*** –1.317***
(0.444) (0.464) (0.468) (0.497) (0.462)
Argentina –0.343 –0.227 –0.305 –0.013 –0.146
(0.501) (0.531) (0.532) (0.597) (0.543)
Wales –0.104 –0.207 –0.207 –0.247 –0.204
(0.437) (0.448) (0.453) (0.477) (0.448)
Italy 1.124* 1.135* 1.175* 1.347** 1.162*
(0.599) (0.600) (0.617) (0.682) (0.596)
O’Driscoll 1.055*** 1.034* 0.902** 1.081*** (0.355) (0.562) (0.384) (0.367)
Pre-2007 0.332
(0.661)
Pre-2007*O’Driscoll 0.056 (0.722)
Stringer 1.085***
(0.339)
O’Gara 0.448
(0.359)
Sexton 0.981**
(0.459)
European Qualification (Ref=One)
Two 0.382
(0.317)
Three 0.219
(0.470)
Constant 0.187 –0.629 –0.839 –1.379** –0.908
(0.323) (0.432) (0.597) (0.549) (0.515)
Pseudo R-Squared 0.247 0.302 0.313 0.379 0.310
Observations 127 127 127 127 127
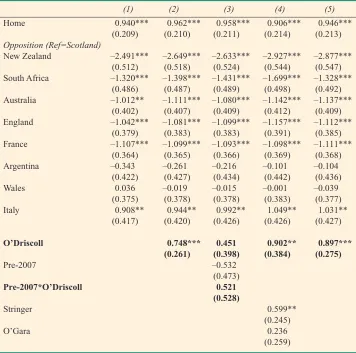
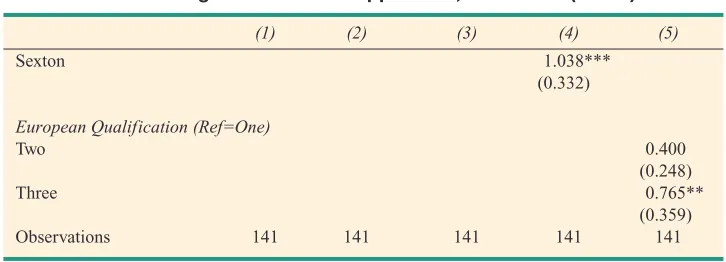
It is not ideal that the analysis in Table 3 excludes 14 matches against New Zealand, since performance against the world’s leading team is an important part of overall performance. Consequently, we conducted a final set of ordered probit regressions where the dependent variable had four categories: lost by more than one score (7 points), lost by less than one score (or drew), won by less than one score, won by more than one score. Effectively, therefore, this model is also a measure of performance in tight matches, including against consistently the best team in the world. Ireland ran New Zealand close more than once, producing variation in the dependent variable. The results of these regressions are given in Table 4.
Table 4: Ordered Probit Regressions for the Determinants of Broad Outcome Against Frontline Opposition, 1999-2014
(1) (2) (3) (4) (5)
Home 0.940*** 0.962*** 0.958*** 0.906*** 0.946***
(0.209) (0.210) (0.211) (0.214) (0.213) Opposition (Ref=Scotland)
New Zealand –2.491*** –2.649*** –2.633*** –2.927*** –2.877*** (0.512) (0.518) (0.524) (0.544) (0.547) South Africa –1.320*** –1.398*** –1.431*** –1.699*** –1.328***
(0.486) (0.487) (0.489) (0.498) (0.492) Australia –1.012** –1.111*** –1.080*** –1.142*** –1.137***
(0.402) (0.407) (0.409) (0.412) (0.409) England –1.042*** –1.081*** –1.099*** –1.157*** –1.112***
(0.379) (0.383) (0.383) (0.391) (0.385) France –1.107*** –1.099*** –1.093*** –1.098*** –1.111***
(0.364) (0.365) (0.366) (0.369) (0.368)
Argentina –0.343 –0.261 –0.216 –0.101 –0.104
(0.422) (0.427) (0.434) (0.442) (0.436)
Wales 0.036 –0.019 –0.015 –0.001 –0.039
(0.375) (0.378) (0.378) (0.383) (0.377)
Italy 0.908** 0.944** 0.992** 1.049** 1.031**
(0.417) (0.420) (0.426) (0.426) (0.427)
O’Driscoll 0.748*** 0.451 0.902** 0.897*** (0.261) (0.398) (0.384) (0.275)
Pre-2007 –0.532
(0.473)
Pre-2007*O’Driscoll 0.521 (0.528)
Stringer 0.599**
(0.245)
O’Gara 0.236
Table 4: Ordered Probit Regressions for the Determinants of Broad Outcome Against Frontline Opposition, 1999-2014 (contd)
(1) (2) (3) (4) (5)
Sexton 1.038***
(0.332)
European Qualification (Ref=One)
Two 0.400
(0.248)
Three 0.765**
(0.359)
Observations 141 141 141 141 141
Standard errors in parentheses, *** p<0.01, ** p<0.05, * p<0.1.
The coefficients are broadly similar to those above. In this case the O’Driscoll effect is slightly below that of home advantage (Column 2) and is again not significantly reduced across his career (Column 3). Peter Stringer and Jonathan Sexton are again the only other players to have a statistically significant impact (Column 4), albeit that the coefficient on Stringer is lower than in Table 3. In this model, Sexton’s impact is statistically significant compared to all other fly halves. Lastly, in Column (5) the coefficient on O’Driscoll again increases marginally when a control variable is added for the performance of the Irish provinces in Europe. The coefficients for this variable are again positive and on this occasion the relationship is statistically significant. This suggests that the Irish national team receives a boost when Ireland’s provinces are performing well, in line with our assumption that provincial performance is a measure of the quality and/or form of the Ireland team’s player pool.
IV INTERNATIONAL COMPARISON
The analysis undertaken thus far provides good statistical evidence that Brian O’Driscoll stood out among his peers in Ireland, which supports the public perception that O’Driscoll was a truly exceptional rugby player. A difference of six or seven points per game and a greater impact on match outcomes than home advantage would strike any rugby fan as a remarkable level of performance, especially measured across such a long career. Nevertheless, this is arguably insufficient to establish O’Driscoll’s status on the world rugby stage, since it is possible that the impact of the very best players in international rugby was greater. An international measure of performance is required.
During the same era, the performances of two particular international rugby players were extraordinary by both objective and subjective standards. Dan Carter and Richie McCaw, both of New Zealand (the “All Blacks”), were the most prominent players in a team that won a higher proportion of international matches and trophies than any other. Carter and McCaw won the World Rugby Player of the Year award three times each in the 11 years from 2005 to 2015 – the only two players to have won the award more than once. To compare O’Driscoll’s performance with these two players is to hold him up to the highest international standard.
Ideally, the players on which to base an international comparison would, like O’Driscoll, have been automatic choices for their country throughout their careers. This is not quite true for Carter and McCaw, who both required a year or two to establish themselves in the All Blacks side (with Carter playing at centre rather than his preferred fly-half position in early years). Both players were also used as substitutes more often than O’Driscoll. However, the results that we report are robust to altering the time-frame covered and to the classification of appearances as substitutes.
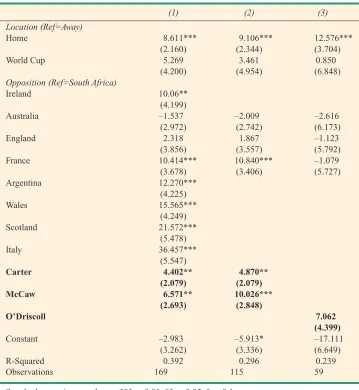
We compiled a full set of team-lists and results for New Zealand’s international rugby matches for the period 2001-2015, using www.allblacks.com and www.espnscrum.com as sources. We then employed the same methods as described above in the case of O’Driscoll to estimate the individual contribution of Dan Carter and Richie McCaw, controlling for the location of the match and the opposition. Table 5 reports OLS regressions in which the dependent variable is the points difference. Column (1) is based on New Zealand’s results against frontline opposition as defined above.9Only in games played away from home against South Africa and Australia is the estimated overall points difference negative (as indicated
9A full model based on results against all teams is not reported. The estimated impact of Carter and McCaw
by the signs of the coefficients for Australia and the Constant in the model, since South Africa is the reference opposition category). The estimated impacts of Dan Carter and Richie McCaw are both positive and statistically significant. The estimate of between six and seven points for McCaw is similar to that estimated for O’Driscoll against the same teams (Table 2, Column 2). The estimate for Carter is somewhat lower.
Table 5: OLS Regressions for the Determinants of Points Difference Against Frontline Opposition, Comparing Dan Carter, Richie McCaw and
Brian O’Driscoll
(1) (2) (3)
Location (Ref=Away)
Home 8.611*** 9.106*** 12.576***
(2.160) (2.344) (3.704)
World Cup 5.269 3.461 0.850
(4.200) (4.954) (6.848)
Opposition (Ref=South Africa)
Ireland 10.06**
(4.199)
Australia –1.537 –2.009 –2.616
(2.972) (2.742) (6.173)
England 2.318 1.867 –1.123
(3.856) (3.557) (5.792)
France 10.414*** 10.840*** –1.079
(3.678) (3.406) (5.727)
Argentina 12.270***
(4.225)
Wales 15.565***
(4.249)
Scotland 21.572***
(5.478)
Italy 36.457***
(5.547)
Carter 4.402** 4.870** (2.079) (2.079) McCaw 6.571** 10.026***
(2.693) (2.848)
O’Driscoll 7.062 (4.399)
Constant –2.983 –5.913* –17.111
(3.262) (3.336) (6.649)
R-Squared 0.392 0.296 0.239
Observations 169 115 59
One striking feature of the model in Column 1 is the very large points differentials that New Zealand typically enjoyed against the weaker frontline teams during the period, especially Scotland and Italy. Since we are more interested in performance when games are in the balance than when they are safely won, as a robustness check we estimated the model for matches against only the four teams that beat the All Blacks at least once during the period: Australia, England, France and South Africa. The results are presented in Column 2. The contributions of both players are again statistically significant. The estimated coefficient for Dan Carter is five points per game, while for Richie McCaw it climbs to an impressive ten points. In relation to the argument about positions above, therefore, it is clearly possible for a forward to have a measurable individual impact, since McCaw was a wing-forward.10However, given the standard errors on these point estimates, a test for equal coefficients between Carter and McCaw marginally fails to reject the null hypothesis that the two coefficients are equal. That is, while our best estimates are that McCaw was worth ten points and Carter five, we cannot conclude that McCaw’s additional contribution, over and above Carter, was statistically significant.
The equivalent model for Brian O’Driscoll is shown in Column 3. Note that because Ireland played fewer matches against these four teams, the standard error on O’Driscoll’s coefficient is higher than in previous models and, hence, the coefficient ceases to be statistically significant. Nevertheless, the estimate of over seven points compares well with the two All Blacks.
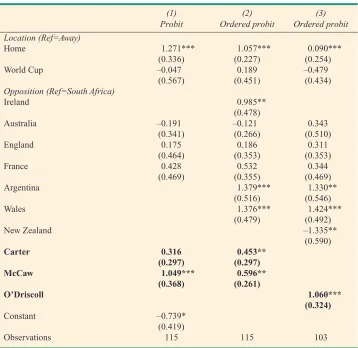
Table 6 provides a probit model for the likelihood of victory and ordered probit models for the broad outcome of the match, as in the previous section. Only matches against the same four teams can be included in the probit model in Column 1, because New Zealand always beat every other team. The model implies that Richie McCaw had a statistically significant impact on the likelihood of winning, but that Dan Carter did not. McCaw’s impact approaches but is somewhat less than that of home advantage. The coefficient on McCaw is very similar to that recorded for O’Driscoll against frontline opposition (Table 3). Unfortunately, it is not possible to compare the completely analogous probit models for the two players. This is because, strikingly, Ireland lost to these four nations on every occasion that O’Driscoll was unavailable during his career.
A closer comparison is possible through the ordered probits presented in Columns 2 and 3. Because New Zealand always beat Scotland and Italy by more than seven points, the analysis is limited to the frontline teams minus these two. The coefficient for Richie McCaw is again higher than that for Dan Carter, but this time it is a closer call. Both are well short of the effect of home advantage. The estimated impact of Brian O’Driscoll is higher and greater than home advantage. 10It might still be argued that it is more difficult for a “front five” forward to make a measurable individual
Taken as a whole, the results in this section show that the contribution Brian O’Driscoll made to the outcome of Ireland’s matches compares well with the contributions made to the outcome of New Zealand’s matches by the two most decorated international rugby players of the era, Dan Carter and Richie McCaw. All estimates for McCaw and O’Driscoll are somewhat ahead of those for Carter, although in no single case is this difference statistically significant. The highest estimate with respect to points difference belongs to McCaw, but the highest estimate with respect to the broad outcome of the match belongs to O’Driscoll. The evidence is that these great players were superior to those around them, but perhaps not to each other.
Table 6: Probit and Ordered Probit Regressions for the Determinants of Victory and Broad Outcome Respectively, Comparing Dan Carter,
Richie McCaw and Brian O’Driscoll
(1) (2) (3)
Probit Ordered probit Ordered probit
Location (Ref=Away)
Home 1.271*** 1.057*** 0.090***
(0.336) (0.227) (0.254)
World Cup –0.047 0.189 –0.479
(0.567) (0.451) (0.434)
Opposition (Ref=South Africa)
Ireland 0.985**
(0.478)
Australia –0.191 –0.121 0.343
(0.341) (0.266) (0.510)
England 0.175 0.186 0.311
(0.464) (0.353) (0.353)
France 0.428 0.532 0.344
(0.469) (0.355) (0.469)
Argentina 1.379*** 1.330**
(0.516) (0.546)
Wales 1.376*** 1.424***
(0.479) (0.492)
New Zealand –1.335**
(0.590)
Carter 0.316 0.453** (0.297) (0.297) McCaw 1.049*** 0.596**
(0.368) (0.261)
O’Driscoll 1.060*** (0.324)
Constant –0.739*
(0.419)
Observations 115 115 103
V DISCUSSION
To the extent that statistics can test for greatness in sport, our analysis suggests that Brian O’Driscoll passes that test comfortably. Consequently, public perceptions of his greatness pass the test also. It does not appear that Irish rugby fans were prone to exaggeration or to a “halo effect”.
Our statistical models estimate that against frontline opposition O’Driscoll was worth a converted try per game to Ireland. Given that more than one-third of such matches from 1999-2014 were won or lost by less than seven points, this is an immense contribution from a single player. However, the contribution of a player is not simply the number of points, because points are worth more when they are to win the match than when they are merely to add icing on the cake of a comfortable victory. The ultimate impact of a player’s presence on the pitch is how it affects the likelihood that the team wins the match. On this measure, our models suggest that Ireland benefitted more from O’Driscoll being in the team than from playing at home. Depending on the opposition, he increased the probability of victory by 13-40 percentage points. Furthermore, O’Driscoll’s impact on the points differential and on the probability of Ireland winning are not merely impressively large in absolute terms, but compare favourably with equivalent measures for the two most decorated international players of the professional era, Dan Carter and Richie McCaw.
One possible interpretation of our main findings, including perhaps the consistency throughout his career of O’Driscoll’s impact on close games, is the player’s effect on the performance of teammates. McMillan (1997) argues that a star player can make surrounding teammates play better. If so, an improvement in team outcomes may reflect more than just the star player’s direct involvement in terms of physical skills. We have no way to test this proposition with present data, although it seems reasonable to propose that such an impact on teammates should be considered part of what makes a great player, rather than an alternative explanation for the player’s impact.
will not translate directly into revenue, the correlation is likely to be strong. Better home teams generate higher gate receipts (Hogan et al., 2013). Winning teams have higher probabilities of qualification for competitions that generate television revenue and for lucrative additional knock-out matches. Thus, for a professional rugby club, engaging a player’s services has increasingly become a calculation of investment and return. In the labour markets of other professional team sports, there is evidence consistent with owners and coaches suffering from “winner’s curse” (Blecherman and Camerer, 1996; Massey and Thaler, 2012). That is, the degree of uncertainty over the contributions of single players results in the highest bidders for top players being clubs that overestimate their value.
In this context, our analysis provides the first published statistical estimates of the contribution that one top-class player can make to the outcome of a rugby match. We would argue that the estimates approximate the upper limit on this contribution over an extended period. The figures for Brian O’Driscoll are the largest we recorded among more than 20 top players from one frontline nation over 15 years. When considering the return on an investment in a rugby player, these figures are unlikely to be beaten.11Our analysis also provides suggestive evidence that position matters. Despite the impressive estimates for O’Driscoll and Richie McCaw, the models support the view that half-backs occupy particularly pivotal positions for the outcomes of games.
There are doubtless subjective elements to sporting greatness; different people may have different views of what constitutes it. Greatness might be enhanced or undermined by how a player rates on many characteristics, including skill, entertainment, winning, longevity, integrity, competitiveness, bravery, sporting conduct, and so on. One absolutely clear requirement, however, is that the player is exceptional. Although our analysis is limited by the available data, it provides quantitative evidence that the contribution Brian O’Driscoll made to the success of Ireland’s rugby team from the time he debuted in 1999 was, indeed, exceptional.
Perceptions are not infallible and biased perspectives are not uncommon. There is merit, therefore, in objective analysis that compares perception and judgement with statistical reality. In this case, the view that Brian O’Driscoll stood out among all his peers seems to be warranted.
11While our analysis is of international rather than club matches, across the models we estimated that the
REFERENCES
Blecherman, B. and C. F. Camerer, 1996. Is There a Winner’s Curse in the Market for Baseball Players? Evidence From The Field. CalTech Social Science Working Paper 966.
Brander, J. A., E. J. Egan and L.Yeung, 2014. “Estimating the Effects of Age on NHL Player Performance”, Journal of Quantitative Analysis in Sports, Vol. 10, pp. 241-259.
Hogan, V., P. Massey and S. Massey, 2013. “Competitive Balance and Match Attendance in European Rugby Union Leagues”, The Economic and Social Review, Vol. 44, pp. 425-446.
Kubatko, J., D. Oliver, K. Pelton and D. T. Rosenbaum, 2007. “A Starting Point for Analysing Basketball Statistics”, Journal of Quantitative Analysis in Sports, Issue 3 (online).
Massey C. and Richard H. Thaler, 2012. The Loser’s Curse: Decision-Making and Market Efficiency in the National Football League Draft, SSRN Working Paper 697121.
McMillan, J., 1997. “Rugby Meets Economics”, New Zealand Economic Papers, Vol. 31, pp. 93-144. Nickerson, R. S., 1998. “Confirmation Bias: A Ubiquitous Phenomenon in Many Guises”, Review of
General Psychology, Vol. 2, pp. 175-220.
Owen, P. D. and C. R. Weatherspoon, 2004. “Uncertainty of Outcome, Player Quality and Attendance at National Provincial Championship Rugby Union Matches: An Evaluation in Light of the Competitions Review”, Economic Papers,Vol. 23, pp. 301-324.
Scully, G. W., 1974. “Pay and Performance in Major League Baseball”, American Economic Review, Vol. 64, pp. 915-930.
Thomas, S., C. Reeves and A. Bell, 2008. “Home Advantage in the Six Nations Rugby Union Tournament”, Perceptual and Motor Skills, Vol. 106, pp. 113-116.