Iran J Public Health, Vol. 47, No.11, Nov 2018, pp.1688-1693
Original Article
Optimal Function Prediction of Key Aberrant Genes in
Early-onset Preeclampsia Using a Modified Network-based Guilt
by Association Method
*Jing WANG
1, Yanping BI
1, Junxia LI
1, Yanfang TIAN
1, Xue YANG
2, Zhongfang
SUN
11. Dept. of Obstetrics, Seventh People's Hospital of Jinan, Jiyang, Shandong, China 2. Dept. General Surgery, Seventh People's Hospital of Jinan, Jiyang, Shandong, China
*Corresponding Author: Email: [email protected]
(Received 16 Oct 2017; accepted 08 Dec 2017)
Introduction
Early-onset preeclampsia (EOPE) is a human-pregnancy-specific disease and it complicates ap-proximately 4‰ pregnancies in nulliparous women worldwide and is a significant source of maternal and neonatal morbidity and mortality (1-3). Compared with mothers without preeclampsia, there is a 10-fold higher risk of per-inatal death observed among mothers with
EO-PE while a 2-fold increased risk evident with the late-onset disease (4). Most of maternal and fetal deaths are due to lack of prenatal care, inappro-priate diagnosis and management of patients with EOPE. Therefore, in order to safely prolong the preterm gestation, it is necessary for us to explore the pathogenesis and make accurate and timely diagnosis.
Abstract
Background: To predict the optimal functions of key aberrant genes in early-onset preeclampsia (EOPE) by
using a modified network-based gene function inference method.
Methods: First, differentially expressed genes (DEGs) were extracted using linear models for microarray data
(LIMMA) package. Then the Spearman's rank correlation coefficient was calculated to assess co-expressed strength of each interaction between DEGs, based on which the co-expressed genes network was constructed to vividly exhibit their interlinking relationship. Subsequently, Gene ontology (GO) annotations for EOPE were collected according to known confirmed database and DEGs. Ultimately, the multifunctionality algorithm was used to extend the “guilt by association” method based on the co-expressed network, and a 3-fold cross valida-tion was operated to evaluate the accuracy of the algorithm.
Results: During the process, the GO terms, of which the area under the curve (AUC) over 0.7 were screened
as the optimal gene functions for EOPE. Six functions including the ion binding and cellular response to stimu-lus were determined as the optimal gene functions.
Conclusion: Such findings should help to better understand the pathogenesis of EOPE, so as to provide some
references for clinical diagnosis and treatment in the future.
Keywords: Early-onset preeclampsia, Optional function, Co-expressed genes network, Multifunctionality
The expression of aberrant genes has been demonstrated to play significant roles in EOPE pathogenesis (5, 6). For example, Yang et al have found osteoprotegerin gene variants is associated with early-onset severe preeclampsia. It is report-ed that miR-1301 is dysregulatreport-ed in EOPE and could possibly play a role in the regulation of lep-tin during pregnancy (7). However, genes do not work in isolation but interact with each other col-lectively (8), and understanding the differential co-expression network will be conducive to elu-cidate EOPE.
In this study, we used a modified GBA method to predict the optimal function of aberrant genes in EOPE based on the differentially expressed genes (DEGs) co-expressed network. These gene functions tend to have potential for understand-ing the mechanisms underlyunderstand-ing EOPE and be helpful for making early diagnosis of EOPE.
Methods
Gene expression in EOPE
Eight EOPE placentas (EOPE group) and 8 ges-tational age matched controls (control group) were subjected to bioinformatics analysis. After preprocessing and mapping between genes and probes, we got 21,036 gene expression profile data.
Detections of DEGs
The differentially expressed values of genes in the two groups were assessed with the LIMMA pro-cedure package which is a linear model for mi-croarray data (9). The P values for all genes were amplified into -log10 form after being conducted with t and F test. Genes with threshold value of P < 0.02 and |log2FoldChange| >2 were regarded as DEGs.
Construction of co-expressed network
We inputted SRCC of DEGs into the Cytoscape software (v3.5.1) to visualize their co-expression network which is an entity composed of edges and nodes. Then the topology characteristics of constructed network were analyzed based on the
distribution of node degree, a measurement of connectivity in the co-expression network. Be-sides, the SRCC was determined as the weight value of the connective edge between co-expressed gene pairs, and the greater the weight value was, the closer the two genes relation was. Then the edges with threshold of weight values over 0.8 were selected to construct the sub-network which could display the connected rela-tion more vividly.
Inferring the optimal function of network DEGs
Overall, 19,003 GO terms of 18,402 genes were downloaded from the GO database (http://geneontology.org/). Then the DEGs were enriched to the GO terms, and 65 GO terms which aggregated more than 20 DEGs were screened out to get more stable perfor-mance.
Thus, we improved gene function prediction per-formance in EOPE progression based on neigh-bor voting, including the nearest-neighneigh-bor voting and indirect connections. Concretely, for each gene i in the co-expressed network, all other neighbor genes of gene i were voted to each GO annotation K above, and the multifunctionality (MF) scores for each gene i within the K-GO term were calculated based on the following equation:
MFi= ∑
1
NuminK∗ NumoutK
i|Genei∈GOK
In this formula, Num_inK is the number of neighbor genes within GO term K, and Num_outK is the number of neighbor genes out-side GO term K. This algorithm is available at http://www.genelibs.com/gb.
curve as the score for that GO term, and the av-erage AUC of those terms as the measure of their performance. Certainly, the GO terms which had the greater AUC implied well-performable and were regarded as the optional gene functions in EOPE.
Results
The C4orf48 and SCN9A were the key aber-rant genes in co-expressed network.
Before the construction of co-expressed network, we firstly identified DEGs between EOPE and normal samples with the Limma procedure pack-age. After the adjustment using t and F test, 81 DEGs with the thread of P < 0.02 and |log2FoldChange| >2 were screened out. The top 20 DEGs were found and the most signifi-cant DEGs were IER5, ITSN1, PPP1R16B, SLC16A10, and TNFAIP.
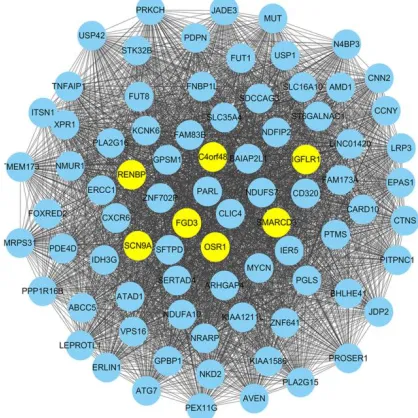
Fig. 1: The co-expressed genes network construction
for early-onset preeclampsia (EOPE). The co-expressed genes network was constructed using the Cytoscape software. There were 81 nodes and 3240 interactions, besides, FGD3, OSR1, C4orf48, SCN9A, RENBP, SMARCD3, and IGFLR1 with higher degrees were identified out
In order to further explore the interactions of DEGs above, the SRCC was calculated to assess
co-expressed strength of each interaction be-tween DEGs, and the co-expressed network (Fig. 1) was constructed using the Cytoscape software (v3.5.1) and the matrix color map was also plot-ted based on the SRCC (Fig. 2).
In the matrix color map, the SRCC was used to assign a weight value to an edge in the form of a colored square. In this co-expressed network, there were 81 nodes and 3240 interactions. Top 7 nodes with the higher degree were marked using yellow highlights in Fig. 1. They were FGD3, OSR1, C4orf48, SCN9A, RENBP, SMARCD3, and IGFLR1, indicated that they were in a greater number of sets of genes and played more im-portant roles in the development of EOPE. Fur-ther, to display the interacted strength between gene pairs more vividly, a sub-network with the edges weight values > 0.8 was drawn (Fig. 3). In the sub-network, there were 41 nodes and 393 interactions. Interestingly, C4orf48 and SCN9A also had the highest degree (degree=30), and the other five DEGs which had higher degree in the co-expressed network also existed in this sub-network.
Fig. 2: The matrix color map clarified weight
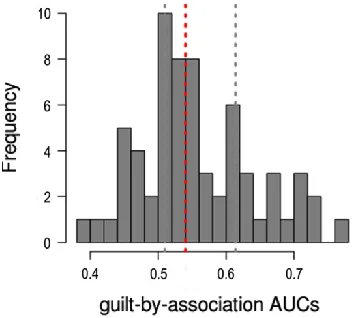
Six GO terms with AUC over 0.7 were deter-mined as the optimal gene functions in EOPE. We introduced the MF algorithm to improve the classifiers' performance in gene function predic-tion involved in EOPE. To evaluate the algo-rithm’s efficacy, the 3-fold cross validation was performed using the gene sets based on MF. The
AUC distribution for GO terms was shown in Fig. 4. The AUCs for the majority of functional terms were over 0.5, especially, some GO terms for which performance was quite good (over 0.7). Further, Six GO terms were screened out as the optimal gene functions.
Fig. 3: Sub-network. Sub-network using the cut-off threshold of weight value over 0.8. FGD3, OSR1, C4orf48,
SCN9A, RENBP, SMARCD3, and IGFLR1 which had higher degrees in the co-expressed genes network also exist-ed in this sub-network
Fig. 4: Gene function prediction performance using modified guilt by association (GBA). The histogram of AUCs
across all GO terms can be obtained in the 3-fold cross validation process
Discussion
The large-scale analysis of biological information was the symbol of post-genome era, especially, in which the functional genomics is one of the hotspots. It is of great significance to predict the
discover which gene-gene relationships are in-volved in a specific biological process (11, 12). In this study, we successfully predicted the op-tional function of key aberrant genes by gene networks for EOPE. Concretely, firstly, the 81 DEGs were screened out with the Limma proce-dure package, and the most significant DEGs were IER5, ITSN1, PPP1R16B, SLC16A10, and TNFAIP. Then the SRCC was calculated to as-sess co-expressed strength of each interaction between DEGs, based on which we constructed the co-expressed network to vividly exhibit their interlinking relationship with the Cytoscape soft-ware. The C4orf48 and SCN9A with the highest degrees were screened out from the sub-network drawn with the threshold of edges weight values > 0.8. The last but not least, the MF algorithm was used to extend the GBA principle based on neighbor voting, including the nearest-neighbor voting and indirect connections, and the ranking of genes arisen from MF scores. Further, a 3-fold cross validation was conducted to evaluate the accuracy of the algorithm, and as a result, the AUCs for the majority of functional terms were over 0.5, implying that the performance of GO terms was good, and we could use the AUCs to predict GO category membership. Six GO terms with the AUCs over 0.7 including the ion binding function and cellular response to stimulus pro-cess were identified and naturally regarded as the optional gene functions in EOPE.
The expression of abnormal genes is a critical factor in the onset and development of disease (13, 14). Therefore, it is very important for us to explore how the abnormal genes regulate the mo-lecular function and biological processes associ-ated with EOPE. In this study, the ion binding function was found to be most relevant to EO-PE. During pregnancy, the placenta constitutes the main barrier for the exchange of material be-tween mother and fetus, which becomes a vital organ that maintains nutrition and development of fetal. There are many ion channels in syncytio-trophoblast of human placenta, including chlo-ride channels, calcium channels, sodium channels and potassium channels (15,16). The expression level of human calcium transport proteins CaT1
in the placenta is related to the absorptive amount of calcium ions and was time-dependent (17). Thus, these channels are closely related to the physiological function regulation of the pla-centa, and the change of ion binding function may influence the placental microenvironment, which was an important factor that lead to ma-ternal hypertension and less nutrition to fetal. Cellular response to stimulus is a defensive or adaptive response from the cells when they en-counter harmful stimuli or lie in a hostile envi-ronment. The harmful stimuli includes reactive oxygen species (ROS), physical and chemical agents. The antioxidant reaction of the body can lead to the increase of lipid peroxides, and affect some cell signaling transduction and enzyme pathways related to the synthesis of vascularized substances (18). In our study, the cellular re-sponse to stimulus process was predicted an im-portant function involved in the pathophysiology of preeclampsia by DEGs network-based GBA method. Through the literatures, we found the oxidative stress, one of the cellular response to stimulus processes, was reported elevated in mildly EOPE patients (19, 20). Besides, the oxi-dative stress was observed in the oocytes of obese animals before pregnancy. Therefore, the cellular response to stimulus function plays an important role in the occurrence and develop-ment of pathological EOPE. Based on the above mechanism, supplemental antioxidants in preg-nancy may fight against oxidative stress, and pre-vent or delay the occurrence of EOPE.
Conclusion
This study plays a great role for the molecular mechanisms underlying EOPE, and it may help us to understand the pathogenesis to focus on the genes which belong to these functions.
Ethical considerations
redundancy, etc.) have been completely observed by the authors.
Acknowledgements
No fund was received in this study.
Conflict of Interest
The authors declare that there is no conflict of interest.
References
1. Ghulmiyyah L, Sibai B (2012). Maternal mortality from preeclampsia/eclampsia. Semin Perinatol, 36: 56-59.
2. Eiland E, Nzerue C, Faulkner M (2012). Preeclampsia 2012. J Pregnancy, 2012: 586578. 3. Roberts CL, Ford JB, Algert CS, et al (2011).
Population-based trends in pregnancy hypertension and pre-eclampsia: an international comparative study. BMJ Open, 1(1): e000101.
4. Lisonkova S, Sabr Y, Mayer C, Young C, Skoll A, Joseph KS (2014). Maternal morbidity associated with early-onset and late-onset preeclampsia. Obstet Gynecol, 124: 771-781. 5. Chelbi ST, Mondon F, Jammes H et al (2007).
Expressional and epigenetic alterations of placental serine protease inhibitors: SERPINA3 is a potential marker of preeclampsia. Hypertension, 49(1): 76-83. 6. Song L, Zhong M (2015). Association between
Interleukin-10 gene polymorphisms and risk of early-onset preeclampsia. Int J Clin Exp
Pathol, 8(9): 11659-11664.
7. Weedon-Fekjaer MS, Sheng Y, Sugulle M et al (2014). Placental miR-1301 is dysregulated in early-onset preeclampsia and inversely correlated with maternal circulating leptin.
Placenta, 35(9): 709-717.
8. Rahmatallah Y, Emmert-Streib F, Glazko G (2014). Gene Sets Net Correlations Analysis (GSNCA): a multivariate differential coexpression test for gene sets. Bioinformatics, 30(3): 360-368.
9. Smyth GK, Ritchie M, Thorne N, Wettenhall J (2005). In: Gentleman R, Carey VJ, Huber W, Irizarry RA, Dudoit S. (eds) Bioinformatics and Computational Biology Solutions Using
R and Bioconductor. Statistics for Biology and Health. Springer, New York, NY. 10. Verleyen W, Ballouz S, Gillis J (2015). Measuring
the wisdom of the crowds in network-based gene function inference. Bioinformatics, 31(5): 745-752.
11. Hecker M, Lambeck S, Toepfer S, van Someren E, Guthke R (2009). Gene regulatory network inference: data integration in dynamic models-a review. Biosystems, 96(1): 86-103. 12. Bonow RO (2014). Left atrial function in mitral
regurgitation: guilt by association. JACC
Cardiovascular imaging, 7(3): 233-235.
13. Demokan S, Chuang A, Suoglu Y et al (2012). Promoter methylation and loss of p16(INK4a) gene expression in head and neck cancer. Head Neck, 34(10): 1470-1475. 14. Cirillo A, Di Salle A, Petillo O et al (2014). High
grade glioblastoma is associated with aberrant expression of ZFP57, a protein involved in gene imprinting, and of CPT1A and CPT1C that regulate fatty acid metabolism. Cancer Biol
Ther, 15(6): 735-741.
15. Riquelme G (2009). Placental chloride channels: a review. Placenta, 30(8): 659-669.
16. Vallejos C, Riquelme G (2007). The
maxi-chloride channel in human
syncytiotrophoblast: a pathway for taurine efflux in placental volume regulation? Placenta, 28(11): 1182-1191.
17. Marino GI, Kotsias BA (2013). Expression of the epithelial sodium channel sensitive to amiloride (ENaC) in normal and preeclamptic human placenta. Placenta, 34(2): 197-200. 18. Moon SY, Lee JH, Choi HY, Cho IJ, Kim SC,
Kim YW (2014). Tryptanthrin protects hepatocytes against oxidative stress via activation of the extracellular signal-regulated kinase/NF-E2-related factor 2 pathway. Biol
Pharm Bull, 37(10): 1633-1640.
19. Hilali N, Kocyigit A, Demir M et al (2013). DNA damage and oxidative stress in patients with mild preeclampsia and offspring. Eur J
Obstet Gynecol Reprod Biol, 170: 377-380.
20. Karacay Ö, Sepici-Dincel A, Karcaaltincaba D et al (2010). A quantitative evaluation of total antioxidant status and oxidative stress markers in preeclampsia and gestational diabetic patients in 24–36 weeks of gestation.