1535-9778/11/$12.00 doi:10.1128/EC.05168-11
Copyright © 2011, American Society for Microbiology. All Rights Reserved.
Evolutionary Dynamics of
Candida albicans
during
In Vitro
Evolution
䌤
†
Mian Huang,
1Mark McClellan,
2Judith Berman,
2and Katy C. Kao
1*
Department of Chemical Engineering, Texas A&M University, College Station, Texas,1and Department of
Genetics, Cell Biology, and Development, University of Minnesota, Minneapolis, Minnesota2
Received 5 July 2011/Accepted 22 August 2011
While mechanisms of resistance to major antifungal agents have been characterized inCandida albicans, little is known about the evolutionary trajectories during the emergence of drug resistance. Here, we examined the evolutionary dynamics ofC. albicansthat evolvedin vitroin the presence or absence of fluconazole using the visualizing evolution in real-time (VERT) method, a novel experimental approach that facilitates the systematic isolation of adaptive mutants that arise in the population. We found an increase in the frequency of adaptive events in the presence of fluconazole compared to the no-drug controls. Analysis of the evolutionary dynamics revealed that mutations that led to increased drug resistance appeared frequently and that mutants with increased levels of resistance arose in independent lineages. Interestingly, most adaptive mutants with increased fitness in the presence of the drug did not exhibit a significant fitness decrease in the absence of the drug, supporting the idea that rapid resistance can arise from mutations in strains maintained in the population prior to exposure to the drug.
The emergence of antimicrobial drug resistance in patho-gens is a process of adaptive evolution, generally as a result of genetic mutations. Depending on the size of the population, the rate of mutation, and the relative fitness coefficients, the population may be heterogeneous, consisting of multiple resis-tant genotypes competing for expansion in a process called “clonal interference” (10, 12). Determining the evolutionary dynamics during adaptation is important for understanding the fundamental principles underlying how eukaryotic microbes evolve resistance to antimicrobial agents, a process that differs from that in bacteria because it is unlikely to involve horizontal gene transfer (1, 6).
It is important to understand the frequencies with which adaptive mutants arise and expand, the evolutionary trajecto-ries (the order of occurrence of adaptive mutations), and the potential convergence or divergence in the adaptive mecha-nisms between parallel populations in order to better appreci-ate how drug resistance can emerge in pathogens growing within the host. For example, knowledge of the frequency and order in which drug-resistant mutants arise in the population and whether the early-arising resistance mechanisms play a role in the level of drug resistance ultimately reached in the population can be used to predict the likely trajectory of a clinical infection and to develop appropriate therapeutic strat-egies.
Candida albicansis the fourth most common cause of
nos-ocomial infections, resulting in rates of mortality in U.S. hos-pitals that approach 50% (23, 24, 44). Emergence of resistance to almost all major antifungal agents used in treatingC. albi-cans infections has been reported (15, 22, 29). Among the existing classes of antifungal drugs, azoles are the most
com-monly used, due to their low toxicity and their oral availability. The fact that they are fungistatic rather than fungicidal pro-vides a clear opportunity for the evolution of drug resistance during long periods of prophylactic treatment (25).
The mechanisms of resistance to azole drugs have been studied extensively (18, 19, 21, 27, 28, 32, 36, 37, 40, 42, 43). However, a large percentage (50%) of drug-resistant clinical isolates from a reported collection have unknown mechanisms of resistance (40). InC. albicans, resistance has arisen bothin
vitroandin vivoand includes point mutations, loss of
heterozy-gosity, and/or gross chromosomal-rearrangement mechanisms, (32, 34, 35). Studies of drug-resistant isolates from patients during the course of treatment, as well as from long-term laboratory evolution experiments, suggest that evolving popu-lations are heterogeneous, include multiple resistance mecha-nisms (9, 35, 38, 39), and likely involve complex population dynamics. For example, in a series of 9C. albicansisolates from a bone marrow transplant patient undergoing antifungal drug treatments, multiple resistance mechanisms were present and competing (34), further highlighting the need to understand the dynamics during the emergence of drug resistance.
Here, we report the first study to monitor the rise and expansion of adaptive events in C. albicans during in vitro
evolution in continuous cultures under increasing concentra-tions of fluconazole. We used the visualizing evolution in real-time (VERT) approach, which was originally developed for analyzing evolution in the model eukaryote Saccharomyces
cerevisiae(14). In VERT, a set of isogenic strains differing only
in their expression of different fluorescent proteins (FP) is used to visualize when adaptive events occur (the rise and expansion of adaptive mutants), to determine how frequently they occur, and to facilitate the identification and isolation of adaptive mutants from the population. The evolutionary dynamics indi-cate that adaptive events occur more frequently in the pres-ence of the drug than in the control populations that evolved in the absence of the drug. Adaptive clones isolated from each of the observed adaptive events and relative fitness coefficient measurements were used to estimate the fitness costs
associ-* Corresponding author. Mailing address: Department of Chemical Engineering, Texas A&M University, College Station, TX. Phone: (626) 533-3673. Fax: (979) 845-6446. E-mail: [email protected].
† Supplemental material for this article may be found at http://ec .asm.org/.
䌤Published ahead of print on 2 September 2011.
1413
on September 8, 2020 by guest
http://ec.asm.org/
ated with increases in the level of drug resistance. Importantly, increases in drug resistance were not necessarily accompanied by significant fitness costs and in some cases were accompanied by fitness increases.
MATERIALS AND METHODS
Strains.All strains used in this work are isogenic derivatives of theC. albicans
strain SC5314. Three different fluorescent cassettes, each containing aNAT1
marker and a fluorescent protein (either red fluorescent protein [RFP], green fluorescent protein [GFP], or yellow fluorescent protein [YFP]), were amplified by PCR from plasmids pMG2261, pMG2120, and pMG2263, respectively, using two different sets of primers. The primers for PCR amplifying GFP and YFP
cassettes were 5⬘-GAG AAT CGA AGA AGA ATT AGG TTC TGA AGC TAT
CTA CGC TGG TAA AGA TTT CCA AAA GGC TTC TCA ATT GGG TGG
TGG TTC TAA AGG TGA AGA ATT ATT-3⬘and 5⬘-TTT AAT TAG TTC
ATA TAT TCA AGA TGT TCC TAT AAA AGA AAA AAA AAG CAC CAG
CTT TTT TTT ATT TAA TCG TAA AAC GAC GGC CAG TGA ATT C-3⬘.
The primers for amplifying the RFP cassette were 5⬘-GAG AAT CGA AGA
AGA ATT AGG TTC TGA AGC TAT CTA CGC TGG TAA AGA TTT CCA AAA GGC TTC TCA ATT GGG TGG TGG TGA TAA CAC TGA AGA TGT
TAT T-3⬘and 5⬘-TTT AAT TAG TTC ATA TAT TCA AGA TGT TCC TAT
AAA AGA AAA AAA AAG CAC CAG CTT TTT TTT ATT TAA TCG TAA
AAC GAC GGC CAG TGA ATT C-3⬘. The resulting PCR products were then
transformed into strain SC5314 to form a translational fusion of fluorescent
cassettes to the 3⬘end of theENO1gene in the chromosome by homologous
recombination. Transformants were selected on yeast extract-peptone-dextrose
plus adenine (YPAD) agar plates with nourseothricin (400g/ml), and the
fluorescence of each strain was confirmed by microscopy.
The strains were grown in yeast nitrogen base (YNB) without amino acids
supplemented with 0.5% (wt/vol) ammonium sulfate and 2% (wt/vol)D-glucose
unless otherwise specified.
Laboratory evolution experiments.Cells expressing each fluorescent protein (GFP, YFP, or RFP) were mixed together in approximately equal numbers (as confirmed by flow cytometry) at the start of parallel chemostat (30 ml each) evolution experiments in YNB supplemented with 0.5% (wt/vol) ammonium sulfate and 0.2% dextrose (the limiting nutrient) with or without fluconazole.
The populations evolved at steady state at 30°C at a dilution rate (D) of⬃0.2
h⫺1. In chemostat experiments, the generation time is determined by the dilution
rate. Using a dilution rate of 0.2 h⫺1
, the generation time is calculated as ln(2)/0.2, or 3.5 h/generation. Two parallel series of evolution experiments were conducted; each series contained one control population (no fluconazole) and one population exposed to stepwise increases of fluconazole, starting with 0.25
g per ml and increasing the concentration by 4-fold every 50 to 70 generations.
Samples were taken every 7 to 14 generations, and a portion (1.5 ml) of the cells were frozen in 17% glycerol for future analysis. Cell concentrations were mea-sured using a hemocytometer, and the relative proportions of the three subpopu-lations (GFP, YFP, and RFP) were measured using a FACScan flow cytometer (BD Biosciences, San Jose, CA).
Isolation of adaptive mutants.At the conclusion of the evolution experiment, we identified the time point samples likely to have a substantial fraction of an adaptive clone in one of the fluorescently marked subpopulations, based on the dynamics of the relative subpopulation sizes. Specifically, we identified the time point sample in which an expanding colored FP subpopulation appeared to reach its maximum proportion of the population. Population samples from the gener-ation at which the expanding subpopulgener-ation reached a maximum proportion were plated on YNB plates. Using a Dark Reader (Clare Chemical), which can distinguish GFP-, YFP-, and RFP-expressing cells, at least seven isolates express-ing the colored fluorescent protein of the expandexpress-ing subpopulation were picked for fitness measurements. For all isolates from the same adaptive event, we performed pairwise competition experiments by growing each isolate in contin-uous culture together with the previous adaptive mutant (for the first observed adaptive event, the isolates were individually competed against the parental strain of a different FP). Figure S1 in the supplemental material shows the flow of the process. The experiments were carried out in the presence of the same concentration of fluconazole used during the evolution of those isolates. Of the seven or more clones tested from each observed adaptive event, the clone with the highest fitness coefficient was chosen as the adaptive clone for that adaptive event, except in cases where multiple isolates exhibited similar fitness coeffi-cients. In those cases, an arbitrary isolate was chosen from the fittest group.
Pairwise competition experiments.Chemostat experiments in YNB with 0.2% dextrose and 0.5% (wt/vol) ammonium sulfate and in the presence or absence of
fluconazole were initiated with approximately equal numbers of the two clones to be competed (each carrying a different FP marker). The pairwise competition
experiments were conducted at 30°C with a dilution rate of⬃0.2 h⫺1. Samples
were taken every 1 to 5 generations, and the relative proportions of each of the two clones were measured using flow cytometry. The data were plotted on a
linear scale with ln[x/(1⫺x)] versust, wherexis the fraction of the sample clone
andtis generations. The relative fitness coefficient was determined from the
slope of the linear region of the curve using linear regression analysis. For statistical analysis, the relative fitness coefficients between pairs of the fluorescently labeled parental strains were measured either in the absence of fluconazole or in the
presence of 0.25g/ml of fluconazole. A minimum of three biological replicates
were performed for each pairwise competition experiment. A Studentttest was used
to determine whether the relative fitness coefficients measured for the adaptive
mutants were statistically significant (Pvalue cutoff, 0.05).
MIC measurements.The fluconazole MIC for each isolated adaptive mutant was determined with an Etest strip according to the manufacturer’s instructions
(bioMe´rieux SA, France). The highest MIC value from 3 biological replicates
was reported.
Stability analysis of adaptive mutants.One of the parent strains (KKCa-14) and all isolated adaptive mutants from the DP-1 and DP-2 populations under-went stability tests in the absence of fluconazole. The strains were first plated on YNB plates supplemented with 2% dextrose, and a single colony was picked up and transferred into fresh YNB broth. Five microliters of cell culture for each strain was inoculated into 5 ml fresh YNB broth to make a 1,000-fold dilution and then was incubated at 30°C for 24 h. The transfer was repeated for two more
days (for a total of⬃30 generations). The optical density of the cell culture was
measured at 600 nm before each transfer. MIC measurements were performed for each strain to test the stability of the drug resistance after long-term incu-bation in serial batch transfer in the absence of the drug.
CHEF karyotype analysis.Preparation of cells for contour-clamped homoge-neous electric field (CHEF) karyotype analysis was performed as described previously (31). Whole-chromosome separation was performed on a Bio-Rad CHEF-DR III with the following program: 60- to 120-s switch, 6 V/cm, 120° angle for 36 h, followed by a 120- to 300-s switch, 4.5 V/cm, 120° angle for 12 h. SfiI digestion of CHEF gel plugs was performed using the following procedure. A portion of whole-chromosome CHEF plugs were washed twice for 10 min each time in 1 ml of 10 mM Tris (pH 8.0), 1 mM EDTA (TE buffer) and then incubated in 1 ml of TE buffer containing 0.1 mM phenylmethylsulfonyl fluoride
for 10 min. The plugs were washed twice as before and incubated in 500l of SfiI
restriction enzyme buffer containing bovine serum albumin (BSA) at 100g/ml
for 15 min, and 40 units of SfiI enzyme was added. The SfiI-treated plugs were then incubated overnight at 50°C, washed in 100 mM EDTA (pH 8.0), added to
a 1% Megabase agarose gel (Bio-Rad, Hercules, CA) in 0.5⫻TBE buffer (45
mM Tris, 45 mM boric acid, 1 mM EDTA), and separated as previously de-scribed (35).
Ploidy analysis.Strain ploidy was examined by flow cytometry.C. albicans
strains were grown to log phase, and⬃4⫻106
cells were collected in a
round-bottom microtiter plate by centrifugation. The pellets were resuspended in 20l
of 50 mM Tris, pH 8, 50 mM EDTA (50/50 TE); 180l of 95% ethanol was
added dropwise, and the suspensions were stored overnight at⫺20°C. The
ethanol-fixed cell pellets were washed twice with 200l of 50/50 TE, resuspended
in 200l of RNase A at 500g/ml in 50/50 TE, and incubated for 2 h at 37°C.
The cells were centrifuged again, and the pellets were incubated in 200l of 1
mg/ml proteinase K in 50/50 TE for 2 h at 37°C. The cells were centrifuged again
and washed in 50/50 TE, and the pellets were resuspended in 50l of Sybr green
I (1:85 dilution; Invitrogen, Carlsbad, CA) in 50/50 TE and incubated overnight in the dark. Finally, the cells were centrifuged, the pellets were resuspended in
700l 50/50 TE, and ploidy was detected and analyzed on a FACScaliber flow
cytometer (BD Biosciences, San Jose, CA).
RESULTS
Adaptive evolution in the presence of fluconazole.Two sets of parallel populations ofC. albicanswere allowed to evolve either in the absence (control populations, CP-1 and CP-2) or in the presence (DP-1 and DP-2) of increasing concentrations of fluconazole. The VERT system was used to follow the evo-lutionary dynamics of three subpopulations within each paral-lel population. At the start of the VERT experiment, the pop-ulations were initiated with approximately equal numbers of
on September 8, 2020 by guest
http://ec.asm.org/
each FP cell type. The relative proportions of each FP subpop-ulation were measured using flow cytometry. For the flucona-zole-exposed populations (DP-1 and DP-2), the concentration of fluconazole at the start of the experiment was 0.25g/ml, which is equal to twice the MIC of the parental strains. At generation 64, the fluconazole concentration had increased to 1g/ml, and at generation 112, it had further increased to 4
g/ml. The evolutionary dynamics for all 4 populations over approximately 170 generations are shown in Fig. 1.
An observed expansion of a particular FP subpopulation is indicative of an adaptive event within that subpopulation, and clones that were likely to be responsible for the observed expansions were isolated and named according to the popula-tion from which they were isolated. For example, clone CP-1-M1 was the adaptive mutant isolated from the first observed expansion (M1) from the CP-1 population. Based on the evo-lutionary dynamics observed, an adaptive event occurred every
⬃20 to 50 generations in the controls and every ⬃10 to 40 generations in the fluconazole-exposed populations. Thus, the number of adaptive events observed over ⬃170 generations was significantly higher in the populations exposed to drug than in those not exposed to drug, with approximately 7 and 10 adaptive events observed in the two fluconazole-exposed pop-ulations and 3 and 4 adaptive events observed in the control populations.
Dynamics of evolution in the presence of fluconazole. We expected that exposure of an expanding subpopulation to in-creased fluconazole concentrations would result in continued expansion of that FP subpopulation, as the most competitive clone is most likely present within the subpopulation that is expanding. Indeed, this expected trend was observed in the DP-1 population. Upon the first increase in the fluconazole concentration, the YFP subpopulation, which started expand-ing at approximately generation 58, continued to expand fol-lowing the increase in the drug concentration at generation 64. In addition, the RFP subpopulation began to expand at this time point, suggesting that an adaptive clone arose in this subpopulation, as well. Indeed, the adaptive mutant isolated after the first increase in the fluconazole concentration (DP-1-M2) showed increased fitness compared to both the previous adaptive mutant (DP-1-M1) and the parental strain (KKCa-20) in the presence of the drug (Fig. 2 and 3 and Tables 1 and 2), despite the fact that the MIC for fluconazole was 0.38g/ml for both DP-1-M1 and DP-1-M2. Upon the second increase in the fluconazole concentration, at generation 112, the expand-ing YFP subpopulation again continued to expand as expected, suggesting that the expanding subpopulations prior to each increase in the drug concentration were composed of the most drug-resistant mutants. However, the isolated adaptive mutant after the second increase in the drug concentration (DP-1-M4)
FIG. 1. Evolutionary dynamics of experimental populations evolved either in the absence (CP-1 population [A] and CP-2 population [B]) or presence (DP-1 population [C] and DP-2 population [D]) of fluconazole. The colored bars represent the relative fractions of each colored subpopulation, RFP (red), GFP (green), and YFP (yellow), as determined using fluorescence-activated cell sorting (FACS). FLU, concentration of fluconazole in the feed. The subpopulations from which the adaptive mutants were isolated are numbered (details are in Table 1).
on September 8, 2020 by guest
http://ec.asm.org/
was not more fit than the previous adaptive mutant (DP-1-M3) in the presence of fluconazole but was slightly more fit in the absence of the drug.
Interestingly, we did not observe the same trend in the DP-2 population. After each of the stepwise increases in the flucona-zole concentration, a different FP subpopulation started to expand. One possibility to account for this observation is that a more drug-resistant mutant was already present in the sub-population that started expanding after the increase in the drug concentration, but it was present at a low frequency and thus was more difficult to observe (see below for further dis-cussion).
Relative fitness coefficients in the presence and absence of drug.The observed adaptive events and the colored FP corre-sponding to each adaptive expanding subpopulation at the
generation in which it reached its maximum proportion of the population are illustrated in Fig. 1. Adaptive mutants (listed in Table 1) were isolated from each of the observed adaptive events (see Materials and Methods for details). The fitness coefficient of each isolated adaptive clone was determined by competing the isolate against the previous adaptive clone (for all isolated adaptive mutants) and the parental strain of a different color (for adaptive mutants isolated from the DP-1 and DP-2 populations), either in the presence (for the zole-exposed populations) or in the absence (for both flucona-zole-exposed and no-drug control populations) of drug (Fig. 2 and 3 and Tables 1 and 2). While not all isolated adaptive mutants from the fluconazole-exposed populations exhib-ited an increase in fitness compared to the previous adaptive mutants, all of them showed increases in fitness compared to
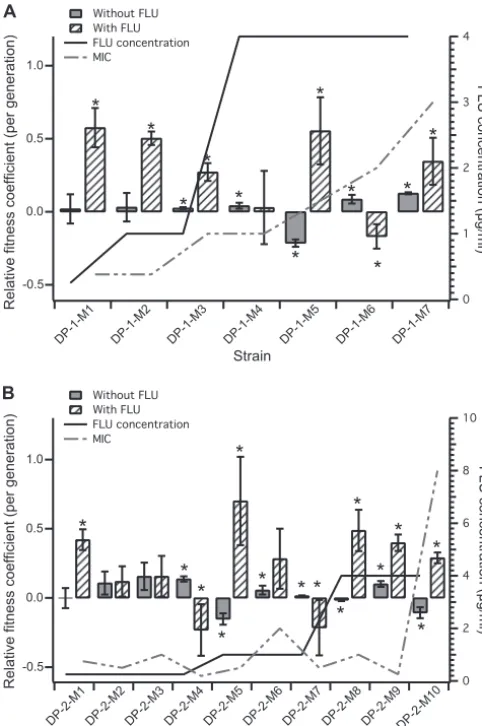
FIG. 2. Relative fitness coefficients of adaptive mutants isolated from the fluconazole-exposed populations compared with the previous adaptive mutant, DP-1 (A) and DP-2 (B), in the presence of flucona-zole (hatched bars), measured at the drug concentration indicated by the solid line, or without fluconazole (solid bars). The data shown are the averages and standard deviations (SD) of a minimum of 3 biological replicates. The asterisks indicate that the relative fitness difference measured in the adaptive strains is statistically significant (P⬍0.05, using an unpaired Studentttest with unequal variance). The dashed line indicates the measured MIC of each adaptive mutant.
FIG. 3. Relative fitness coefficients of adaptive mutants isolated from fluconazole-exposed populations compared with the parental strain (different FP), DP-1 (A) and DP-2 (B), in the presence of 0.25 g/ml of fluconazole (hatched bars) or without fluconazole (solid bars). The data shown are the averages and SD of a minimum of 3 biological replicates. The asterisks indicate that the relative fitness difference measured in the adaptive strains is statistically significant (P⬍0.05, using an unpaired Studentttest with unequal variance).
on September 8, 2020 by guest
http://ec.asm.org/
the parental strain in the presence of fluconazole (Fig. 3 and Table 2).
Interestingly, for most of the adaptive clones isolated from the fluconazole-exposed populations, increases in the relative fitness coefficient in the presence of fluconazole were not ac-companied by significant decreases in fitness in the absence of the drug. This was especially evident in the isolated adaptive mutants from the DP-2 population, where most mutants ex-hibited an increase in the relative fitness coefficient compared to the parental strain in the absence of the drug, suggesting that there was no fitness cost associated with the increase in drug resistance (Fig. 3 and Table 2). Furthermore, for most of the adaptive clones, there was no fitness cost associated with increases in the MIC (Fig. 2 and Table 1).
Chromosomal rearrangements. Because aneuploidy has been associated with the acquisition of fluconazole resistance in a subset ofC. albicansisolates (32, 34), we next asked if any of the adaptive mutants exhibited obvious signs of altered ploidy, using flow cytometry to measure the DNA content (Table 1). The majority of the adaptive mutants appeared to be diploids (2N). However, there were two exceptions: strain CP-2-M2, isolated from generation 125 of the control population, had an⬃4N genome content, suggesting that it is a tetraploid; strain DP-1-M6, isolated from generation 146 of the
flucona-TABLE 2. Relative fitness coefficients for isolated adaptive mutants compared to the parental isolate used to initiate the culture
Adaptive
event Strain
No drug FLUb
Relative
fitnessa/
generation
P
valuea
Relative
fitnessa/
generation
P
valuea
8 DP-1-M1 ⫺0.02⫾0.1 0.74 0.58⫾0.13 0.01 9 DP-1-M2 0.03⫾0.01 0.05 0.51⫾0.1 0.01 10 DP-1-M3 0.07⫾0.04 0.08 0.71⫾0.13 0.01 11 DP-1-M4 0.11⫾0.06 0.07 0.22⫾0.03 0.00 12 DP-1-M5 ⫺0.1⫾0.02 0.01 0.68⫾0.06 0.00 13 DP-1-M6 0.02⫾0.07 0.50 0.63⫾0.08 0.00 14 DP-1-M7 0.05⫾0.02 0.04 0.52⫾0.05 0.00 15 DP-2-M1 ⫺0.02⫾0.07 0.63 0.42⫾0.08 0.00 16 DP-2-M2 0.03⫾0.01 0.00 0.61⫾0.01 0.00 17 DP-2-M3 0.11⫾0.03 0.03 0.62⫾0.08 0.00 18 DP-2-M4 0.23⫾0.03 0.01 0.41⫾0.08 0.01 19 DP-2-M5 0.12⫾0.02 0.01 0.67⫾0.08 0.03 20 DP-2-M6 0.15⫾0.06 0.05 0.61⫾0.05 0.00 21 DP-2-M7 0.13⫾0.03 0.01 0.52⫾0.13 0.02 22 DP-2-M8 0.06⫾0.04 0.08 0.49⫾0.01 0.00 23 DP-2-M9 0.19⫾0.02 0.00 0.47⫾0.1 0.01 24 DP-2-M10 0.02⫾0.01 0.03 0.51⫾0.04 0.00
a
Relative to the parental strain of a different color.
b
FLU, fluconazole.
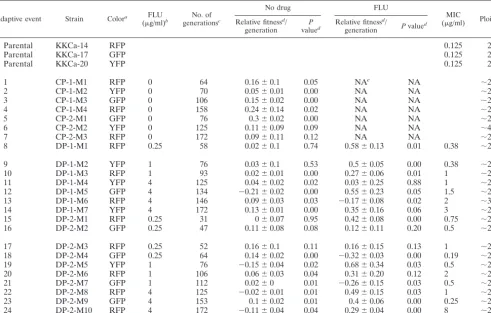
TABLE 1. Adaptive mutants isolated from both fluconazole-exposed (FLU) and control populations
Adaptive event Strain Colora FLU
(g/ml)b
No. of
generationsc
No drug FLU
MIC
(g/ml) Ploidy
Relative fitnessd
/ generation
P
valued Relative fitness
d
/
generation Pvalue
d
Parental KKCa-14 RFP 0.125 2N
Parental KKCa-17 GFP 0.125 2N
Parental KKCa-20 YFP 0.125 2N
1 CP-1-M1 RFP 0 64 0.16⫾0.1 0.05 NAe NA ⬃2N
2 CP-1-M2 YFP 0 70 0.05⫾0.01 0.00 NA NA ⬃2N
3 CP-1-M3 GFP 0 106 0.15⫾0.02 0.00 NA NA ⬃2N
4 CP-1-M4 RFP 0 158 0.24⫾0.14 0.02 NA NA ⬃2N
5 CP-2-M1 GFP 0 76 0.3⫾0.02 0.00 NA NA ⬃2N
6 CP-2-M2 YFP 0 125 0.11⫾0.09 0.09 NA NA ⬃4N
7 CP-2-M3 RFP 0 172 0.09⫾0.11 0.12 NA NA ⬃2N
8 DP-1-M1 RFP 0.25 58 0.02⫾0.1 0.74 0.58⫾0.13 0.01 0.38 ⬃2N
9 DP-1-M2 YFP 1 76 0.03⫾0.1 0.53 0.5⫾0.05 0.00 0.38 ⬃2N
10 DP-1-M3 RFP 1 93 0.02⫾0.01 0.00 0.27⫾0.06 0.01 1 ⬃2N
11 DP-1-M4 YFP 4 125 0.04⫾0.02 0.02 0.03⫾0.25 0.88 1 ⬃2N
12 DP-1-M5 GFP 4 134 ⫺0.21⫾0.02 0.00 0.55⫾0.23 0.05 1.5 ⬃2N
13 DP-1-M6 RFP 4 146 0.09⫾0.03 0.03 ⫺0.17⫾0.08 0.02 2 ⬃3N
14 DP-1-M7 YFP 4 172 0.13⫾0.01 0.00 0.35⫾0.16 0.06 3 ⬃2N
15 DP-2-M1 RFP 0.25 31 0⫾0.07 0.95 0.42⫾0.08 0.00 0.75 ⬃2N
16 DP-2-M2 GFP 0.25 47 0.11⫾0.08 0.08 0.12⫾0.11 0.20 0.5 ⬃2N
17 DP-2-M3 RFP 0.25 52 0.16⫾0.1 0.11 0.16⫾0.15 0.13 1 ⬃2N
18 DP-2-M4 GFP 0.25 64 0.14⫾0.02 0.00 ⫺0.32⫾0.03 0.00 0.19 ⬃2N
19 DP-2-M5 YFP 1 76 ⫺0.15⫾0.04 0.02 0.68⫾0.34 0.03 0.5 ⬃2N
20 DP-2-M6 RFP 1 106 0.06⫾0.03 0.04 0.31⫾0.20 0.12 2 ⬃2N
21 DP-2-M7 GFP 1 112 0.02⫾0 0.01 ⫺0.26⫾0.15 0.03 0.5 ⬃2N
22 DP-2-M8 RFP 4 125 ⫺0.02⫾0.01 0.01 0.49⫾0.15 0.03 1 ⬃2N
23 DP-2-M9 GFP 4 153 0.1⫾0.02 0.01 0.4⫾0.06 0.00 0.25 ⬃2N
24 DP-2-M10 RFP 4 172 ⫺0.11⫾0.04 0.04 0.29⫾0.04 0.00 8 ⬃2N
aFluorescent marker.
bFluconazole concentration in the feed.
cGeneration from which the strain was isolated.
dRelative to previous adaptive mutant.
eNA, not applicable.
on September 8, 2020 by guest
http://ec.asm.org/
zole-exposed population, had an⬃3N genome content, sug-gesting that it may be triploid or multiply aneuploid.
To examine if there were any obvious gross chromosomal rearrangements in the isolated adaptive mutants, we per-formed CHEF gel analysis (see Fig. S2 in the supplemental material). Alterations in the mobility of chromosome 6 (Chr6) and -7 are often detected and are likely due to alterations in the lengths of the major repeat sequence tracts (16). No alter-ations in the larger bands were observed, and no ectopic bands were evident. Analysis of genomic DNA digested with SfiI, which digests the genome into⬃2 or 3 resolvable bands per chromosome, detected new bands in two independent lineages: strains DP-1-M6 (RFP) and DP-1-M7 (GFP) (Fig. 4). To iden-tify the DNA present in each of these bands, they were excised from the gel and hybridized to microarrays ofC. albicansopen reading frame (ORFs) (11, 35). In both cases, hybridization detected a region of ChrR spanning the approximate coordi-nates 1,353 to 1,907 kb. This SfiI fragment begins at a major repeat sequence (MRS), includes the centromere (CENR), and ends at an SfiI site just past the rDNA repeats. The most likely explanation is that the presence of the new band was due to an alteration in the lengths of the rDNA repeats. Thus, we did not detect any major genome rearrangements spanning nonrepetitive regions of the genome (33). In addition, we did not detect the appearance of chromosome 5L isochromosome [i(5L)] (M. McClellan and J. Berman, data not shown).
Stability of increased drug resistance.Increased fluconazole resistance in the adaptive mutants could arise from transient physiological changes or more stable genetic changes. To ask if the increased drug resistance was stable, adaptive mutants isolated from the DP-1 and DP-2 populations were subjected to serial transfer for approximately 30 generations in the ab-sence of fluconazole, and then the MICs of the transferred isolates were compared to the MICs of the original mutants. Importantly, the MIC values of all of the adaptive mutants tested did not decrease following the nonselective serial trans-fer and always remained higher than the MIC values of the
parental strain, suggesting that the drug resistance is stable for a period of at least 30 generations (Fig. 5) and is likely due to a genetic change.
DISCUSSION
Fitness cost of drug resistance.The fitness effect associated with a resistance mutation plays a key role in determining whether the resistant genotype can be maintained and whether it has the possibility of becoming dominant in the population (3, 4). In most bacteria, a drug-resistant phenotype is acquired via horizontal gene transfer and is usually accompanied by a fitness cost in the absence of the drug. Thus, it is expected that, in the absence of drug, the proportion of the population rep-resented by the drug-resistant subpopulation will decrease or be eliminated from the population. Alternatively, further evo-lution in the absence of drug can give rise to compensatory mutations, resulting in improved fitness of drug-resistant mu-tants (4, 17, 20, 30). In fungal cells, where resistance is acquired via changes in the genome rather than via horizontal gene transfer, the situation appears to be more complex.
Most of the adaptive mutants that evolved in the presence of drug showed no significant decrease in relative fitness in the absence of the drug. This is similar to other studies in C.
albicans, where the acquisition of antifungal drug resistance
was accompanied by no immediate fitness cost (2, 7). In fact, several adaptive mutants isolated from the DP-2 population exhibited increases in relative fitness compared to the parental strain in the absence of drug (Fig. 3 and Table 2). In one study, the initial fitness costs that were likely associated with antifun-gal drug resistance in one population decreased upon further evolution (8). In another study, the drug resistance acquired by
C. albicans after evolution in fluconazole was unstable and
reverted to the drug-susceptible phenotype after serial pas-sage in the absence of the drug (5). The reversion to a drug-susceptible phenotype in the absence of the drug sug-gests that some mechanisms of drug resistance are associ-ated with a fitness cost.
The different degrees of reversion of this resistance are likely due to the specific mechanism that confers resistance, as
FIG. 4. Detection of genome rearrangements using SfiI-digested chromosomes separated by CHEF gel electrophoresis. The arrow in-dicates a novel band migrating in strains DP-1-M6 and DP-1-M7. Subsequent analysis indicated that this band corresponds to ChrR and is hypothesized to include altered numbers of rDNA repeats (Mc-Clellan and Berman, data not shown).
FIG. 5. Stability of drug resistance. Shown are the MIC values for one of the parental strains and all of the isolated adaptive mutants from the fluconazole-exposed populations before and after serial pas-sage in the absence of the drug for more than 30 generations.
on September 8, 2020 by guest
http://ec.asm.org/
well as to the genetic changes that gave rise to it. For example, increased levels of efflux pump activity likely incur a fitness cost because the cell expends energy in removing not only drug, but also nutrients, from the cell. Alternatively, a minor change in the conformation of an enzyme involved in sterol biosynthesis may not have much effect on the efficiency of the process in the absence of drug. Similarly, an aneuploidy that confers drug resistance, such as i(5L), may be acquired (and lost) rapidly via mitotic nondisjunction, irrespective of whether it incurs a large fitness cost. In contrast, once point mutations are acquired (which is a lower-frequency event), reversion of these muta-tions may require precise changes that also arise less fre-quently.
The appearance of adaptive mutants that had large increases in ploidy is of particular interest, as is the fact that these ploidy differences did not appear to persist in the populations. DP-1-M6, an isolate from a fluconazole-exposed population, has an
⬃3N ploidy and did not exhibit a decrease in fitness compared with the parental strain but did show a decrease in relative fitness in the presence of the drug compared to the previous adaptive mutant from the same population. The other event appeared in the no-drug control population, where it is impor-tant to note that cells were maintained under limiting glucose, which is considered a stress condition (11). Importantly, we did not detect the appearance of i(5L) (McClellan and Berman, data not shown), a rearrangement that causes fluconazole re-sistance (34). The only detectable genome rearrangements were most likely due to alterations in the lengths of the rDNA repeat tracts on ChrR and alterations in the lengths of MRS tracts on Chr6 and -7. The lack of observed gross chromosomal rearrangements that are generally associated with increased fluconazole resistance and the stability of the increased drug resistance in the absence of the drug suggest that the resistance mechanisms are due to single nucleotide polymorphisms (SNPs) and other stable genome rearrangements that are not detectable by CHEF analyses (33). It is possible that some of the beneficial mutations were already present in the initial colony or during the batch growth phase prior to initiation of the continuous-culture experiments (13) and are thus not a result of the selection process in the chemostats. However, with the use of VERT, we were able to identify multiple adap-tive events that occurred in different fluorescent subpopula-tions during the course of the laboratory evolution, and thus, it is unlikely that all the beneficial mutations were already pres-ent prior to the start of evolution. Future work will use whole-genome transcriptional profiling and resequencing to identify all genome changes in the isolated adaptive mutants and the parental strains, allowing us to address the possibility of the issue mentioned above and to shed light on their resistance mechanisms.
Relationship between the evolutionary dynamics and rela-tive fitness of adaprela-tive mutants.Theoretically, each adaptive mutant isolated from an observed adaptive event should be fitter than the adaptive mutant isolated from the previous expanding subpopulation (e.g., M3 should be fitter than M2 from the same population). Consistent with this, most of the isolated adaptive mutants exhibit increased fitness compared with the previous adaptive mutant. Nonetheless, some excep-tions appeared: adaptive mutants DP-1-M6 (generation 146), DP-2-M4 (generation 64), and DP-2-M7 (generation 112)
ex-hibited negative relative fitness coefficients in the presence of the drug, suggesting that they were less drug resistant than the previous adaptive mutant. MIC measurements confirmed this for DP-2-M4 and DP-2-M7 but not for DP-1-M6. Here, we offer some potential explanations for these exceptions. The observed expansion leading to the isolation of the DP-2-M7 was likely due to noise in the measurements rather than to a
bona fideadaptive event, since the expansion occurred during
a quasi-steady state for the relative proportions of the three FP subpopulations from generation⬃100 to generation⬃112 and only one time point exhibited that increase in the GFP sub-population at generation 112. The relative fitness coefficient measurements further supported this idea: this GFP isolate was less fit than the previous adaptive mutant (DP-2-M6 iso-lated from the RFP subpopulation) in the presence of drug. Alternatively, complex interactions in the population that can-not be detected with the 3-color VERT analysis could contrib-ute to the transient increase in the GFP population. In con-trast, the green expansion that led to the isolation of DP-2-M4 was clearly an adaptive event, based on the population dynam-ics. However, none of the 8 clones isolated from the green subpopulation at generation 64 from the DP-2 population showed an increase in fitness relative to DP-2-M3. Based on the rate of expansion of the green subpopulation, it is unlikely that the expanding adaptive mutant was in a small proportion of the population. Thus, either the actual adaptive mutant responsible for the observed expansion was not present among the 8 colonies picked or the condition used for the relative fitness coefficient measurements was not able to recapitulate the relative fitness benefit of DP-2-M4 during the evolution experiment. Even though the DP-2-M4 and DP-2-M7 clones may not have been responsible for the expansion of the colored subpopulations, both are adaptive mutants, as they had in-creased fitness compared to the parental strain in the presence of fluconazole.
We expected that the expanding subpopulation prior to each stepwise increase in the fluconazole concentration would con-tinue expanding, as it likely contained the fittest mutant in the population at that time point. However, this trend was not observed in the DP-2 population; rather, after each stepwise increase in the fluconazole concentration, a different FP sub-population began expanding. For example, prior to generation 64, the GFP subpopulation was expanding, but after the in-crease in the drug concentration, the RFP and YFP subpopu-lations started to expand, and the YFP adaptive mutant iso-lated (DP-2-M5) was indeed more drug resistant than the GFP adaptive mutant isolated prior to the drug increase (DP-2-M4). One explanation for this observation is that the adaptive mu-tant, DP-2-M5, may have been present in the YFP subpopu-lation prior to generation 64 but was at a low enough frequency or was not expanding fast enough to result in an observed expansion of the YFP subpopulation prior to the increase in the fluconazole concentration. This further demonstrates the effects of clonal interference on the evolving population struc-ture and highlights the complex dynamics present in an evolv-ing population.
Since evolving populations are likely to be heterogeneous, it is also possible that there are interactions between different mutants within the population similar to mutual and/or com-mensal interactions that occur between communities of
on September 8, 2020 by guest
http://ec.asm.org/
isms growing within the host. These types of interactions have been observed in vitro in a long-term adaptive-evolution ex-periment withEscherichia coliunder glucose limitation (26), where adaptive mutants that exhibit cross-feeding of different metabolites establish a stable coexistence. In this scenario, the increase in fitness of the adaptive mutant in the evolving en-vironment would not be detected in the pairwise competition experiments used to study fitness relationships. Thus, we can-not rule out the possibility that complex interactions also con-tributed to some of the observed expansions in the populations that evolved here.
Relationship between the fluconazole MIC and relative fit-ness coefficients.The MIC of an antifungal agent is an impor-tant indicator of drug susceptibility (reviewed by White et al. [41]). However, the relationship between the MIC value of a pathogen and its ability to adapt to the environment is not linear eitherin vivoorin vitro(7, 25). The short-term adaptive-evolution experiments reported here for a continuous-culture system support the idea that the MIC alone does not predict the relative fitness of a strain in the presence of drug. Further-more, for the majority of the adaptive clones isolated, there was no fitness cost associated with increases in the fluconazole MIC, which is consistent with other studies ofin vitro-evolved isolates (35). Similarly, no correlation between relative fitness coefficients and MIC values was detected in the adaptive clones. For example, DP-2-M9 showed a significant increase in fitness in the presence of drug relative to DP-2-M8, yet its MIC was reduced relative to DP-2-M8 (Table 1). The different growth conditions and methods of measurement most likely explain these differences: the MIC was determined using Etest strip assays, where cells were grown on RPMI 1640 agar plates; fitness was determined by using pairwise competition experi-ments in chemostats with YNB liquid medium containing flu-conazole. Thus, our data support the idea that the MIC does not provide a direct measure of competitive fitness (7).
Conclusions. The emergence of drug resistance in fungal pathogens is dynamic. Time course samples collected from patients undergoing antifungal treatments provide data on the evolution of pathogensin vivo. However, due to the limited number of clones isolated, the population dynamics during the emergence of drug resistance in vivo has been difficult to assess.In vitroevolution of multiple populations in parallel provides a more controlled environment for the study of population dynamics. However, traditional adaptive-evolu-tion experiments do not follow evoluadaptive-evolu-tionary dynamics due to the lack of real-time indications of when adaptive mutants arise and expand in the population. We addressed this chal-lenge using VERT with C. albicans isolates evolving in the presence of fluconazole to isolate adaptive mutants in a more systematic manner. Importantly, we detected an increase in the frequency of adaptive events in the presence of the drug. Fur-thermore, isolates from one of the fluconazole-exposed popu-lations evolved a general increase in fitness compared to the parental strain in the absence of the drug, suggesting that drug resistance mechanisms do not always come with an obvious fitness cost. In addition, these resistance mechanisms are stably maintained for at least 30 generations in the absence of the drug.
ACKNOWLEDGMENTS
We thank Maryam Gerami-Nejad for expert technical assistance with strain construction.
Partial financial support was provided by U.S. NSF grant MCB-1054276 and the Texas Engineering Experimental Station (TEES) to K.C.K. and NIH R01 AI0624273 to J.B.
REFERENCES
1.Anderson, J. B.2005. Evolution of antifungal-drug resistance: mechanisms
and pathogen fitness. Nat. Rev. Microbiol.3:547–556.
2.Anderson, J. B., et al.2003. Mode of selection and experimental evolution of
antifungal drug resistance in Saccharomyces cerevisiae. Genetics163:1287–
1298.
3.Andersson, D. I. 2003. Persistence of antibiotic resistant bacteria. Curr.
Opin. Microbiol.6:452–456.
4.Andersson, D. I., and D. Hughes.2010. Antibiotic resistance and its cost: is
it possible to reverse resistance? Nat. Rev. Microbiol.8:260–271.
5.Calvet, H. M., M. R. Yeaman, and S. G. Filler.1997. Reversible fluconazole resistance in Candida albicans: a potential in vitro model. Antimicrob.
Agents Chemother.41:535–539.
6.Cowen, L. E., J. B. Anderson, and L. M. Kohn.2002. Evolution of drug
resistance in Candida albicans. Annu. Rev. Microbiol.56:139–165.
7.Cowen, L. E., L. M. Kohn, and J. B. Anderson.2001. Divergence in fitness and evolution of drug resistance in experimental populations of Candida
albicans. J. Bacteriol.183:2971–2978.
8.Cowen, L. E., et al.2002. Population genomics of drug resistance in Candida
albicans. Proc. Natl. Acad. Sci. U. S. A.99:9284–9289.
9.Cowen, L. E., et al.2000. Evolution of drug resistance in experimental
populations of Candida albicans. J. Bacteriol.182:1515–1522.
10.Desai, M. M., and D. S. Fisher.2007. Beneficial mutation selection balance
and the effect of linkage on positive selection. Genetics176:1759–1798.
11.Dunham, M. J., et al.2002. Characteristic genome rearrangements in exper-imental evolution of Saccharomyces cerevisiae. Proc. Natl. Acad. Sci.
U. S. A.99:16144–16149.
12.Gerrish, P. J., and R. E. Lenski.1998. The fate of competing beneficial
mutations in an asexual population. Genetica102–103:127–144.
13.Gresham, D., et al. 2008. The repertoire and dynamics of evolutionary adaptations to controlled nutrient-limited environments in yeast. PLoS
Genet.4:e1000303.
14.Kao, K. C., and G. Sherlock.2008. Molecular characterization of clonal
interference during adaptive evolution in asexual populations of
Saccharo-myces cerevisiae. Nat. Genet.40:1499–1504.
15.Katiyar, S., M. Pfaller, and T. Edlind.2006. Candida albicans and Candida glabrata clinical isolates exhibiting reduced echinocandin susceptibility.
An-timicrob. Agents Chemother.50:2892–2894.
16.Lephart, P. R., H. Chibana, and P. T. Magee.2005. Effect of the major repeat sequence on chromosome loss in Candida albicans. Eukaryot. Cell
4:733–741.
17.Levin, B. R., V. Perrot, and N. Walker.2000. Compensatory mutations, antibiotic resistance and the population genetics of adaptive evolution in
bacteria. Genetics154:985–997.
18.Lo¨ffler, J., et al.2000. Phospholipid and sterol analysis of plasma mem-branes of azole-resistant Candida albicans strains. FEMS Microbiol. Lett.
185:59–63.
19.Lyons, C. N., and T. C. White.2000. Transcriptional analyses of antifungal
drug resistance in Candida albicans. Antimicrob. Agents Chemother.44:
2296–2303.
20.Maisnier-Patin, S., and D. I. Andersson.2004. Adaptation to the deleterious effects of antimicrobial drug resistance mutations by compensatory
evolu-tion. Res. Microbiol.155:360–369.
21.Mansfield, B. E., et al.2010. Azole drugs are imported by facilitated diffusion
in Candida albicans and other pathogenic fungi. PLoS Pathog.6:e1001126.
22.Marr, K. A., C. N. Lyons, T. R. Rustad, R. A. Bowden, and T. C. White.1998. Rapid, transient fluconazole resistance in Candida albicans is associated with
increased mRNA levels of CDR. Antimicrob. Agents Chemother.42:2584–
2589.
23.McNeil, M. M., et al.2001. Trends in mortality due to invasive mycotic
diseases in the United States, 1980–1997. Clin. Infect. Dis.33:641–647.
24.Pfaller, M. A., and D. J. Diekema.2007. Epidemiology of invasive
candidi-asis: a persistent public health problem. Clin. Microbiol. Rev.20:133–163.
25.Rex, J. H., M. G. Rinaldi, and M. A. Pfaller.1995. Resistance of Candida
species to fluconazole. Antimicrob. Agents Chemother.39:1–8.
26.Rosenzweig, R. F., R. R. Sharp, D. S. Treves, and J. Adams.1994. Microbial evolution in a simple unstructured environment: genetic differentiation in
Escherichia coli. Genetics137:903–917.
27.Sanglard, D., F. Ischer, M. Monod, and J. Bille.1997. Cloning of Candida albicans genes conferring resistance to azole antifungal agents:
characteriza-tion of CDR2, a new multidrug ABC transporter gene. Microbiology143:
405–416.
28.Sanglard, D., et al.1995. Mechanisms of resistance to azole antifungal agents
on September 8, 2020 by guest
http://ec.asm.org/
in Candida albicans isolates from AIDS patients involve specific multidrug
transporters. Antimicrob. Agents Chemother.39:2378–2386.
29.Sanglard, D., and F. C. Odds.2002. Resistance of Candida species to anti-fungal agents: molecular mechanisms and clinical consequences. Lancet
In-fect. Dis.2:73–85.
30.Schoustra, S. E., A. J. Debets, M. Slakhorst, and R. F. Hoekstra.2006. Reducing the cost of resistance; experimental evolution in the filamentous
fungus Aspergillus nidulans. J. Evol. Biol.19:1115–1127.
31.Selmecki, A., S. Bergmann, and J. Berman.2005. Comparative genome hybridization reveals widespread aneuploidy in Candida albicans laboratory
strains. Mol. Microbiol.55:1553–1565.
32.Selmecki, A., A. Forche, and J. Berman.2006. Aneuploidy and
isochromo-some formation in drug-resistant Candida albicans. Science313:367–370.
33.Selmecki, A., A. Forche, and J. Berman.2010. Genomic plasticity of the
human fungal pathogen Candida albicans. Eukaryot. Cell9:991–1008.
34.Selmecki, A., M. Gerami-Nejad, C. Paulson, A. Forche, and J. Berman.2008. An isochromosome confers drug resistance in vivo by amplification of two
genes, ERG11 and TAC1. Mol. Microbiol.68:624–641.
35.Selmecki, A. M., K. Dulmage, L. E. Cowen, J. B. Anderson, and J. Berman.
2009. Acquisition of aneuploidy provides increased fitness during the
evolu-tion of antifungal drug resistance. PLoS Genet.5:e1000705.
36.Singh, S. D., et al.2009. Hsp90 governs echinocandin resistance in the
pathogenic yeast Candida albicans via calcineurin. PLoS Pathog.5:e1000532.
37.Vanden Bossche, H., et al.1998. Antifungal drug resistance in pathogenic
fungi. Med. Mycol. 36(Suppl. 1):119–128.
38.White, T. C.1997. Increased mRNA levels of ERG16, CDR, and MDR1 correlate with increases in azole resistance in Candida albicans isolates from a patient infected with human immunodeficiency virus. Antimicrob. Agents
Chemother.41:1482–1487.
39.White, T. C.1997. The presence of an R467K amino acid substitution and loss of allelic variation correlate with an azole-resistant lanosterol 14alpha
demethylase in Candida albicans. Antimicrob. Agents Chemother.41:1488–
1494.
40.White, T. C., S. Holleman, F. Dy, L. F. Mirels, and D. A. Stevens.2002. Resistance mechanisms in clinical isolates of Candida albicans. Antimicrob.
Agents Chemother.46:1704–1713.
41.White, T. C., K. A. Marr, and R. A. Bowden.1998. Clinical, cellular, and molecular factors that contribute to antifungal drug resistance. Clin.
Micro-biol. Rev.11:382–402.
42.Wirsching, S., S. Michel, and J. Morschhauser.2000. Targeted gene disrup-tion in Candida albicans wild-type strains: the role of the MDR1 gene in fluconazole resistance of clinical Candida albicans isolates. Mol. Microbiol.
36:856–865.
43.Wirsching, S., G. P. Moran, D. J. Sullivan, D. C. Coleman, and J. Morschhauser.2001. MDR1-mediated drug resistance in Candida
dublini-ensis. Antimicrob. Agents Chemother.45:3416–3421.
44.Zaoutis, T. E., et al.2005. The epidemiology and attributable outcomes of candidemia in adults and children hospitalized in the United States: a
pro-pensity analysis. Clin. Infect. Dis.41:1232–1239.
![FIG. 1. Evolutionary dynamics of experimental populations evolved either in the absence (CP-1 population [A] and CP-2 population [B]) orpresence (DP-1 population [C] and DP-2 population [D]) of fluconazole](https://thumb-us.123doks.com/thumbv2/123dok_us/8681824.1733673/3.594.70.516.73.391/evolutionary-experimental-populations-population-orpresence-population-population-uconazole.webp)