---ABSTRACT--- In the recent years, there has been a strong growth in the number and the size of image databases. Large image databases typically consist of different types of photographic archives. Also the number of industrial image databases has grown remarkably due to a rapid increase of industrial imaging systems. Image databases often need to organize the images automatically by their content. Clustering operations can be applied for the content based organization of the images. In the present study an efficient method is proposed for the clustering of large image databases. The method is based on hierarchical clustering of the image database using grid. In this paper, the grid-based clustering methods are applied to fast image database browsing and retrieval. Proposed clustering methods are tested using real image databases.
Keywords: image database, clustering, retrieval, browsing
--- Paper submitted: 21 July 2009 Accepted: 13 September 2009
---
1. INTRODUCTION
arge image databases typically consist of different types of photographic archives. Also the number of industrial image databases has grown remarkably due to a rapid increase of industrial imaging systems. Therefore, a growing research interest has been focused on the area of content-based search and retrieval of the image databases. Image database browsing and retrieval are two common applications of the image database search. Intensive research work has been done in the image retrieval, whereas less information is available for browsing. A problem with retrieval systems is the fact that they require an example image from the user to be used as a query image. Therefore, the user has to browse the database beforehand in order to find good example images for the query. This is a difficult and time-consuming task, especially in the case of large image databases (>10 000 images). Hence, an effective method for image database browsing is essential to show the user the database content. Cai et al. [2], for example, have used agglomerative k-means clustering in image browsing. Another key problem with retrieval in large image
databases is response time. Namely, for each query the whole database has to be searched to find the images that are most similar to the query image. When the database contains tens or hundreds of thousands of images, the response times increase remarkably.
Grid-based clustering methods make it possible to form arbitrarily shaped, distance independent clusters. In these methods, the feature space is quantized into cells using a grid structure. The cells can be merged together to form clusters. Grid-based clustering was originally based on the idea of Schikuta [10] to organize the feature space containing patterns. Rauhamaa and Reinius [9] has used topological neighbor search algorithm to combine the grid cells to form clusters. Yu et al. [1] have presented a density-based clustering method using grid.
In the present study, we present a grid-based clustering method that can be used in the content-based organization of image databases. The advantage of grid-based methods is fast processing time, which is dependent only on the number of the grid cells, not the number of database
Classification of Large Image Databases Using
Grid-Based Clustering
Rekha B Venkatapur11
Asst. Professor, Dept. of CSE
A P S College of Engineering, Bangalore-78, Karnataka, India, EMail: [email protected]
Dr. V.D.Mytri2
2
Principal, GND College of Engineering, Bidar, Karnataka, India, EMail: [email protected]
Dr. A.Damodaram3 3
Professor of CSE & Vice Principal, J N T U College of Engineering, Hyderabad, India
EMail: [email protected]
images. In the grid structure, arbitrarily shaped clusters can be formed by merging the cells together based on their density. In the image database browsing, the content of each cluster can be presented for the user using representative image(s) of the cluster. The hierarchical grid structure makes it possible to move up and down in the grid levels. This way the user can either zoom in, to select a specific image type of interest, or zoom out, to browse the variations in the image database contents? In image retrieval, increased efficiency can be achieved: In the clustered image database, only clusters of user’s interest can be selected to the retrieval operations. Therefore, the whole database is not needed to be searched at each query.
2. CLUSTERING METHOD
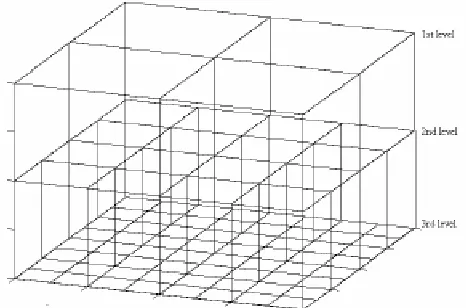
Grid -based clustering methods have been used in some data mining tasks of very large databases [3]. In the grid-based clustering, the feature space is divided into a finite number of rectangular cells, which form a grid. In this grid structure, all the clustering operations are performed. The grid can be formed in multiple resolutions by changing the size of the rectangular cells. Figure 1 presents a simple example of a hierarchical grid structure in three levels that is applied to a two dimensional feature space.
In the case of d-dimensional space, hyper rectangles (rectangular shaped cube [9]) of d-dimensions correspond to the cells. In the hierarchical grid structure, the cell size in the grid can be decreased in order to achieve a more precise cell structure. As in figure 1, the hierarchical structure can be divided into several levels of resolution. Each cell at the high level k is partitioned to form a number of cells at the next lower level k+1. The cells at the level k+1 are formed by splitting the cell at level k into smaller subcells. In the case of figure 1, each cell produces four subcells at next lower level.
Figure 1. An example of hierarchical grid structure in two-dimensional feature space.
When the images are searched at the low level, the number of the cells is typically high, and similar images occur in several cells. Therefore, the cells containing similar images are needed to be merged together to form clusters. The cells at a selected level can be merged into clusters of similar images using density-based clustering procedure. In the density- based clustering, a cluster is defined to be a region that has a higher density of points than its surrounding region [11], [3]. Hence, the clusters are separated from each other by regions of low density.
In the image databases, the feature vectors describing the image content are often high dimensional. In our approach, the high dimensional feature space is reduced into several low dimensional subspaces. This makes it possible to form density-based clusters in the grid structure. The idea of subspace clustering has been used in the work of Yu et al. [1]. In the subspace clustering, the subspaces are considered first separately. The final cluster structure is then formed by combining the clusters obtained in each subspace.In the subspace clustering, U subspaces are formed based on the original, d-dimensional feature space. These subspaces are partitioned using rectangular cells, in which density estimation is performed. Each dimension is partitioned into the same number of cells of equal size, which means that they have same volume. Therefore, the density in the cell can be approximated simply by finding the number of points that lie inside each cell [1]. Subclusters are formed in each subspace separately by finding the local minimums of the density function approximated for the cells. An example of this is presented figure 2a, in which the density functions of each dimension are plotted on the axes of two-dimensional feature space.
The local minimums define the borders between the groups of cells that form subclusters. Let Su denote a set
of cells that is defined using a grid structure in subspace u. In subclustering, the grid is divided into n parts based on the local minimums of the density function. Hence Su
consists of several sets of cells {S u1 , Su2 , …, S un}, which
are called subclusters. When the subclustering has been performed in each U subspaces, the resulting set of subclusters is S = {S1 , S2 , …, SU}, in which each set
represents the subclusters of each subspace. Let S denote the total number of the subclusters in all sets. The final clusters are formed by combining these subclusters. Final clusters C are defined as an intersection of the subclusters of each subspace:
S
j i
j
i
S
S
C
1 , 1 =
=
=
i
≠
j
(2.1)of the feature space of figure 2a is presented in figure 2b. The benefit of this approach is that any distance measurement between the data points is not needed. Also the computational cost of this approach is low, which makes it suitable to fast retrieval of image database.
Figure 2. Density-based clustering of the data points in a two dimensional grid structure.
3. APPLICATIONS AND EXPERIMENTS
In this section, we present two applications for the grid-based image database clustering. These applications are fast retrieval and browsing of large image databases. For testing, we use defect image databases that are collected from paper and metal manufacturing processes. The reason for the collection of the defect image databases in process industry is the practical need of controlling the quality and production [8]. However, these image databases can be utilized only if the process operators are capable of browsing and effectively searching the image databases. Preliminary work in the defect image clustering was presented in [6], in which the clustering procedure was based on k-nearest neighbor classifier.
In this paper, we have used three defect image databases. Labeled paper and metal image databases contained 1204 and 1943 gray level images, respectively. Images of both databases were labeled manually in advance based on the defect type that they represent. In addition to them, we used also an unlabeled paper defect image database of about 15,000 images. The images in all databases images were indexed using color and shape descriptors. The gray level content of the defect images was described using color structure (CS) and color layout (CLD) descriptors of MPEG-7 standard [7]. Mean gray level and gray level variance of the images were also used as additional features. The dimensionality of the gray level descriptors was decreased by re-quantizing image gray levels. Experimental results [5] show that the defect image content can be generalized by decreasing the number of image gray levels, which yields to better classification results. The defect shape was described using five simple shape descriptors, convexity, compactness, principal axes ratio, circular variance and elliptic variance. These descriptors have proved to be effective in the classification of defect images [6]. Resulting feature space
of gray level and shape descriptors was 15-dimensional.
3.1. Browsing and retrieval
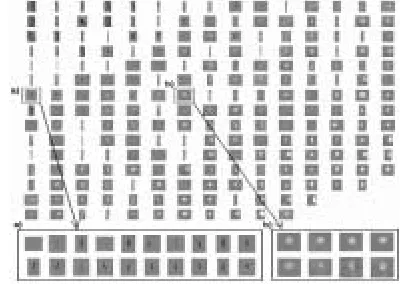
The goal of image database browsing is to show the user a view of representative images of the database content. These images can be selected as the centroid images of each cell at a selected level of the hierarchical grid structure. In figure 3a browsing view of paper defects that is based on a grid-structure in the feature space is presented. This is an example of the use of the hierarchical browsing: When a desired image type is found at a certain level, the associative clusters can be taken into closer inspection (they can be zoomed in). Hence, two clusters are selected and the contents of them are presented in figures 3a and 3b. This way the user can browse the image types of his/her interest. The size of the browsing view can be changed by selecting different levels in the hierarchical structure.
Figure 3. An example of the browsing view of the paper defect images. From this image, two clusters (a and b) are selected to a closer inspection. The contents of these clusters are presented in subfigures a and b.
Grid-based clustering is applied to fast retrieval. The idea is to divide the image database into clusters before the retrieval operations are performed. This way the retrieval operations can be applied only to the clusters that are relevant to the query image. The relevant clusters are selected by comparing the query image to the representative (centroid) images of each cluster. The retrieval experiments were made using each database image as a query image in turn. In each query, we selected a set of clusters, which were closest to the query image. Because with the real image data the size of the clusters is very varying, the number of the clusters to be selected to the retrieval set varies also strongly.
database images. In the experiments, retrieval accuracy was measured by defining an average precision/recall curve for each query (figure 4). In this figure, the retrieval comparison is made to the whole (unclustered) database. The figure shows that the precision value is almost the same as in the case of the whole database search, when the retrieval is applied for 50% of the database. In addition, using only 10% of the images, precision is not impaired significantly (but retrieval time is decreased 90%, because only 10% of the database is searched).
Figure 4. Average precision/recall curves of the queries made in the both image databases.
3.2. Computational cost
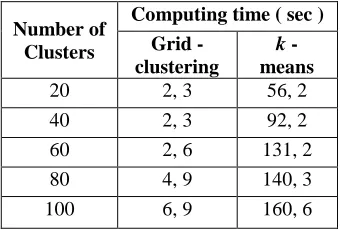
The computational complexity of our clustering method was measured using a large, unlabeled paper defect image database that contained about 10 500 images. Table 1 presents the computing time of the clustering for different numbers of clusters. The computing time of grid-based clustering is compared to that of k-means clustering. The computation was made using Matlab Package. Table 1 show that there is a significant difference between the computational cost of the grid-based clustering and means algorithm. The reason for this difference is that k-means is an iterative algorithm, which makes it heavy, especially in the case of large databases.
Table. 1 Computing time of the clustering in the large paper defect database of 30, 000 images
Number of Clusters
Computing time ( sec )
Grid - clustering
k - means
20 2, 3 56, 2
40 2, 3 92, 2
60 2, 6 131, 2
80 4, 9 140, 3
100 6, 9 160, 6
4. RESULTS AND DISCUSSION
In this paper we have presented a grid-based approach to the organization of image databases. We presented two practical applications for the use of this technique, image database browsing and fast retrieval. In the browsing, the hierarchical cluster structure makes it possible to zoom in, to select a specific image type to closer inspection, or zoom out, to browse the variations of the image database content. The second application is fast image retrieval. Especially in the case of large image databases, it is time-consuming to go through the whole database at each query. However, when the queries are carried out in the clustered database, the queries can be focused only in the clusters that contain most relevant images. Hence the whole database is not needed to be searched, which saves computational time in the retrieval. In the case of large image databases (>10 000 images), the clustering method should be fast. We compared the speed of our grid-based clustering method to k-means algorithm that has been used in hierarchical image browsing for example in [2]. The results presented in figure 4 show that grid-based approach outperforms k-means algorithm in computational lightness.
5. CONCLUSION
The grid-based clustering procedure proved to be effective in the content-based organization of large image databases. Therefore this method is suitable to be used in the retrieval and browsing of large image databases, which require fast processing time.
REFERENCES
[1]. H. Yu, M. Li, H.-J. Zhang and J. Feng. Color texture moments for content-based image retrieval. In International Conference on Image Processing, pages 24–28. 2002.
[2]. D. Cai, X. He, W.-Y. Ma, J.-R. Wen and H.-J. Zhang. "Organizing WWW Images Based on The Analysis of Page Lay- out and Web Link Structure", in The 2004 IEEE International Conference on Multimedia and EXPO, 2004. [3]. R. Agrawal, J. Gehrke, D. Gunopulos, P.
Raghavan, “Automatic Subspace Clustering of High Dimensional Data for Data Mining Applications”, Proceedings of 1998 ACM-SIGMOD, pp. 94-105, 1998
[4]. Ulges, A., Schulze, C., Keysers, D., Breuel, T.M.: Content-based video tagging for online video portals. In: MUSCLE/Image-CLEF Workshop. (2007)
[6]. I. Kunttu, L. Lepistö, J. Rauhamaa, A. Visa, “Image Correlogram in Image Database Indexing and Retrieval”, Proceedings of 4th European Workshop on Image Analysis for Multimedia Interactive Services, pp. 88-91, 2003.
[7]. I. Kunttu, L. Lepistö, J. Rauhamaa, and A. Visa, “Classification Method for Defect Images Based on Association and Clustering”, Proceedings of SPIE, Vol. 5098, pp. 19-27, 2003.
[8]. B. S. Manjunath, J.-R. Ohm, V. V. Vasuvedan, A. Yamada, “Color and Texture Descriptors”, IEEE Transactions on Circuits and Systems for Video Technology, Vol. 11, No. 6, pp. 703-715, 2001. [9]. J. Rauhamaa, and R. Reinius, “Paper Web Imaging
with Advanced Defect Classification”, Proceedings of the 2002 TAPPI Technology Summit, 2002. [10]. E. Schikuta, “Grid-Clustering: An Efficient
Hierarchical Clustering Method for Very Large Data Sets”, Proceedings of the 13th International Conference on Pattern Recognition, Vol. 2, pp. 101-105, 1996.
[11]. S. G. Chan and F. Tobagi Hierarchical storage systems for interactive Video-on-demand Technical Report, Stanford University, Computer Systems Laboratory, Number CSL-TR-97-723, p. 84. 1997
Authors Biography
Rekha B. Venkatapur, Presently working as Asst. Professor, Dept. of CSE, A P S College of Engineering, Bangalore-78, Karnataka, India, since 2001 having an total teaching experience of 17 Years. Doing research in the areas of data mining and Image processing. I have published 5 Papers at International journals and presented 8 papers at National conferences.
Dr. V.D. Mytri Presently working Principal, GND College of Engineering, Bidar, Karnataka, India. Professor is having a vast 30 Years of teaching experience. Professor has worked 29 Years at PDA College of Engineering starting from Lecturer to Principal. He has completed his Ph.D at Indian Institute of Science Bangalore. His interest of research areas are Image Processing, DSP, and Data Mining He has guided 4 Ph.D scholars and presently guiding 3 Ph.D scholars.
[Dr. A. Damodaram, Presently he is working
as Professor in CSE AND Vice Principal, JNTU, Hyderabad. He joined JNTU, Hyderabad in 1989. He is having 20 Years of Teaching Experience. He has guided so far 3 Ph.D scholars and presently guiding 5 Ph.D Scholars. His