Original Research Article
Prevalence of risk factors for non-communicable diseases in
urban slum of Salem, Tamil Nadu
Jeevithan Shanmugam
1, Dhanasekar Gurupatham
2*, Archana Arumugam
3INTRODUCTION
In the recent years, Non-communicable diseases have become the major cause for morbidity and mortality worldwide especially in the developing countries. India being a developing country is also experiencing the transition from the phase of predominantly infectious diseases to the phase of infectious diseases, chronic
non-communicable diseases and injuries due to the behavioral risk factors prevailing among the people.
According to the World Health Organization (WHO) 2014 estimates on Non-communicable diseases in India, they are estimated to account for a total of 60% mortality which includes CVDs (26%), cancers (7%), and chronic respiratory diseases (13%), diabetes (2%), injuries (12%) and other NCDs (12%).1
ABSTRACT
Background: Developing countries like India are experiencing increased burden of non-communicable diseases causing significant morbidity and mortality, both in urban and rural population. In this study we assessed the Risk factors of NCDs and its burden.
Methods: There are four slums in the field practice area of UHTC, Annapoorana Medical College, Salem. Out of which one slum was selected by lot sampling and the participants by simple random sampling method. This survey included a total of 512 participants (272 males, 240 females) of age >20 years. The participants were interviewed with a pre-tested questionnaire. The study instrument was based on WHO STEP wise approach for surveillance of NCDs. STEP 1 and STEP 2 were used in our study. The performa included anthropometric measurements, blood pressure and questions related to tobacco use, alcohol consumption, dietary pattern, physical exercise. Microsoft Excel 2007 was used for data entry, SPSS version 24 for data analysis.
Results: It was found that the prevalence of risk factors for NCDs was high. Tobacco use in any form was seen in 21.3% of the study population, alcohol consumption in 28.1%, overweight and obesity in 20.7%, sedentary habits in 84.6%, irregular intake of green leafy vegetables and fruits in 85% and high salt intake in 38.5% was observed.
Conclusions: The study showed higher prevalence of risk factors for NCDs. This alarms the heavy future burden of NCDs in the urban slum that requires appropriate early actions to prevent risk factors, reducing the disease burden.
Keywords: Non-communicable diseases, Urban slums, Risk factors, WHO STEPs
Department of Community Medicine, 1Karpagam Faculty of Medical Science and Research, Pollachi Main Road, Othakkal Mandapam, Coimbatore, 2Annapoorna Medical College and Hospital, Sankari Main Road, Periyaseeragapadi, Salem, Tamil Nadu, India
3
Karpagam Faculty of Medical Science and Research, Pollachi Main Road, Othakkal Mandapam, Coimbatore, Tamil Nadu, India
Received: 05 February 2018
Revised: 07 March 2018
Accepted: 08 March 2018
*Correspondence:
Dr. Dhanasekar Gurupatham, E-mail: [email protected]
Copyright: © the author(s), publisher and licensee Medip Academy. This is an open-access article distributed under the terms of the Creative Commons Attribution Non-Commercial License, which permits unrestricted non-commercial use, distribution, and reproduction in any medium, provided the original work is properly cited.
With the current trend, it is expected that by 2020 NCDs account to 73%of mortality and 60% of disease burden.2 Thereby arising an urgent need to reduce the prevalence of risk factors of NCDs.
All the non-communicable diseases have risk factors in common namely, tobacco use, alcohol consumption, physical inactivity, overweight and obesity and unhealthy dietary habits. These behavioural risk factors play a great role for the control of burden arising due to NCDs. As these risk factors are interrelated to each other, appearance of one leads to the other, thereby leading to the development of the disease.
Also, due to the chronic nature of the disease and the technological advancements needed for the care, the cost of the treatment is becoming high, causing great economic burden to the families and society. It is estimated that in India, NCDs account for the economic burden in the range of 5-10% of GDP.3
Based on the Census-2011, 31.8% of the populations in India were living in urban area, an increase of 3.35% in urban population compared to Census-2001.4
Aim and objective
To determine the prevalence of risk factors for non-communicable diseases among participants aged above 20 years residing in the urban slum of Salem district, Tamil Nadu.
METHODS
Study area
A community based cross-sectional study was carried out in the selected slum of the field practice area of UHTC, Annapoorana Medical College of Salem district, Tamil Nadu.
Sampling method
LOT sampling method for the selection of slum and simple random sampling method for the selection of participants.
Study subjects
Inclusion criteria
Inclusion criteria were individuals aged above 20 years who were willing to participate in the study.
Exclusion criteria
Exclusion criteria were person with severe chronic illness; person with physical disability; person with mental disability; pregnant and lactating women.
Data collection
The data collection was done for a period of 4 months from August 16, 2014 to December 15, 2014. There are in total 4 urban slums in the district of Salem, Tamil Nadu, out of which 1 slum was selected by lot sampling and the participants were selected by simple random sampling method. A house to house inquiry was carried out using a pre designed proforma.
Informed consent was obtained from each individual who were willing to participate in the study and a detailed interview was conducted which included personal information, demographic details and the NCD related information.
The proforma was prepared based on the WHO STEP wise approach for Surveillance of non-communicable diseases (STEPs) from which only STEP1 and STEP2 were used.5
Definition of term:
1. The body mass index (BMI) by using the Quetelet’s index:
BMI =
2. Waist circumference is measured in supine position with silent breathing at the midpoint between the lower border of the rib cage and the iliac crest. Then hip circumference is measured at the inter-trochanteric level with the patient in standing position. From these values, waist hip ratio is calculated. A value more than 1 in males and more than 0.85 in females is considered as abnormal (truncal obesity).
3. Salt intake of more than 180 g per month is considered as higher value. This is based on the average intake of salt per month by the population.
Table 1: Body mass index (WHO/FAO report on BMI).4
BMI Classification
<18.5 Underweight
18.5-24.9 Normal
24.9-29.9 Overweight
30-34.9 Obese type 1
35-39.9 Obese type 2
>40 Obese type 3
Statistical analysis
RESULTS
Socio demographic characteristics
The present study population (n=512) comprised of 53.1% male and 46.9% female with majority (37.9%) belonging to more than 60 yrs age group. Among sample population, 82.8% were literates and 17.2% were illiterates. It was found that about 14.8% were skilled workers, 21.7% were semi-skilled workers and 63.5% were unskilled workers. About 35.8% were having per capita income below Rs.2500, 56.4% were having per capita income between Rs.2500-Rs.5000, 6.8% of the study populations were getting per capita income between Rs.5000–Rs.10000, and 1% of the study
populations were getting per capita income
aboveRs.10000. About 90% of the study populations belong to the Hinduism, 7.4% were Muslims and 2.6% belong to the Christianity. Among the study population, 67.2% were married, 19.1% were single, 10.9% were widows, 1.6% was separated and 1.2% was divorcees. About 59% of study population had family size between 3 and 5, 28% of the study population had family size more than 5 and 12% with family size less than 2.88.9% of the total study population was nuclear families and 11.1% people were joint families.
Non-communicable diseases
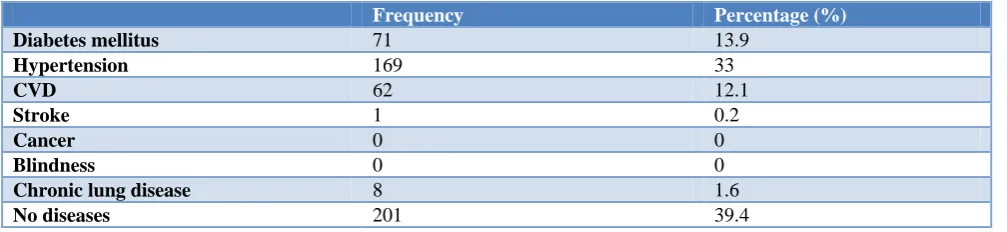
Among the study population, 13.9% were diabetics, 33% were hypertensive, 12.1% of the study population was suffering from coronary vascular diseases, 0.2% of them were having stroke and 1.6% of the population were suffering from cancer (Table 5).
Personal details
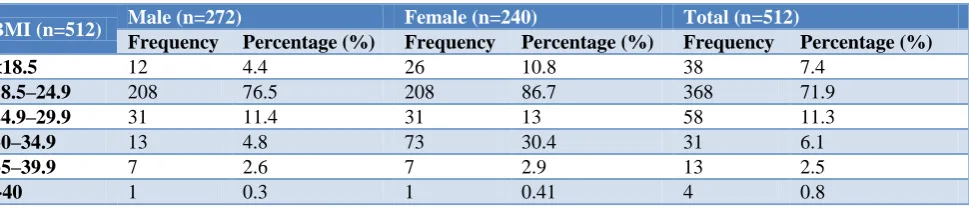
Among the study population, 7.4% had a BMI less than 18.5 kg/m2, 71.9% were between 18.5–24.9 kg/m2, 11.3% of population between 24.9 and 29.9 kg/m2, 6.1% of population between 30 and 34.9 kg/m2, 2.5% of population between 35-39.9kg/m2 and 0.8% of population had a BMI above 40kg/m2 (Table 3).
It was observed that waist hip ratio of 29% of the male population was more than 1 and 27.1% of the female population was more than 0.85 (Table 4).
Considering the dietary habits, 92.8% of the population followed mixed diet and 7.2% of the population followed vegetarian diet. High salt intake was found in 38.5% of the study population (Table 6) and irregular intake of green leafy vegetables and fruits were found in 85% of the population (Table 7).
Table 2: Socio demographic profile.
Age (n=512) Male Female
Frequency Percentage (%) Frequency Percentage (%)
20-40 68 13.3 72 14.1
41-60 97 18.9 81 15.8
>60 107 20.9 87 17
Total 272 53.1 240 46.9
Table 3: Personal details.
BMI (n=512) Male (n=272) Female (n=240) Total (n=512)
Frequency Percentage (%) Frequency Percentage (%) Frequency Percentage (%)
<18.5 12 4.4 26 10.8 38 7.4
18.5–24.9 208 76.5 208 86.7 368 71.9
24.9–29.9 31 11.4 31 13 58 11.3
30–34.9 13 4.8 73 30.4 31 6.1
35–39.9 7 2.6 7 2.9 13 2.5
>40 1 0.3 1 0.41 4 0.8
Table 4: Waist hip ratio (n=512).
Frequency Percentage (%)
Male (n=272)
>1 79 29
<1 193 71
Female (n=240)
>0.85 65 27.1
Table 5: Non-communicable diseases (n=512).
Frequency Percentage (%)
Diabetes mellitus 71 13.9
Hypertension 169 33
CVD 62 12.1
Stroke 1 0.2
Cancer 0 0
Blindness 0 0
Chronic lung disease 8 1.6
No diseases 201 39.4
Table 6: Consumption of salt intake (per month) (n=512).
Salt per Capita
Male (n=272) Female (n=240) Total (n=512)
Frequency Percentage (%) Frequency Percentage (%) Frequency Percentage (%)
<180 G 170 62.5 145 60.4 315 61.5
>180 G 102 37.5 95 39.6 197 38.5
Table 7: Consumption of green leafy vegetables and fruits (per week) (n=512).
Green leafy vegetable and fruits*
Male (n=272) Female (n=240) Total (n=512)
Frequency Percentage (%) Frequency Percentage (%) Frequency Percentage (%)
<5 servings 221 81.3 214 89.2 435 85
>5 servings 51 18.7 26 10.8 77 15
*- in frequency/week
Table 8: Tobacco usage (n=512).
Tobacco Smoking
Male (n=272) Female (n=240) Total (n=512)
Frequency Percentage (%) Frequency Percentage (%) Frequency Percentage (%)
Yes 105 38.6 4 1.7 109 21.3
No 167 61.4 236 98.3 403 78.7
Table 9: Duration of smoking tobacco use (n=109).
Duration in years Frequency Percentage (%)
<5 yrs 32 29.4
5-10 yrs 41 37.6
>10 yrs 36 33
Table 10: Consumption of alcohol (n=512).
Consumption of alcohol
Male (n=272) Female (n=240) Total (n=512)
Frequency Percentage (%) Frequency Percentage (%) Frequency Percentage (%)
Yes 144 52.9 0 0 144 28.1
No 128 47.1 240 100 368 71.9
Among the study population, 21.3% had the habit of smoking tobacco. Among males, 38.6% were smokers and among females, 1.7% was smokers. The most common type of tobacco product used was beedi (52.3%), cigarette (42.2%) and cigar (5.5%). It was found that 37.6% of the population was using tobacco products for 5 to10 years, and around 33% of the population was found to use tobacco products for more than 10 years.
Around 18.4% of the population was found to use smokeless tobacco products namely pan (54.3%), gutka (11.7%), chewable tobacco (34%) (Table 8 and 9).
of people who consume alcohol were using it for 5to 10 years and about 25.7% of the people were consuming alcohol for more than 10 years. Around 47.2% of the people who consume alcohol had the habit of consuming it every day (Table 10).
Around 84.6% of the study population was not doing any physically exercises.
DISCUSSION
The risk factors play a crucial role in the development of any non-communicable diseases. Identifying these risk factors play a major role in preventing non-communicable diseases. It helps to reduce the lag period between the exposure and the development of disease. This study describes the prevalence of the risk factors of non-communicable diseases in the population dwelling in the urban slum of Salem district, Tamil Nadu. From the study, it was observed that there was a high prevalence of risk factors for NCDs. About one-third of the population had at least one risk factor, and one fourth of the population had two or more risk factors.
There are only a limited number of studies had been done to assess the prevalence of risk factors for NCDs among urban slum areas across India.6-10 This study documented the prevalence of smoking was more in males (38.6%) compared to females (1.7%). However, the prevalence based on this study is low compared to the findings in the study done by Gupta et al in Haryana.6 (male – 40.8%, female -2.2%). Also the prevalence of smokeless tobacco was low (21.3%) when compared to study done by Gupta et al.
Based on Thankappan et al community based cross sectional study in Kerala, there was a high prevalence of risk factors for NCDs.8 Among the study population, 22.6% were tobacco users, 13.2% were alcohol users, which is much lower when compared to our study. Similar trend of higher prevalence of risk factors of NCDS was observed in the study done by Gaurav et al in urban slum of Mumbai.7
A study done by Sochaliya et al in urban area of JamNagar concluded that 38% of the participants smoke, 2% of the study population consume alcohol, 42.22% had sedentary habits, high salt intake in 96.7%, irregular intake of fruits (25.3%) and green leafy vegetables (17.33%).9
In this study, alcohol consumption was seen in 28.1% of the total study population (i.e. 52.9% of the total male population) and about 84.6% of the total populations were not doing any physical exercises.
In this study, 38.5% of the total study population consumed salt more than 180g per month and 85% of the total population was taking green leafy vegetables and fruits irregularly.8,9,11
Based on the study done by Goyal, Yusuf et al, it was observed that increased consumption of fruits and green leafy vegetables is associated with 16% lower risk of cardio vascular diseases.10
CONCLUSION
From the study conducted, it was observed that there was a higher prevalence of risk factors for NCDs in urban slum of Salem district, Tamil Nadu. The prevention of development of risk factors for NCDs can be achieved by developing special health awareness programs focusing mainly on reducing tobacco usage, alcohol consumption and promoting regular physical exercises.
The awareness programs would be a success if it focuses more on the areas where people are unaware about the non-communicable diseases and their association with the risk factors.
Funding: No funding sources Conflict of interest: None declared
Ethical approval: The study was approved by the Institutional Ethics Committee
REFERENCES
1. WHO. Non-communicable diseases by Country
Profile, India, 2014.
2. Murray CJL, Lopez AD (eds). Global burden of disease: A comprehensive assessment of morality from injuries, diseases and risk factors in 1990 and projected to 2020. Cambridge, Massachusetts: Harvard University Press: 1996.
3. Thakur JS, Prinja S, Menabde N. Social and Economic Implications of Non-communicable diseases in India. Indian J Community Med. 2011;36(1):13-22.
4. Park K. Textbook of Preventive and Social
Medicine, 24 Edition.
5. Bonita R. WHO’s response: An integrated approach
to NCD surveillance and prevention consultation on Stepwise approach to Surveillance of NCD risk factors STEPS, STERO, WHO, 2002.
6. Gupta V, Yadav K, Anand K. Patterns of tobacco use across rural, urban, and urban slum population in a north Indian community. IJCM. 2010;55:245-51.
7. Gaurav RB, Karthikeyan S. Levels of blood
pressure in an urban community. Bombay hospital journal 2001. Available at: http://www.bhj.org.in/ journal/2001_4301_jan/original_148.htm. Accessed on 24 January 2018.
8. Thankappan KR, Shah B, Mathur P, Sarma PS, Srinivas G, Mini GK, et al. Risk factor profile for chronic non-communicable diseases; Result of a community – based study in Kerala, India. Indian J Med Res. 2010;131(1):53-63.
in urban area of Jamnagar city. National J Community Med. 2012;3(4):595-600.
10. Goyal A, Yusuf S. The burden of cardiovascular disease in the Indian subcontinent. Indian J Med Res. 2006;124:235-44.
11. World Health Organization. Reducing salt intake in populations. Report of WHO Forum and Technical Meeting. Paris: 2006.